Extreme and Exceptional DroughtExpanding Across the Region
|
 |
|
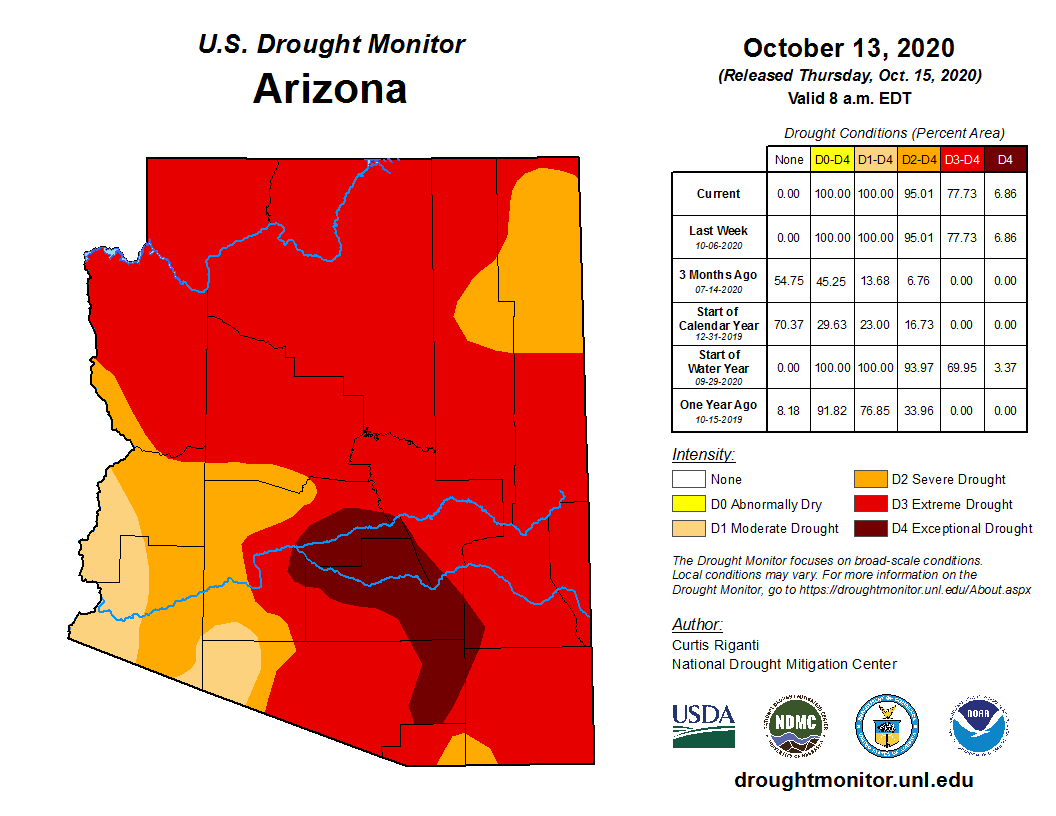
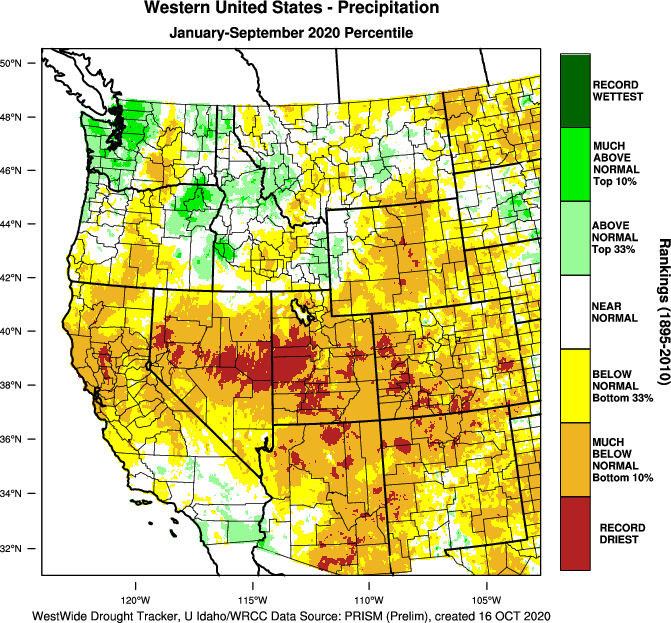
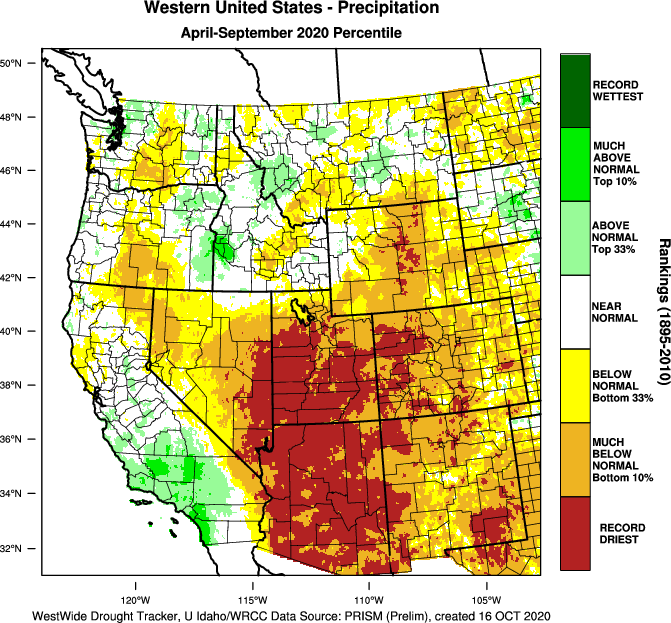
Summary: Monsoon rainfall across the region was much below normal with many locations experiencing their driest monsoon season on record. When averaged across the entire state of Arizona, the past 6 months have been the driest on record, and now many individual recording stations are ranking as a top 10 driest year-to-date on record. In addition to the much below normal precipitation, many locations set their all-time hottest monthly and seasonal records this past summer. This resulted in increased evapotranspiration helping exacerbating short term drought impacts, as well as aiding in the rapid succession into extreme and exceptional drought. The region has now entered into the drier early autumn season, so any drought improvement is unlikely in the near term. More expansive and heavier precipitation will be needed later this fall and early winter to begin to make a dent into the year-to-date deficits and help alleviate drought impacts. Much of the drought impacts have been focused in short term influences such as forage for ranchers, water availability for land based wildlife, and small stream flow for aquatic wildlife. Recent wetness during the winter seasons has resulted in adequate long term hydrologic stability.
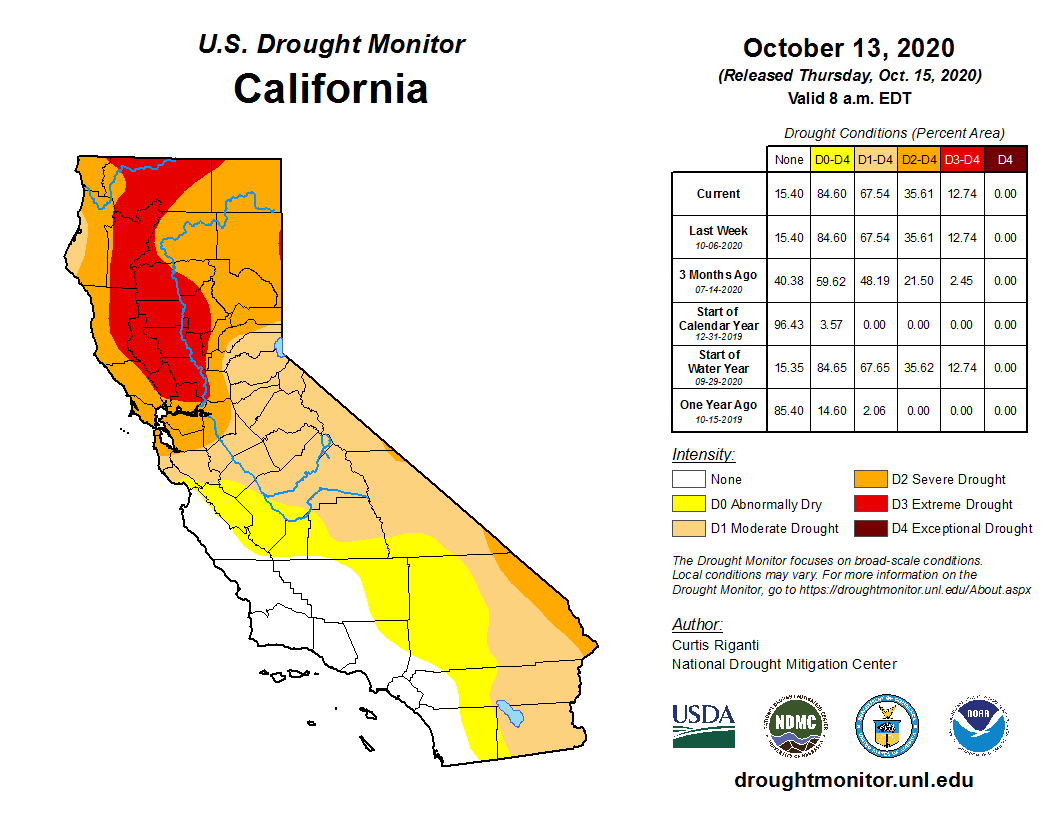
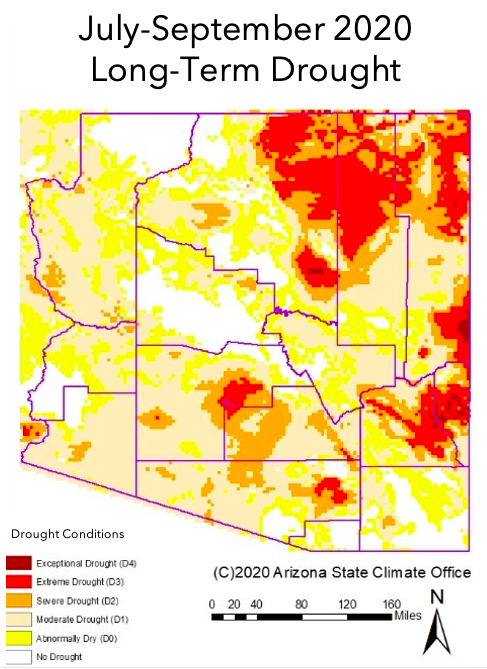
Local Area Affected: The National Drought Monitor depicts growth in Severe to Extreme drought in much of Arizona the past couple months, but only minor degradation in SE California. Moderate drought conditions exist in portions of Arizona where winter and spring precipitation was abundant and impacts thus far have been limited. Exceptional Drought (D4) - part of south-central Arizona In Arizona: eastern Maricopa and Pinal counties Extreme Drought (D3) - across much of central, southern, and eastern Arizona In Arizona: central Maricopa, western Pinal, and Gila counties Severe Drought (D2) - parts of southwest Arizona In Arizona: western Maricopa, eastern La Paz, and eastern Yuma counties Moderate Drought (D1) - parts of southwest Arizona and SE California In Arizona: western La Paz, and Yuma counties In SE California: Imperial and eastern Riverside counties
Local Climatology: Below are precipitation totals since the beginning of 2020 from selected locations across Arizona and southeast California:
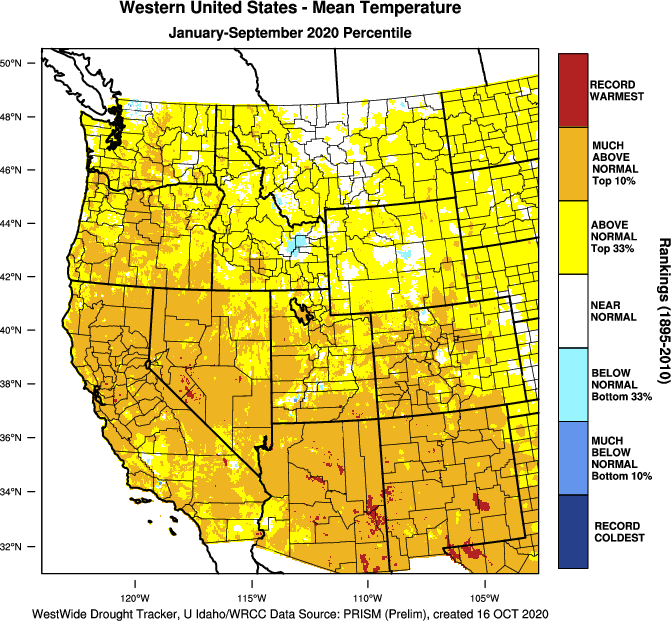
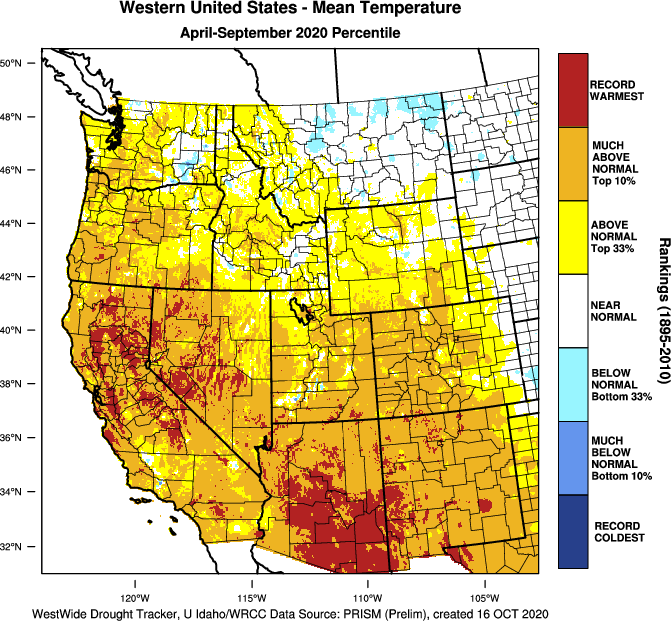
Aside from very limited rainfall amounts and coverage, drought conditions have grown more rapidly as a result of extreme temperatures. The majority of Arizona and the entire Southwest is experiencing an abnormally warm year, and the hottest summer months have set expansive records.
|
The U.S. Drought Monitor is a weekly collaborative effort between a number of federal agencies including NOAA/NWS, U.S. Department of Agriculture and the National Drought Mitigation Center. Details and explanations of the Drought Monitor can found at the web site: http://droughtmonitor.unl.edu/ The categories of drought are defined as follows: Moderate Drought (D1) - Some damage to crops, pastures; fire risk high; streams, reservoirs, or wells low, some water shortages developing or imminent, voluntary water use restrictions requested. Severe Drought (D2) - Crop or pasture losses likely; fire risk very high; water shortages common; water restrictions imposed. Extreme Drought (D3) - Major crop/pasture losses; extreme fire danger; widespread water shortages or restrictions. Exceptional Drought (D4) - Exceptional and widespread crop/pasture losses; exceptional fire risk; shortages of water in reservoirs, streams, and wells, creating water emergencies. |
|
State and Local Actions: A Drought Emergency Declaration remains in effect for the state of Arizona as signed by the governor in accordance with the Arizona Drought Preparedness Plan. The continuation of this Drought Emergency has been recommended by the Drought Interagency Coordinating Group in their bi-annual meeting on June 24, 2020. This recommendation is based on long term precipitation deficits, along with ongoing negative impacts across the state.
|
Additional information concerning the drought in Arizona can be obtained via the Arizona Department of Water Resources web site at: https://new.azwater.gov/drought Additional information concerning the drought in California can be obtained via the California Department of Water Resources web site at: |
|
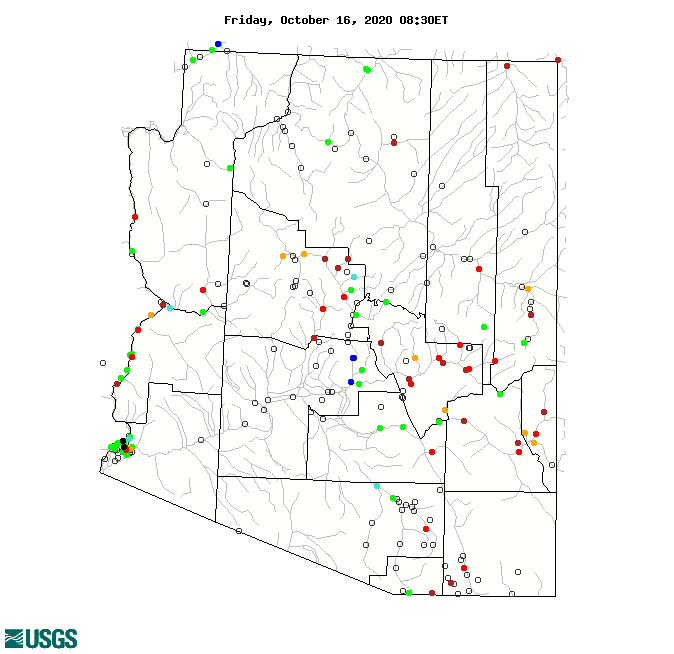
River, Stream Flow, and Reservoir Conditions: Smaller streams throughout Arizona have been suffering as a result of the lack of rainfall the past 6 months. Many of these small streams are flowing at or near record low levels for this time of year, especially in the eastern parts of the state. The more highly regulated larger rivers remain in a near normal flow rates due to ongoing management efforts.
Due to good precipitation over the last 2 winters, reservoirs are actually above levels seen in the past several years. Summer and early fall rainfall typically does little to influence reservoir storage, however the lack of rain over the past 6 months combined with record heat is likely creating extremely dry soils. As a result, future runoff could be negatively impacted even if average cool season precipitation were to materialize.
|
Hourly and forecast river stages out to 90 days can be found at the National Weather Service's (NWS) Advanced Hydrologic Prediction Service (AHPS) web page: http://water.weather.gov/ahps2/index.php?wfo=psr Additional Current stream and river stages may be viewed at the following USGS Web Site: |
|
Agriculture Impacts: With extreme heat and lack of monsoon rainfall, impacts have been substantial on area ranchers. These impacts have included need for increased water hauling, depleted stock ponds, distressed vegetation, and loss of forage acreage. As as result, livestock on regional ranches have suffered the greatest impacts. With little rainfall recently, range land and pasture conditions have shown steady deterioration. |
For additional information on agriculture impacts may be viewed at the United States Department of Agriculture (USDA) National Agricultural Statistics Service NASS Web Site: |
|
Fire Danger Hazards: The National Fire Danger Rating: High to Very High category for the entire area The current KDBI: Southwest Arizona and southeast California: Ranging from Extreme in SE California and much of Arizona to High in some of the higher elevations of far eastern Arizona
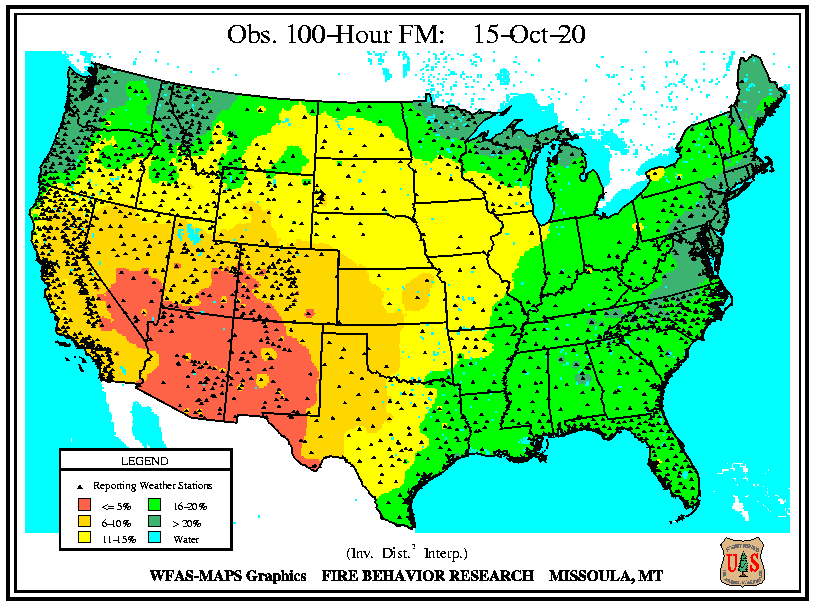
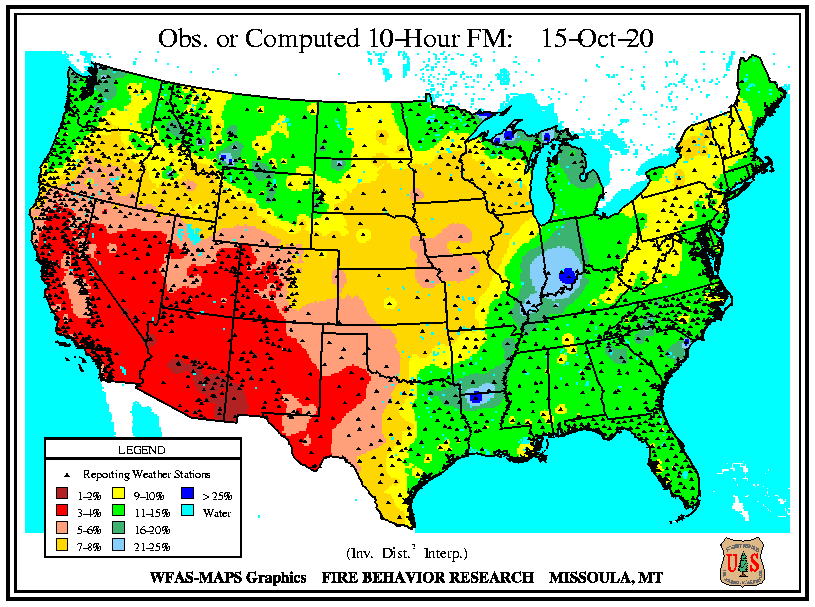
Ample precipitation at the beginning of the year spurred growth of fine 1 and 10-hour fuels along with some 100-hour fuels in lower elevations. Subsequently, very hot and dry weather has cured these fuels substantially. The larger 100-hour deal fuel moisture is under 5% for much of the state while finer 10-hour dead fuels were mostly under 4%. Typically during the fall after the monsoon season, these finer fuels would have been moistened by periodic rainfall. However with very little rainfall this year, these finer fuels are still ripe for burning and the Arizona wildfire season has extended well beyond what is typical. This extended wildfire season will now persist well into late fall before much cooler and humid winter weather arrives.
|
The Keetch-Byram Drought Index (KBDI) is a drought index that is specifically related to fire potential. The KDBI is broken into four categories which indicate the susceptibility of ground fuels to fire danger. Below are the four categories and a brief description of each.
KBDI and Dead Fuel Moisture data can be found on the Wildland Fire Assessment System (WFAS) web site at: |
||||||||||||
|
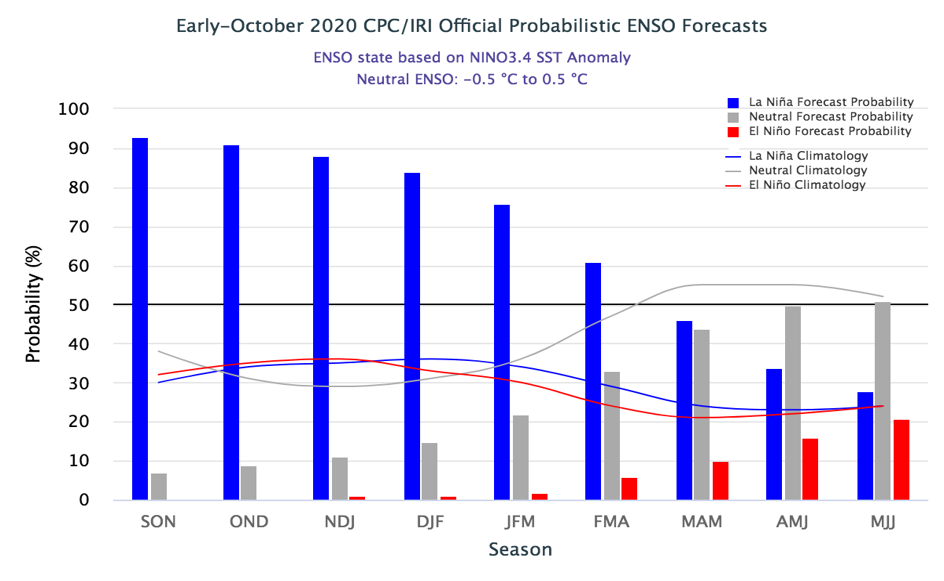
Precipitation/Temperature Outlooks: The 8-14 day temperature outlook for Oct 24-30 period calls for slightly better chances of above average temperatures and better odds for near average rainfall. The 90 day outlook for the period November 2020 through January 2021 indicates much better chances for above average temperatures and enhanced odds for below normal precipitation.
ENSO had been maintaining a neutral state during the monsoon, and really had no influence on the drier than normal weather. However, equatorial Pacific waters rapidly cooled resulting in a quick transitioning into a La Nina episode with the atmosphere consequently responding. This La Nina should peak during the middle of the winter, and should attain at least a moderate category. The winter season during La Nina is strongly weighted towards near to below normal precipitation across the Southwest. Thus, odds are definitely tilted towards drier weather persisting, and probably little if any improvement to drought conditions in the next several months.
|
For updated temperature and precipitation probabilities consult the following Climate Prediction Center (CPC) Web Sites: 8 to 14 Day Outlook: http://www.cpc.ncep.noaa.gov/ 30 Day Outlook: http://www.cpc.ncep.noaa.gov 90 Day Outlook: |
|
Questions or Comments: If you have any questions or comments about this information |
Other Contacts: For state climate impacts: http://www.stateclimate.org |
|
Acknowledgements: The Drought Monitor is a multi-agency effort involving NOAA’s National |
Related Websites : NWS - http://www.weather.gov/phoenix CPC - http://www.cpc.ncep.noaa.gov Drought Monitor - http://droughtmonitor.unl.edu/ |