Extreme and Exceptional Drought Persists Heading into the Summer Monsoon
|
 |
|
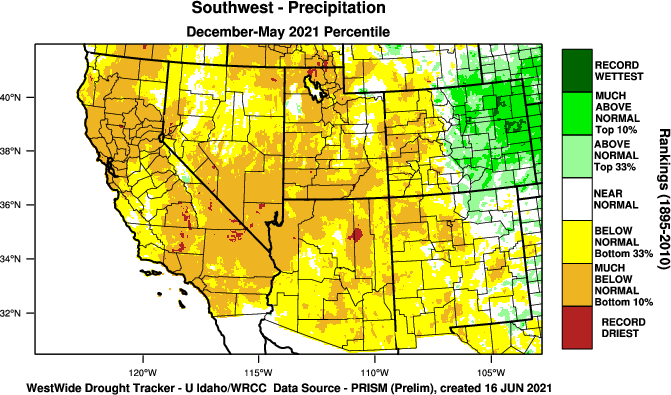
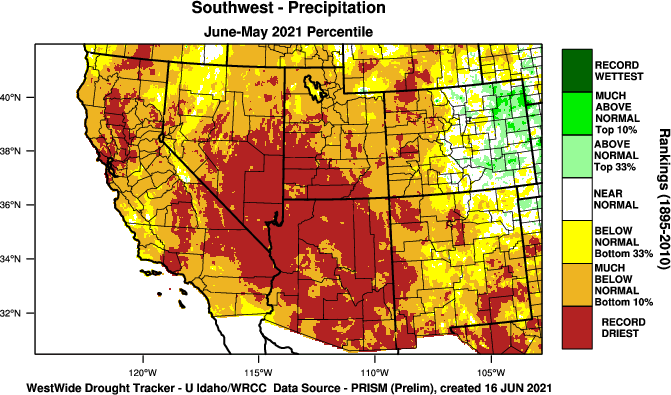
Summary: The 2020-21 Water Year remains much drier than normal for the entire region with most locations well into the driest top 10 years on record. Most of the area has received only sporadic, isolated light precipitation the past several months with little to none of the Much of the drought impacts have been focused in short term influences such as forage for ranchers, water availability for land based wildlife, and small stream flow for aquatic wildlife. Recent wetness during the past couple winter seasons has resulted in adequate long term hydrologic stability. However with reduced snow melt this year, reservoirs have experienced little recharge.
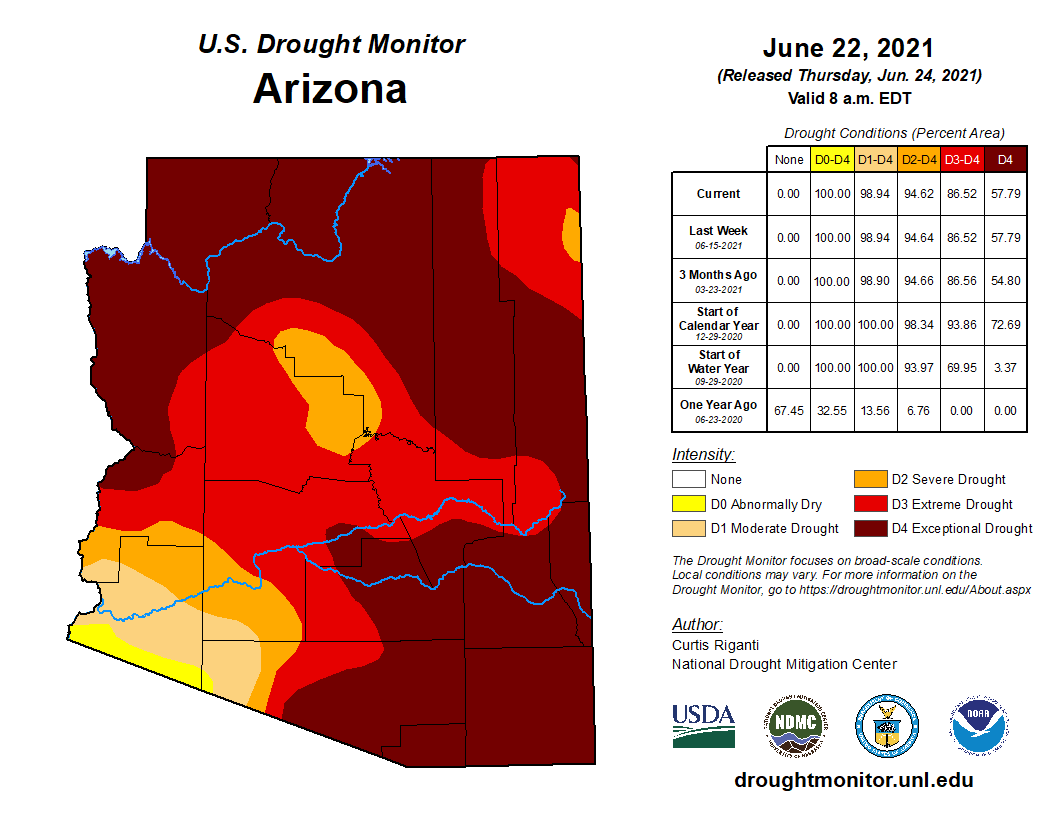
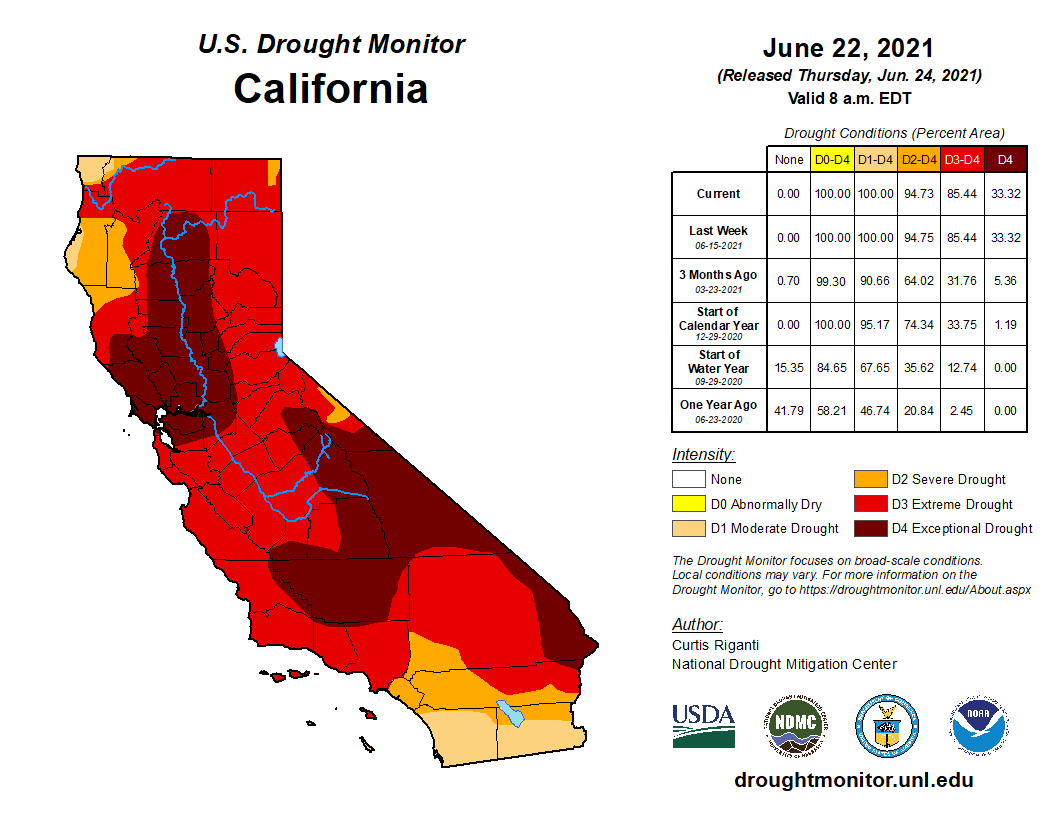
Local Area Affected: The National Drought Monitor depicts only minor deterioration of drought measures across Arizona and SE California. Exceptional Drought (D4) - parts of south-central and southwest Arizona In Arizona: far southeast Maricopa, southern Gila, eastern Pinal, and northern La Paz counties In SE California: far northeastern Riverside County Extreme Drought (D3) - across much of central, southern, and eastern Arizona and SE California In Arizona: much of Maricopa, western Pinal, and the majority of La Paz counties In SE California: most of eastern Riverside County Severe Drought (D2) - parts of southwest Arizona and SE California In Arizona: southern La Paz, northern Yuma and southwest Maricopa counties In SE California: small part of Riverside County and northern Imperial County Moderate Drought (D1) - southwest Arizona and SE California In Arizona: southern Yuma County In SE California: southern Imperial County Abnormally Dry (D0) - southwest Arizona In Arizona: far southern Yuma County
Local Climatology: Below are precipitation totals since the beginning of the 2020-21 Water Year from selected locations across Arizona and southeast California (please note Normals have been adjusted to reflect the new 1991-2020 official climate period):
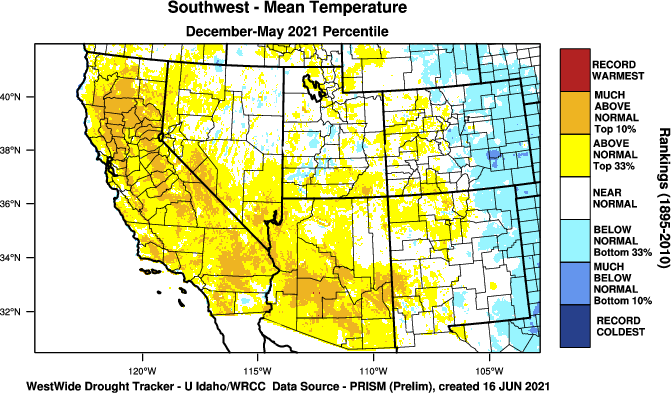
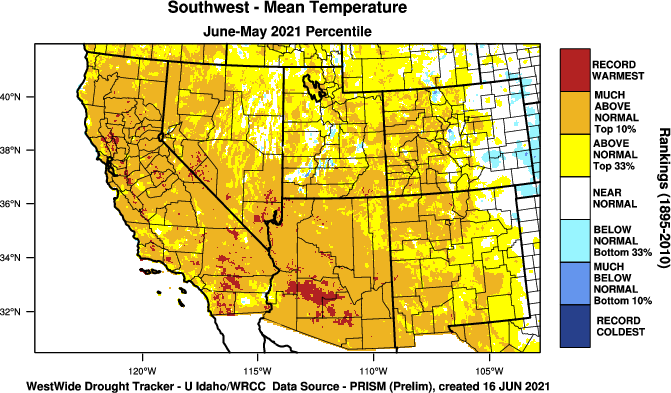
In addition to the precipitation deficit, drought conditions have worsened and expanded more rapidly as a result of extreme temperatures. Precipitation deficits over the past year are solidly at record low levels for the entire Southwest United States. Add in the near record heat over the past year, and it's fairly clear why Extreme and Exceptional Drought covers much of the Southwest.
|
The U.S. Drought Monitor is a weekly collaborative effort between a number of federal agencies including NOAA/NWS, U.S. Department of Agriculture and the National Drought Mitigation Center. Details and explanations of the Drought Monitor can found at the web site: http://droughtmonitor.unl.edu/ The categories of drought are defined as follows: Moderate Drought (D1) - Some damage to crops, pastures; fire risk high; streams, reservoirs, or wells low, some water shortages developing or imminent, voluntary water use restrictions requested. Severe Drought (D2) - Crop or pasture losses likely; fire risk very high; water shortages common; water restrictions imposed. Extreme Drought (D3) - Major crop/pasture losses; extreme fire danger; widespread water shortages or restrictions. Exceptional Drought (D4) - Exceptional and widespread crop/pasture losses; exceptional fire risk; shortages of water in reservoirs, streams, and wells, creating water emergencies. |
|
State and Local Actions: A Drought Emergency Declaration remains in effect for the state of Arizona as signed by the governor in accordance with the Arizona Drought Preparedness Plan. The continuation of this Drought Emergency has been recommended by the Drought Interagency Coordinating Group in their bi-annual meeting on May 11, 2021. This recommendation is based on long term precipitation deficits, along with ongoing negative impacts across the state. .
|
Additional information concerning the drought in Arizona can be obtained via the Arizona Department of Water Resources web site at: https://new.azwater.gov/drought Additional information concerning the drought in California can be obtained via the California Department of Water Resources web site at: |
|
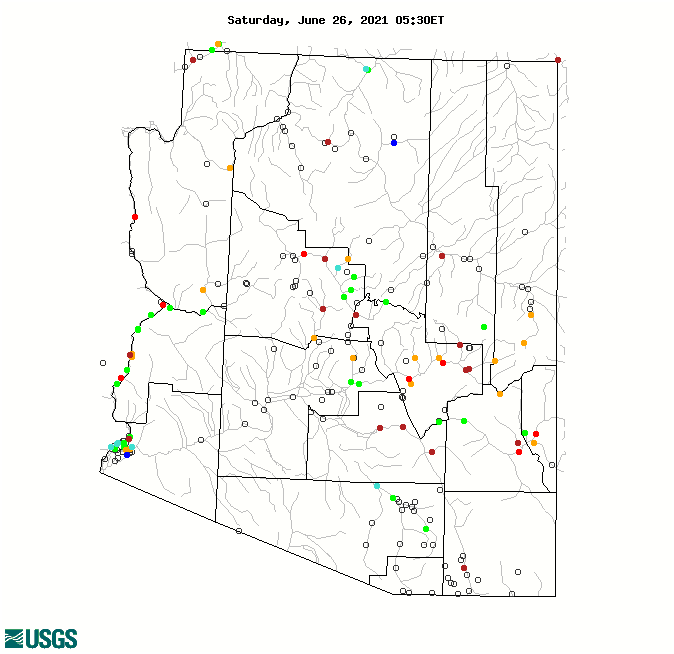
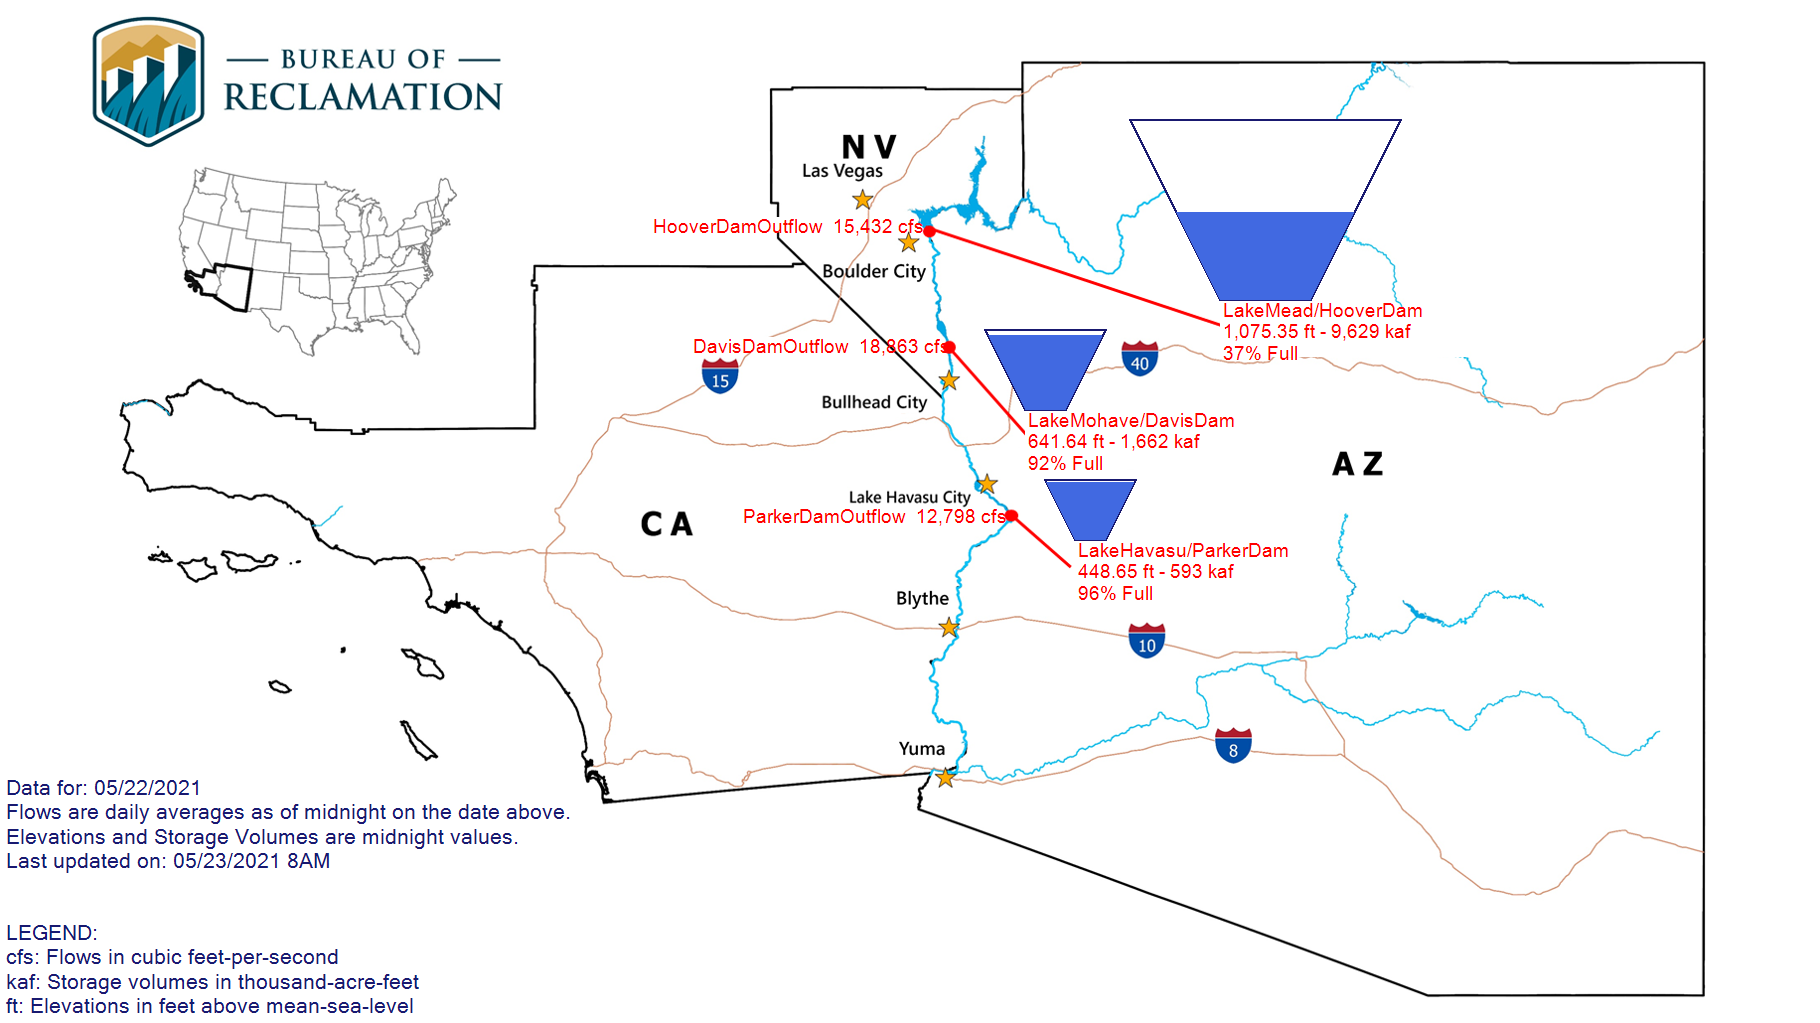
River, Stream Flow, and Reservoir Conditions: Flow on smaller streams throughout Arizona continues to worsen resulting from the lack of precipitation the past 12 months. Snow melt has ended after only limited response and runoff. Forecast runoff continues to be adjusted downward, and will fall near the lowest recorded in many parts of the state. The more highly regulated larger rivers remain in a near normal flow rates due to continual management efforts.
Record low inflows were recorded on the Salt/Verde basin early in the water year reflecting a symptom of a poor 2020 monsoon and lingering dry soil moisture. With soil moisture remaining abnormally dry, total system forecast runoff has been adjusted down to the
|
Hourly and forecast river stages out to 90 days can be found at the National Weather Service's (NWS) Advanced Hydrologic Prediction Service (AHPS) web page: http://water.weather.gov/ahps2/index.php?wfo=psr Additional Current stream and river stages may be viewed at the following USGS Web Site: |
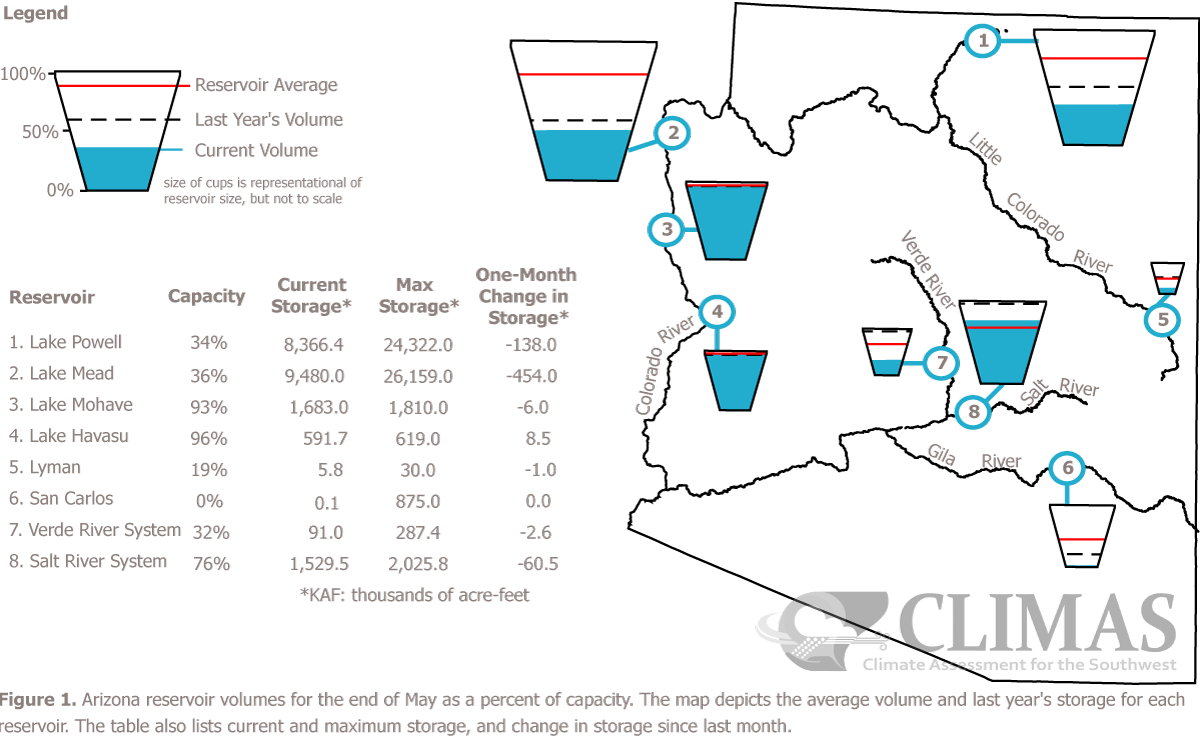
Despite adequate storage levels within the Salt-Verde basin, the greater Colorado
River basin has been hit by multiple years of drought and overextended usage. As
a result, Arizona Department of Water Resources (ADWR) and Central Arizona
Project (CAP) have issued a joint statement describing and expected Tier 1 shortage
level beginning in 2022.
|
Agriculture Impacts: 90% of the Arizona range and pasture land rated as poor to very poor compared to just 19% at this time last June, and the 5-year average of 34%. While a couple winter precipitation events aided topsoil
|
For additional information on agriculture impacts may be viewed at the United States Department of Agriculture (USDA) National Agricultural Statistics Service NASS Web Site: |
|
Fire Danger Hazards: The National Fire Danger Rating: High to Very High category across the region The current KDBI: Southwest Arizona and southeast California: Ranging from Extreme lower elevations of SE California and southern Arizona and High in some of the higher elevations of northern and eastern Arizona
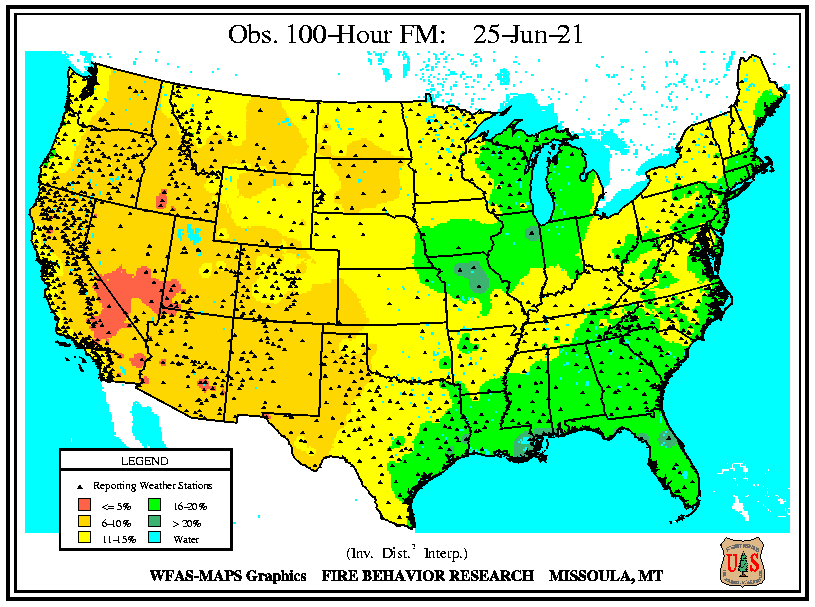
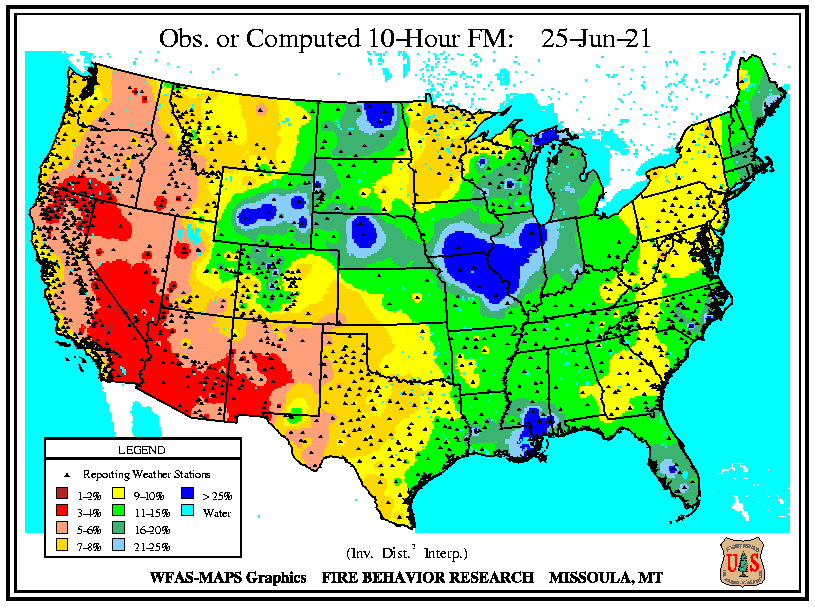
With the hot, dry spring weather well established, unusually dry fuels have returned as long term drought persists. Acreage burned by wildfires already this spring is outpacing last year with fuels ripe for burning. Fire restrictions have been put in place across much of Arizona for state owned lands with closures of national forests 100-hour dead fuel moisture has mostly stabilized in a 6-10% range while 10-hour dead fine fuels are ripe for burning in a 3-4% range.
|
The Keetch-Byram Drought Index (KBDI) is a drought index that is specifically related to fire potential. The KDBI is broken into four categories which indicate the susceptibility of ground fuels to fire danger. Below are the four categories and a brief description of each.
KBDI and Dead Fuel Moisture data can be found on the Wildland Fire Assessment System (WFAS) web site at: |
||||||||||||
|
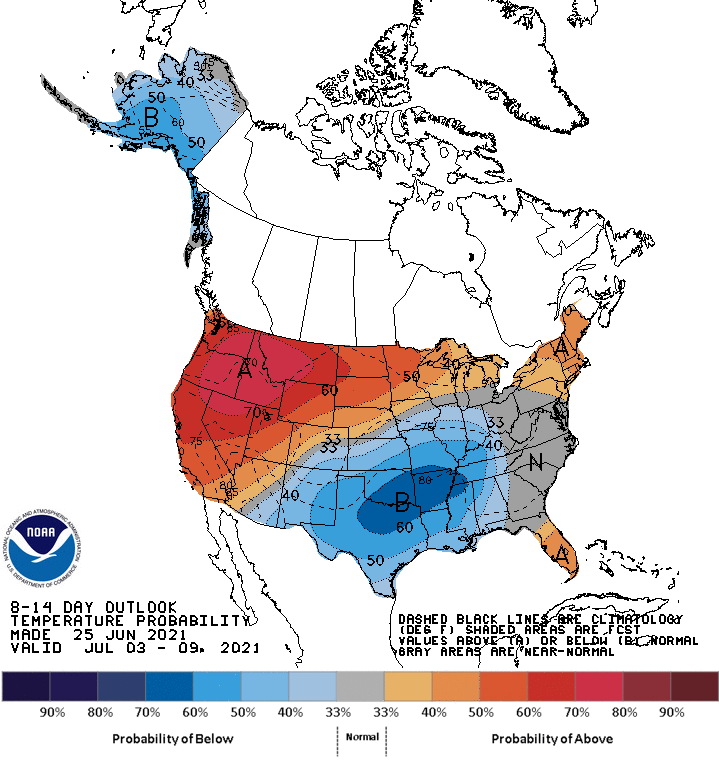
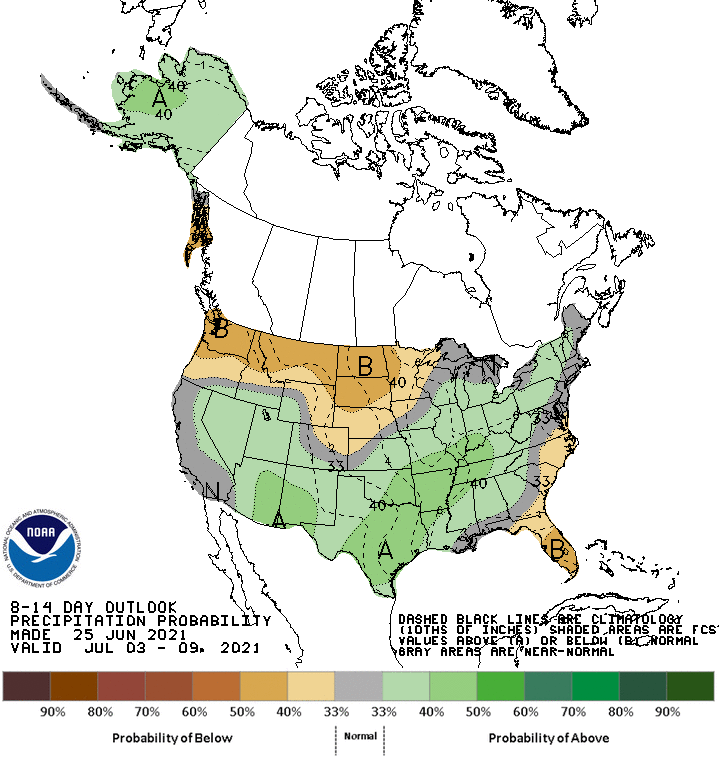
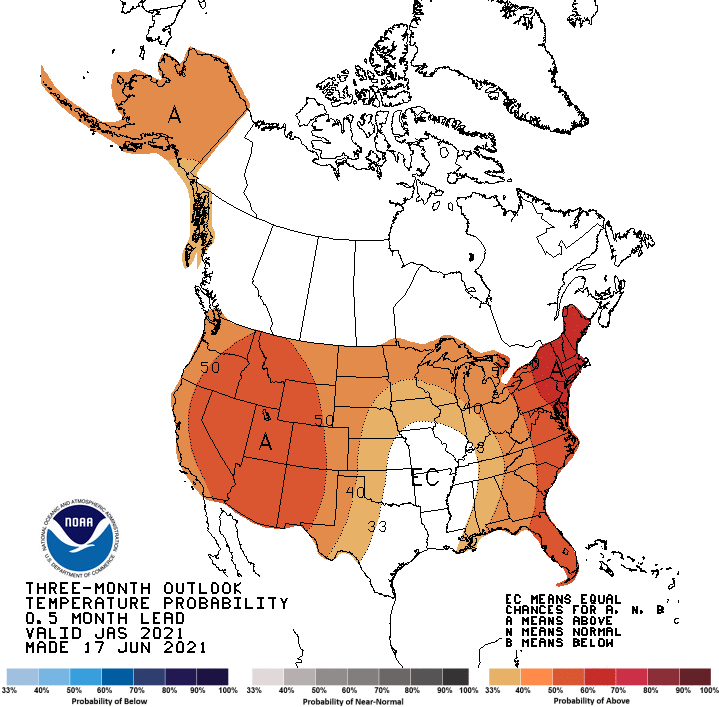
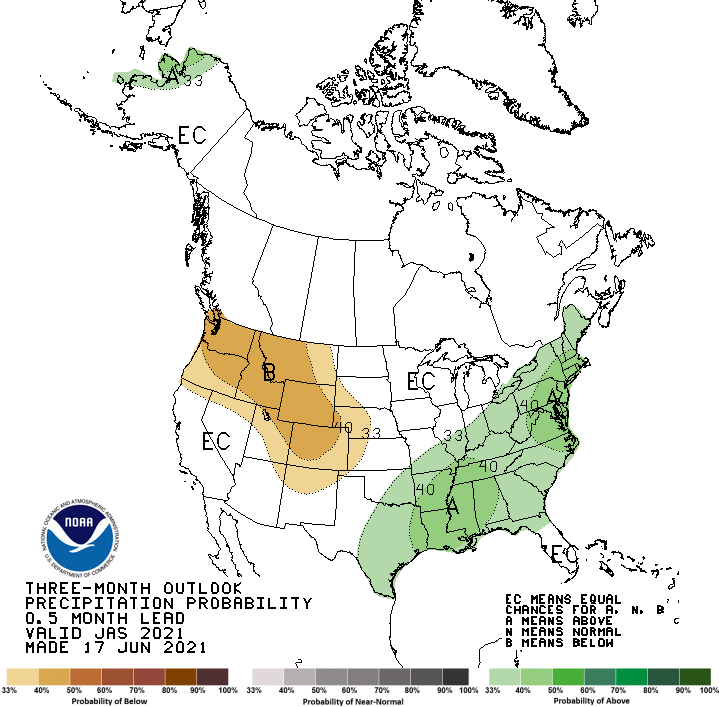
Precipitation/Temperature Outlooks: The 8-14 day temperature outlook for July 3-9 period calls for somewhat better chances of near average temperatures and slightly enhanced odds for above normal rainfall range. The 90 day outlook for the period July through September 2021 indicates better chances for above average temperatures and equal chances for above, near, or below normal precipitation.
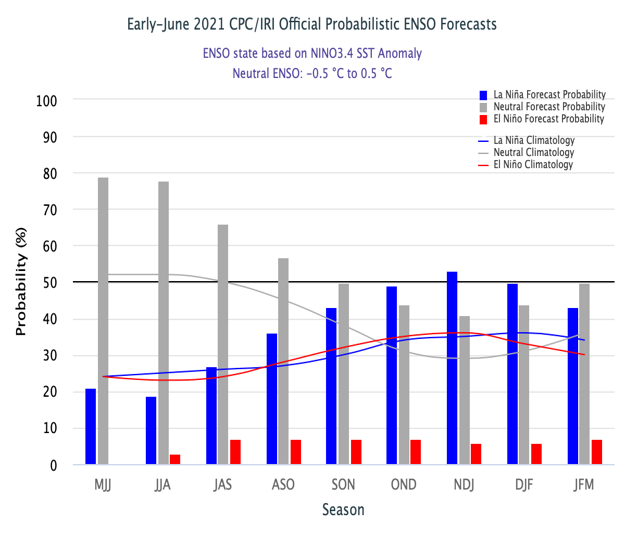
La Nina peaked in the tropical Pacific during the winter with sea surface temperatures now oscillating around average. The equatorial Pacific and atmospheric flow has settled into a neutral state, and will remain as such through the summer. ENSO status typically has minimal influence on monsoon rainfall. There is about a 50% chance of La Nina returning again in the fall/winter 2021-22 with little chance of a transition to El Nino.
|
For updated temperature and precipitation probabilities consult the following Climate Prediction Center (CPC) Web Sites: 8 to 14 Day Outlook: http://www.cpc.ncep.noaa.gov/ 30 Day Outlook: http://www.cpc.ncep.noaa.gov 90 Day Outlook: |
|
Questions or Comments: If you have any questions or comments about this information |
Other Contacts: For state climate impacts: http://www.stateclimate.org |
|
Acknowledgements: The Drought Monitor is a multi-agency effort involving NOAA’s National |
Related Websites : NWS - http://www.weather.gov/phoenix CPC - http://www.cpc.ncep.noaa.gov Drought Monitor - http://droughtmonitor.unl.edu/ |