Paul Iñiguez, Science & Operations Officer, NOAA/NWS Phoenix, AZ
Published Monday 4 Dec 2017 -- Last Updated Wednesday 6 Dec 2017
Update: The most recent stretch of days with above average temperatures ended at 29 when the high temperature on Dec. 5 of 66 °F was below average.
The year 2017 is on pace to be one of the warmest on record. Through November, it is tied with 2014 as the warmest year on record. Notably, Fall 2017 has seen the majority of days with above normal temperatures. As of December 5, the last below average day was November 5, making the current stretch of 29 consecutive days fairly remarkable. But how unusual is this? Through the analysis below, we show quite unusual; it ties for the 21st longest stretch going back to 1930.
| Rank | Days | Ending On |
| 1. | 46 | Mar. 27, 1972 |
| 2. | 44 | Nov. 7, 1952 |
| 3. | 39 | Nov. 10, 1950 |
| 4. | 36 | Oct. 27, 1992 |
| 5. | 33 | Sep. 2, 1973 |
| 33 | Oct. 21, 1979 | |
| 33 | Nov. 21, 1999 | |
| 33 | Jul. 15, 2002 | |
| 9. | 32 | Jul. 8, 1936 |
| 32 | Jun. 4, 1984 | |
| T21. | 29 | Thru Dec. 4, 2017 |
Table 1. List of Top 10 longest stretches of above average temperatures for Phoenix, AZ.
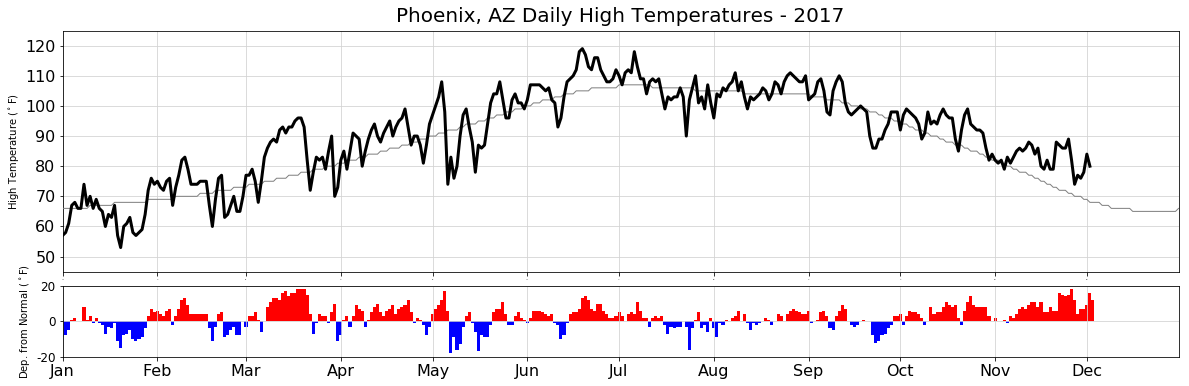
Fig. 1. Daily high temperatures in Phoenix, AZ for 2017 (through Dec. 3).
To do any further analysis, we must differentiate between average and Normal. Both are measures of a location's climate, derived from its weather observations. NOAA NCEI uses a moving 30-year window of daily weather observations to determine daily climate Normals. This process allows for gradual adjustments as the climate at a location changes (which is expected as climate is not stationary). More can be read about Normals here. The current Normals in use are derived from the years 1981-2010. While that is good for comparing current data, we can't compare weather data from earlier in the 20th century to today's climate due to changes in the climate. Temperatures in Phoenix have steadily increased during the past 100+ years.
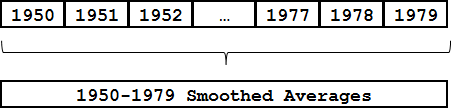
Fig. 2. Illustration of how 30-years of data are combined into moving averages.
We can basically recreate smoothed averages though, very similar to how Normals are created. We do this using a moving 30-year window. Daily weather data for Phoenix is available for full years starting in 1896. Given we want full 30-year windows, we start the creation of averages with the 1900-1929 range. From there, we start the comparative analysis in 1930. This allows us to compare daily weather data relative to its more recent climate. Thus the individual days from 1930 through 1939 are compared to averages based on the 1900-1929 data, then 1940 through 1949 compared to 1910-1939, and so on.
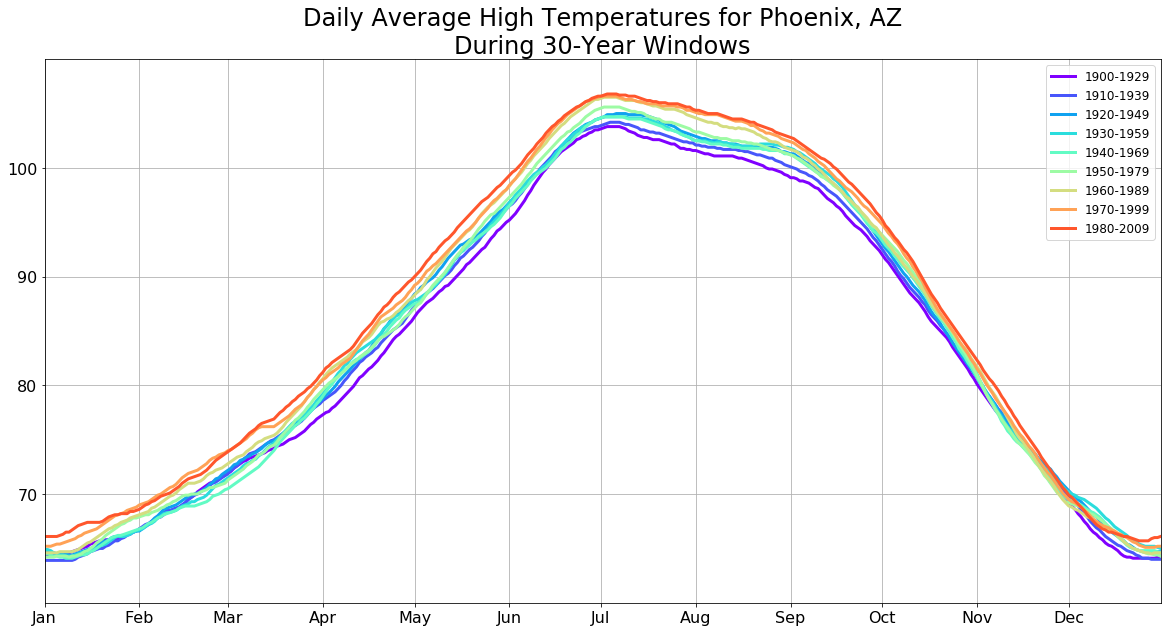
Fig. 3. Successive 30-year windows of average daily high temperature. Note later years are warmer, indicating an upward trend.
With this information, we can now identify the longest stretches of above average high temperatures. The longest stretch on record was 46 days ending on Mar. 27, 1972. The current stretch, as of Dec. 4, 2017 (inclusive) is 29 days, which ties as the 21st longest. With more warm days ahead, this stretch will likely continue.
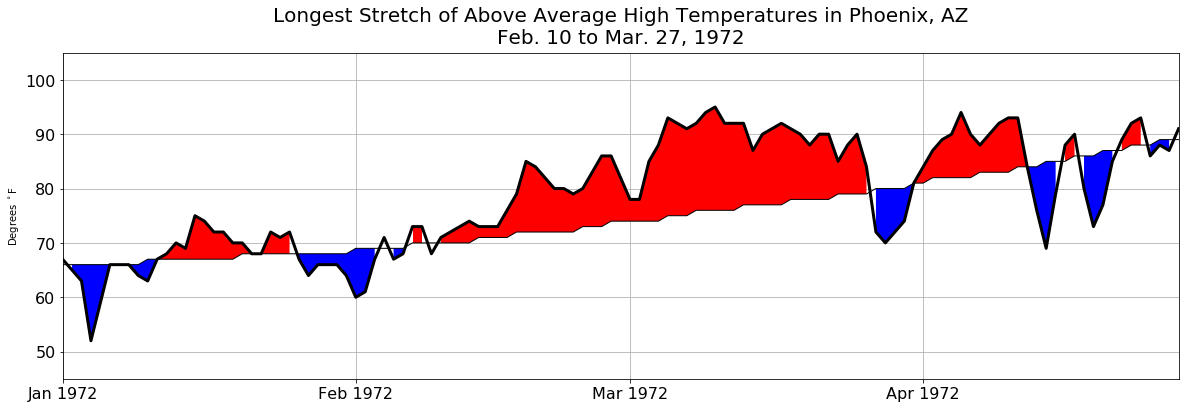
Fig. 4. Longest stretch of above average temperatures in Phoenix occurred in Feb-Mar 1972, lasting 46 days.

