July 24, 2024 Phoenix Microburst Event
On the evening of July 24th, several thunderstorms developed across the Phoenix Metro area. These thunderstorms resulted in several microbursts, defined as downward acceleration of strong winds emanating from the parent thunderstorm (Figure 1). The stronger microbursts, the ones that produced the most widespread damage, came from an isolated thunderstorm that developed over north-central Phoenix. This storm quickly became severe as it tracked south just west of the Interstate 17 corridor, producing a series of strong microbursts (Figure 2). The first report of wind damage was received around 8:40 PM MST at the intersection of 35th Ave and West Peoria Ave where palm trees toppled over onto power lines. After the storm crossed south of Interstate 10, the Phoenix terminal doppler radar, TPHX, base velocity product indicated an enhanced divergent signature with strong inbound/outbound wind speeds exceeding 70 mph (Figure 3).
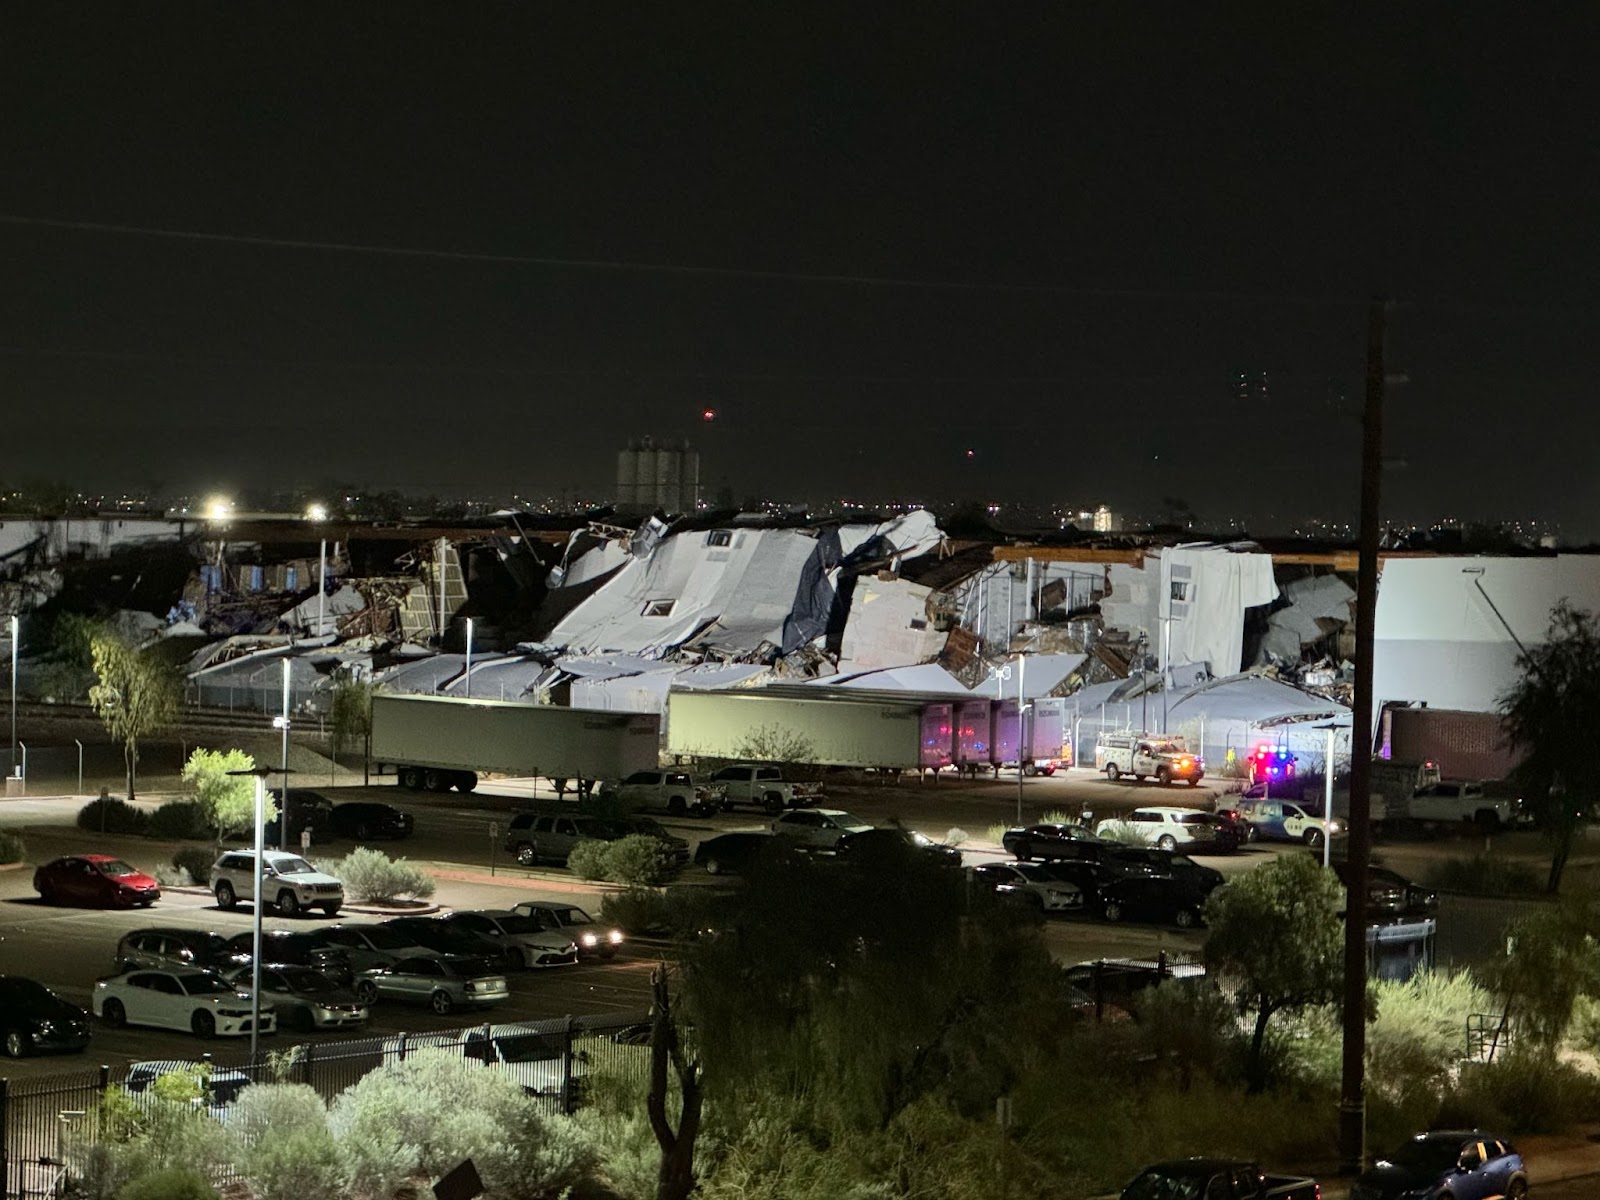
At around 9:00 PM MST, an intense microburst caused a total collapse of a warehouse facility near the intersection of 47th Ave and Van Buren St (Figure 4). All photos taken by local media showed total destruction of the warehouse building with much of the roof completely missing and walls caved inwards (Figures 5-7). Unfortunately, a man was found deceased in the rubble several days later on July 27th after a lengthy search and rescue attempt was made. Additional damage was noted to nearby commercial buildings which included solar panels lifted off a roof, several semi trucks flipped on their sides, and large trees uprooted (Figures 8-9). The only ground truth recorded wind speed measurement in the path of this storm was 59 mph from a nearby SRP mesonet station. However, localized wind speeds up to 70-80 mph were estimated by radar during the time of the most significant damage.
Figure 1: TPHX doppler radar base velocity imagery from 07:32 PM MST to 10:01 PM MST July 24, 2024, showing the numerous microbursts that developed from the thunderstorm activity across the Phoenix area. In this 1.5 hour loop there were over 20 individual microbursts. Green colors indicate inbound velocity and red colors indicate outbound velocity. The purple haze is indicative of range-folding which is caused by blockage of the radar beam from nearby terrain features.
Figure 2: Radar reflectivity imagery from 8:04 PM MST to 9:13 PM MST July 24, 2024 showing the severe thunderstorm that caused the most widespread damage as it was moving southward just west of I-17, with the yellow polygons denoting the severe thunderstorm warnings issued.
Figure 3: TPHX doppler radar base velocity imagery from 8:40 PM MST to 9:30 PM MST July 24, 2024. Green colors indicate inbound velocity and red colors indicate outbound velocity. The black dot indicates location of the TPHX radar and the yellow dot indicates the approximate location of the collapsed warehouse.
Figure 4: Night time photo captured by Chris Peloquin (X:@Crispy_Pelican) showing a strong microburst occurring over south-central Phoenix on the evening of July 24th.
Figure 5: Collapsed wall exposing inside of warehouse near 47th Ave and Van Buren St. Photo from Cindy Kobold.
Figure 6: Complete collapse of warehouse roof near 47th Ave and Van Buren St. Photo by Cindy Kobold.
Figure 7: Aerial view of collapsed warehouse roof near 47th Ave and Van Buren St. Photo by Arizona’s Family News (3TV and CBS 5 Phoenix).
Figure 8: Semi-truck flipped on its side near Werner Enterprises located at 49th Ave and Lower Buckeye Rd. Photo by David Grostick.
Figure 9: Large uprooted tree bringing down a brick fence in the area of 43rd Ave and Union Hills Dr. Photo by Rachel Maw.
Setup: The overall environment was characterized by moderate to high instability with mixed-layer convective available potential energy (MLCAPE) ranging between 1000-1500 J/kg across south-central AZ (Figure 10). In addition, the downdraft convective available potential energy (DCAPE), a measurement used to assess the potential strength of rain cooled downdraft air, was high, in excess of 1500 J/kg (Figure 11). Thus, any thunderstorm that developed within this environment had the potential to produce strong to severe wind gusts. Given the favorable environmental setup with the elevated potential for severe wind gusts, the Storm Prediction Center in Norman, OK, coordinated with the NWS Phoenix, Tucson and Flagstaff offices to issue a Severe Thunderstorm Watch for most of central and southern AZ by the early afternoon hours (Figure 12).
Figure 10: Mixed Layer Convective Available Potential Energy (MLCAPE) and Mixed Layer Convective Inhibition (MLCIN) at 8 PM MST July 24, 2024
Figure 11: Downdraft Convective Available Potential Energy (DCAPE) and Downdraft Convective Inhibition (DCIN) at 8 PM MST July 24, 2024
Figure 12: Severe Thunderstorm Watch issued by the Storm Prediction Center, covering most of central and southern AZ.