The data feed to the ASOS data is currently unavailable and we are working to resolve the issue. We apologize for the inconvenience.
This page is out of service while upgrades are made to the system. We apologize for the inconvenience.
A few of the values on this page are being miscalculated, occasionally resulting in erroneous high/low temperatures and total precipitation. We anticipate this will be resolved soon. Please consult the daily Climate Report for the official values for Phoenix Sky Harbor Airport.
Phoenix Sky Harbor Airport, AZ Hi-Res ASOS Data
This experimental page displays preliminary/unofficial high-resolution KPHX ASOS data, updated every 5-10 minutes.
It is not guaranteed to be available at all times. See details below. Last update:
°F at
Unofficial High Temperature
°F at
Unofficial Low Temperature
" Unofficial Total Precipitation
+ Data Table
Local
Time
Temp (°F)
DewPt (°F)
Precip (in)
+ Observation Details
Official observations for Phoenix, AZ are measured at the Automated Surface Observing Station (ASOS) located at Phoenix Sky Harbor International Airport. (Station history details are available in the section below.) The ASOS is a joint effort between the NWS, the FAA, and the DOD. The ASOS serves as the nation's primary surface weather observing network. It is designed to support weather forecast activities and aviation operations and, at the same time, support the needs of the meteorological, hydrological, and climatological research communities. There are currently more than 900 ASOS across the United States and its territories.
Each station includes sensors to measure wind speed and direction, dew point, air temperature, present weather, precipitation type and amount, visibility, cloud height, and station pressure. Internally, the ASOS is observing these parameters multiple times per minute. For air temperature, it is observed every 10 seconds in tenths of a degree Fahrenheit then averaged and stored internally as whole degrees Fahrenheit every minute. To reduce noise and simulate the typical response of a mercury thermometer, the one minute observations are aggregated into rolling 5-minute averages (stored each minute) which are then included in reports. Standard reports are coded METARs transmitted once per hour (or when significant changes occur). The international standard for METARs is to include temperature (and dew point) in both whole degrees Centigrade and as tenths of a degree Centigrade in the “T” group (see Table 1).
At the request of the FAA in 2016, METARs have been transmitted every five minutes. The primary purpose of these observations are increased frequency of ceiling and visibility data to support airport operations (not climate data). These observations are stored only with temperature in whole degrees Centigrade (converted from the rolling 5-minute average in whole degrees Fahrenheit).
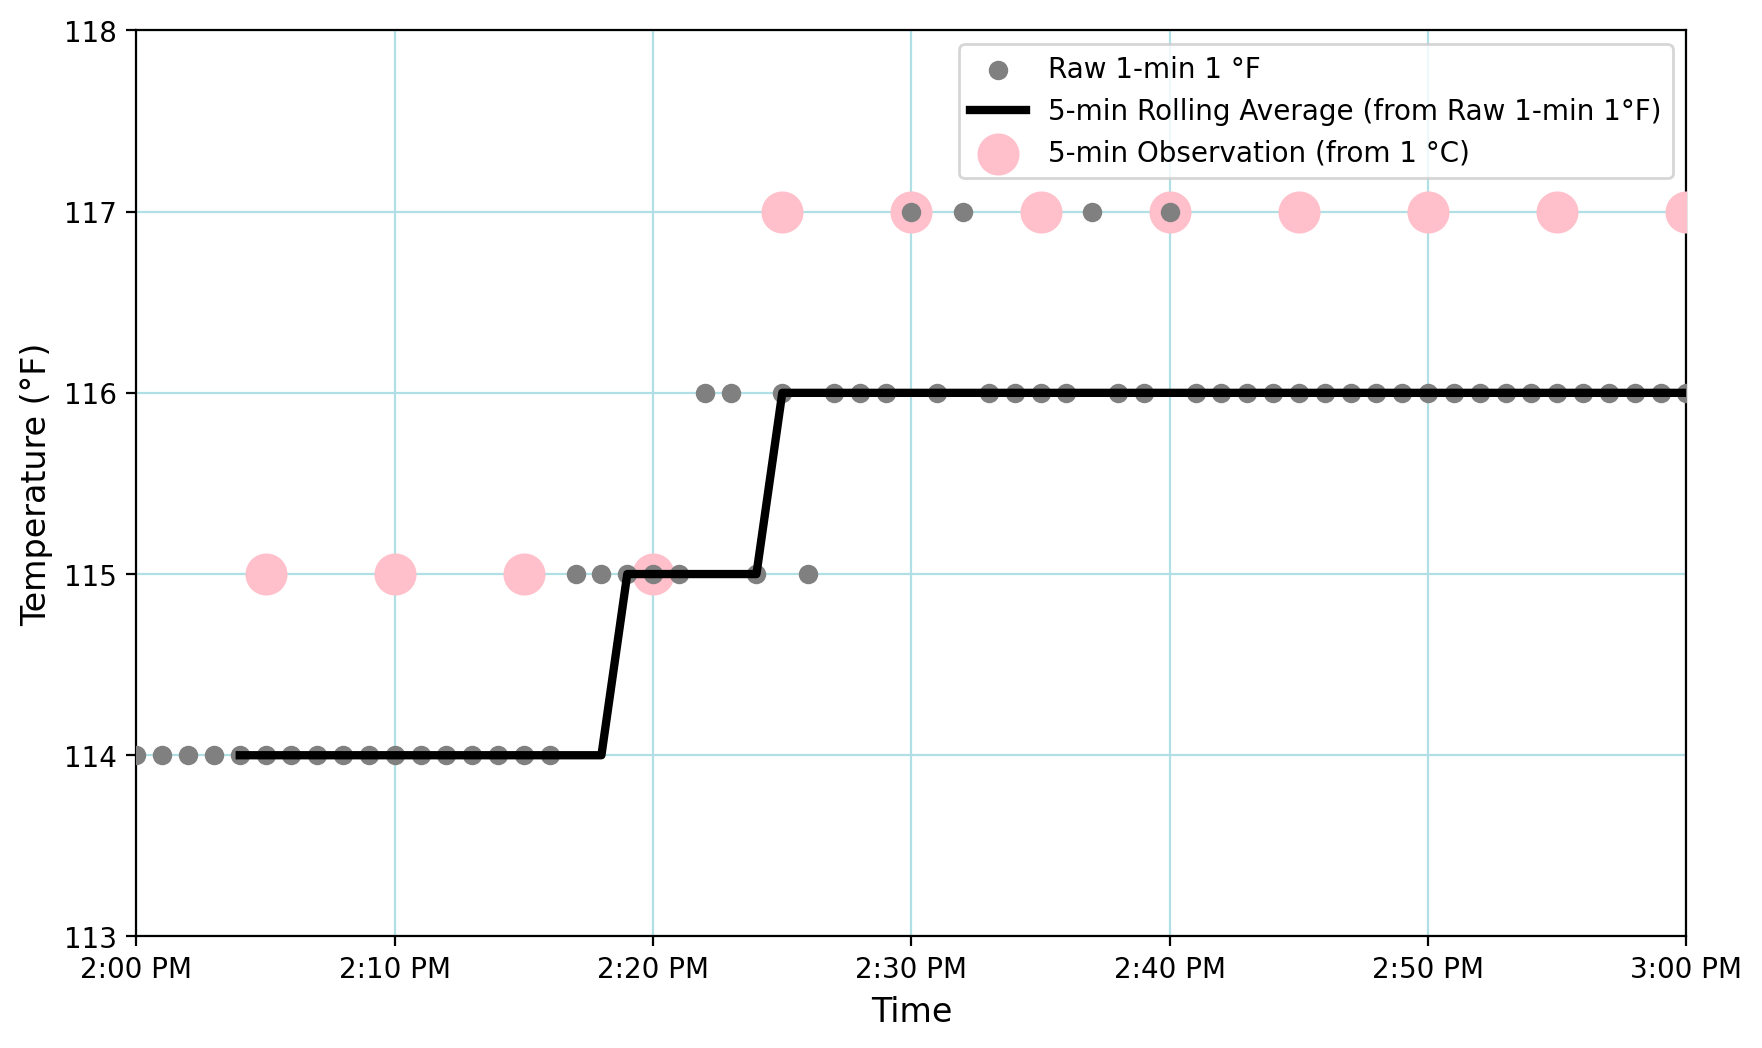
To illustrate this point, consider the hypothetical example above. During this one hour of weather the ASOS measured a peak 1-minute temperature of 117 °F (gray dots). This occurred four times over a period of ten minutes, with no successive observations. The rolling 5-minute average peaked at 116 °F (black line), which equates to 46.7 °C and rounds to 47 °C. Thus, several of the less precise 5-minute observations (pink dots) reported the temperature of 47 °C which converts to 117 °F. For climate purposes, these are not valid temperatures as they are erroneously high due to conversion and rounding processes. The high temperature in this example would be 116 °F.
The data displayed on this page are the rolling 5-minute average values. The daily high/low temperatures are the highest/lowest of the rolling 5-minute averages reported between 0000 LST and 2359 LST, with the time attributed to the last occurrence. Precipitation data are accumulated at 1-minute intervals.
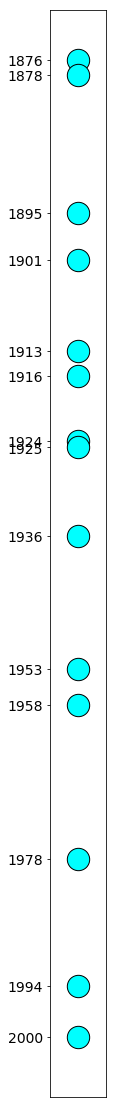
JAN 1876 Weather observations start in Phoenix, conducted by the US Army Signal Corps. Instrumentation was located at Center Avenue and Washington Street. The first observation was made on January 28. Unfortunately, records during this period did not survive to present day.
JAN 1878 Observation equipment was moved slightly, to between Washington Street and Jefferson Street on Central Avenue on January 19, 1878.
AUG 1895 The US Department of Agriculture Weather Bureau, the predecessor to today’s National Weather Service, assumes responsibility for recording weather observations on August 6, 1895. The observation locations was moved to the Wharton Block roof on Central Avenue and Washington Street. Daily records from this period forward are available to this day.
AUG 1901 Observing equipment is relocated to the Talbot Building at the southwest corner of 1st Avenue and Adams Street.
MAR 1913 Observing equipment was relocated to the roof of the Federal Building at the southwest corner of 1st Avenue and Van Buren Street on March 24, 1913.
JUN 1916 Observing equipment was relocated to the lawn of the Water Users’ Building southwest of 2nd Avenue and Van Buren Street.
SEP 1924 Observing equipment was relocated to the Ellis Building courtyard at 2nd Avenue and Monroe Street on September 24, 1924.
JUL 1925 Observing equipment was relocated back to the lawn of the Water Users’ Building southwest of 2nd Avenue and Van Buren Street on July 18, 1925.
OCT 1936 Observing equipment was relocated to the Post Office Building at Central Avenue and Fillmore Street on October 22, 1936.
OCT 1953 Official observations are transferred to weather observing equipment located at Phoenix Sky Harbor Airport, near Terminal 1, on October 1, 1953.
MAY 1958 Observing equipment was relocated to the FAA Operations Building near Phoenix Sky Harbor Airport on May 29, 1958.
JAN 1978 Observing equipment was relocated to the National Weather Service office, located toward the northwest corner of Phoenix Sky Harbor Airport grounds, on January 25, 1978.
MAR 1994 The Automated Surface Observing Station (ASOS) was commissioned on March 1, 1994. The equipment is installed toward the northeast corner of Phoenix Sky Harbor Airport grounds.
OCT 2000 The ASOS equipment is relocated toward the south-central grounds of Phoenix Sky Harbor Airport.