Did It Rain At Imperial, CA On July 24, 2018?
Published: August 6, 2018 (Updated 130 PM August 7, 2018 to correct KIPL official high of 121 °F)
Contact: Paul Iñiguez, Science & Operations Officer, NOAA/NWS Phoenix, AZ
Overview
The NOAA/NWS Phoenix, AZ Weather Forecast Office (PSR) received several media inquiries regarding the reported rainfall by the KIPL ASOS at Imperial, CA on July 24, 2018. (Note: The Imperial Valley is located within PSR's area of forecast responsibility.) While no measurable rain was recorded, defined as 0.01" or more, a trace of rain was entered into the climate record. While that by itself is not notable, the fact that it occurred with temperatures in the range of 115-119 °F is. Based on thorough analysis of the data and an in-person inspection of the ASOS, our team at PSR concluded that no rain fell that day. The likely culprit of the ASOS reporting rain was a dusty sensor. With these findings, the KIPL climate record was updated to reflect zero rainfall on July 24, 2018.
ASOS Observations
| Observations at Imperial, Imperial County Airport, CA (KIPL) ASOS on July 24, 2018 | |||||||||
|---|---|---|---|---|---|---|---|---|---|
| Date/Time | Temperature (°F) |
Dew Point (°F) |
Relative Humidity (%) |
Wind Direction |
Wind Speed (mph) |
Visibility (miles) |
Weather | Clouds | Rain |
| 24 Jul 9:53 pm | 103 | 52 | 18 | WSW | 10 | 10.00 | SCT110 | ||
| 24 Jul 8:53 pm | 106 | 56 | 19 | S | 9 | 10.00 | BKN110 | ||
| 24 Jul 7:53 pm | 111 | 54 | 15 | S | 11 | 10.00 | BKN110 | T | |
| 24 Jul 6:53 pm | 112 | 55 | 15 | SSE | 13 | 10.00 | Lt Rain | BKN110 | T |
| 24 Jul 5:53 pm | 115 | 52 | 13 | SE | 15 | 10.00 | Lt Rain | BKN110 | T |
| 24 Jul 4:53 pm | 119 | 54 | 12 | SE | 18 | 10.00 | Lt Rain | SCT090,OVC110 | T |
| 24 Jul 3:53 pm | 119 | 58 | 14 | SE | 22G28 | 10.00 | Lt Rain | BKN100,OVC120 | T |
| 24 Jul 2:53 pm | 120 | 53 | 11 | ESE | 10G20 | 10.00 | BKN100,OVC110 | ||
| 24 Jul 1:53 pm | 118 | 53 | 12 | SE | 10G16 | 10.00 | FEW075,OVC100 | ||
| 24 Jul 12:53 pm | 115 | 52 | 13 | 10.00 | SCT100 | ||||
| 24 Jul 11:53 am | 113 | 52 | 13 | 3 | 10.00 | SCT100 | |||
| 24 Jul 10:53 am | 112 | 52 | 14 | ESE | 6 | 10.00 | FEW110 | ||
| 24 Jul 9:53 am | 108 | 52 | 15 | 5 | 10.00 | CLR | |||
| 24 Jul 8:53 am | 101 | 54 | 21 | SW | 3 | 6.00 | Haze | CLR | |
| 24 Jul 7:53 am | 96 | 54 | 25 | S | 5 | 10.00 | CLR | ||
The KIPL ASOS reported -RA for approximately four hours, from 3 PM to 7 PM on July 24, 2018. The rain was reported as nearly continuous based on the 5-min observation (available here). While no measurable rain (0.01" or more) was measured by the ASOS tipping bucket, the detection of precipitation resulted in a measurement of "Trace" entered into the official climate record. (Note: based on this analysis, the climate record will be updated to zero.)
Like all Automate Surface Observing Stations (ASOS), the KIPL ASOS uses a Precipitation Identification sensor to detect falling hydrometeors. From the ASOS User's Guide...
The Precipitation Identification sensor (PI), better known as a Light Emitting Diode Weather Identifier (LEDWI), differentiates rain from snow and determines the intensity of the precipitation. The LEDWI contains a coherent light transmitter (i.e., there is a continuous relationship among the various phases of the light waves within the beam) and a photo diode receiver. The transmitter and receiver are mounted on a crossarm 10 feet above the ground or base of the platform. They are equipped with heated lens hoods, face directly at each other, are separated by a distance of 2 feet and are oriented in a north-south direction with the receiver looking north. (See Figure 16 for a view of the LEDWI.)
The transmitter generates a coherent Infrared (IRED) light beam, 50 millimeters in diameter, aimed directly at the receiver. The receiver lens is masked with a narrow 1 millimeter horizontal slit aperture through which the transmitter light beam passes before it is focused by the lens and impinges on the photo diode. The narrow aperture makes the receiver more sensitive to beam fluctuations caused by particles down to the size of a small raindrop (0.04 inch diameter).
Because the slit is much wider than its height, the receiver is more sensitive to beam fluctuations induced by the vertical velocity component of particles passing through the beam than the horizontal component. Built-in sensor algorithms minimize the possibility of any false identification caused by greater sensitivity.
As a particle of rain or snow passes through the coherent light beam, the particle creates a shadow that modulates the light, which then passes through the receiver’s horizontal slit aperture as a partially coherent (intermittently disrupted), colliminated (parallel to the slit) beam. The shadow varies depending on the size and speed of descent of the particle as it falls across the receiver.
When many particles fall through the beam, a scintillation pattern is created. The fluctuating beam pattern is sensed by a photo diode and amplified, creating a jumble of frequencies containing information on the size and speed of the falling particles. A spectral analysis reveals how much energy or power is contained in the various frequency bands. For example, a predominance of power in low frequencies from 75 to 250 Hz indicates snow. When energy is predominantly in a band from 1000 to 4000 Hz, the precipitant is almost certainly rain. The LEDWI registers rain and snow mixed as a “smearing” of the spectral power, which is usually reported by ASOS as unknown precipitation (UP). This analysis is the basis of the discrimination algorithm, which differentiates rain from snow.
Based on the 1-minute KIPL observations (available here), the ASOS's PI began detecting what it perceived to be snow at 7 AM on July 23, 2018 and continued off-and-on through 3 AM on July 26, 2018. In total, there were 858 1-min observations with snow detected. The temperature during these observations ranged from 90 to 122 °F (note: the official high temperature on this day based on the standard rolling 5-min average of the 1-min data was 121 °F). The ASOS PI algorithm does include a check to essentially nullify snow/precipitation observations when the temperature is above 38 °F. For an unknown reason, this did not occur and the sensor passed the detection along as rain. Further analysis is on-going to determine why this was the case.
Technician Site Visits
Per national requirement, PSR technicians conduct quarterly site visits to all ASOS locations within their area of responsibility. During a site visit, preventative maintenance is done, which includes cleaning and calibrating all instruments. The KIPL ASOS was visited in mid April and again on August 2nd. Based on KIPL data prior to July 24, 2018, there were several instances of strong winds and reduced visibility, indicative of blowing dust in the air. It is likely that environmental conditions between regularly scheduled preventative maintanence results in dust accumulating on the precipitation indicator.
Other Weather Stations
Numerous other stations are situated across Imperial County, CA. These include the El Centro Naval Airbase (KNJK) just ten miles west of KIPL and several RAWS stations. Total precipitation for the calendar day of July 24, 2018 indicate none of these stations reported measurable rainfall. A review of KNJK observations indicate no rain was reported.
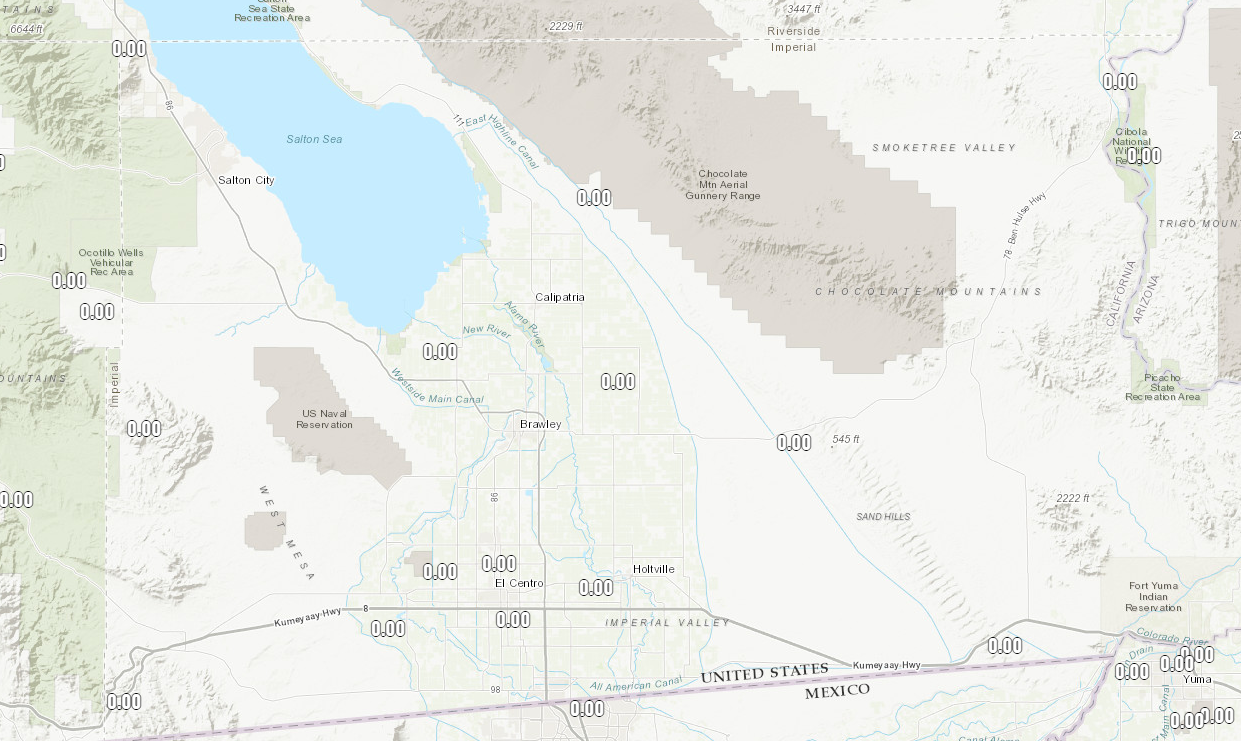
Observed rainfall at weather stations across Imperial County, CA for July 24, 2018.
| Observation for El Centro, Naval Air Facility, CA (KNJK) on July 24, 2018 | |||||||||
| Time | Temperature °F) |
Dew Point °F) |
Relative Humidity (%) |
Wind Direction |
Wind Speed (MPH) |
Visibility Miles) |
Clouds | Weather | |
|---|---|---|---|---|---|---|---|---|---|
| 24 Jul 11:56 pm | 101 | 47 | 16 | SW | 13 | 10.00 | Clear | None | |
| 24 Jul 10:56 pm | 100 | 48 | 17 | WSW | 11 | 10.00 | FEW150,SCT250 | None | |
| 24 Jul 9:56 pm | 105 | 48 | 14 | WSW | 15 | 10.00 | FEW150,FEW250 | None | |
| 24 Jul 8:56 pm | 108 | 46 | 12 | SW | 15 | 10.00 | FEW140,SCT250 | None | |
| 24 Jul 7:56 pm | 107 | 54 | 17 | S | 10 | 10.00 | FEW140,SCT250 | None | |
| 24 Jul 6:56 pm | 110 | 54 | 16 | SSE | 11 | 10.00 | FEW150,SCT250 | None | |
| 24 Jul 5:56 pm | 112 | 53 | 14 | SE | 11 | 10.00 | FEW110,FEW150,SCT250 | None | |
| 24 Jul 4:56 pm | 118 | 52 | 12 | SE | 13 | 10.00 | FEW100,FEW250 | None | |
| 24 Jul 3:56 pm | 119 | 53 | 12 | SE | 14 | 10.00 | FEW080,FEW250 | None | |
| 24 Jul 2:56 pm | 118 | 48 | 10 | SE | 14 | 10.00 | FEW080,FEW250 | None | |
| 24 Jul 1:56 pm | 117 | 49 | 11 | Variable | 6 | 10.00 | FEW080,FEW250 | None | |
| 24 Jul 12:56 pm | 115 | 47 | 10 | Variable | 6 | 10.00 | FEW080,FEW250 | None | |
| 24 Jul 11:56 am | 113 | 46 | 11 | SSE | 7 | 10.00 | FEW080,FEW250 | None | |
| 24 Jul 10:56 am | 111 | 49 | 13 | ESE | 6 | 10.00 | FEW080,FEW250 | None | |
| 24 Jul 9:56 am | 108 | 53 | 16 | ESE | 6 | 10.00 | FEW250 | None | |
| 24 Jul 8:56 am | 102 | 52 | 19 | SSW | 3 | 10.00 | CLR | None | |
| 24 Jul 7:56 am | 95 | 55 | 26 | S | 6 | 10.00 | FEW250 | None | |
| 24 Jul 6:56 am | 90 | 56 | 32 | SE | 6 | 10.00 | FEW250 | None | |
| 24 Jul 5:56 am | 89 | 52 | 28 | W | 5 | 10.00 | FEW250 | None | |
| 24 Jul 4:56 am | 93 | 50 | 23 | SW | 10 | 10.00 | CLR | None | |
RADAR
Given the KIPL observations of rain, there is an expectation that the nearby KYUX Yuma, AZ radar would detect rain drops. However, looking at data valid at 4 PM on July 24, 2018, no rain was detected. The lowest elevation scan did detect fairly widespread values of 10-30 dBZ. However, the differential reflectivity was extremely noisy and correlation coefficient values were very low. In addition, reflectivity values essentially disappeared as one moves through the next two higher elevation scans. This indicates there was likely a high amount of particulate matter in the air (dust, pollutants, etc.).
Progressive loop of KYUX 0.5, 0.9, and 1.3° elevation scans. Top-left: reflectivity;
op-right: differential reflectivity; bottom-right: correlation coefficient; bottom-left: specific differential phase.
Satellite
GeoColor images from the GOES-16 satellite indicate that the sky was clear over the Imperial Valley at 3 PM on July 24, 2018. Over the next few hours, high clouds did begin to increase, primarily above 12,000 feet. These types of clouds may result in virga, though the very high bases make it unlikely for rain to reach the ground.
GOES-16 GeoColor at 3 PM on July 24, 2018. Click for animation.
Upper Air Soundings
Upper Air plots. Mouse over for: Phoenix, Yuma, Las Vegas, Tucson, San Diego.
Weather balloon data from 5 PM on July 24, 2018 (00 UTC 25 July 2018) around Imperial County indicate a very deep and dry boundary layer. This can be seen be the "inverted V" plots seen above. The lifting condensation level, which is the height at which clouds would typically form and generally at the top of the "inverted V", was approximately 15,000 feet. Thus any rain drops that were to fall from clouds would need to survive increasingly hot and dry conditions through their three mile journey to the ground. In reality, this would be exceptionally difficult to happen.

