August 6, 2024 Scottsdale Severe Downburst
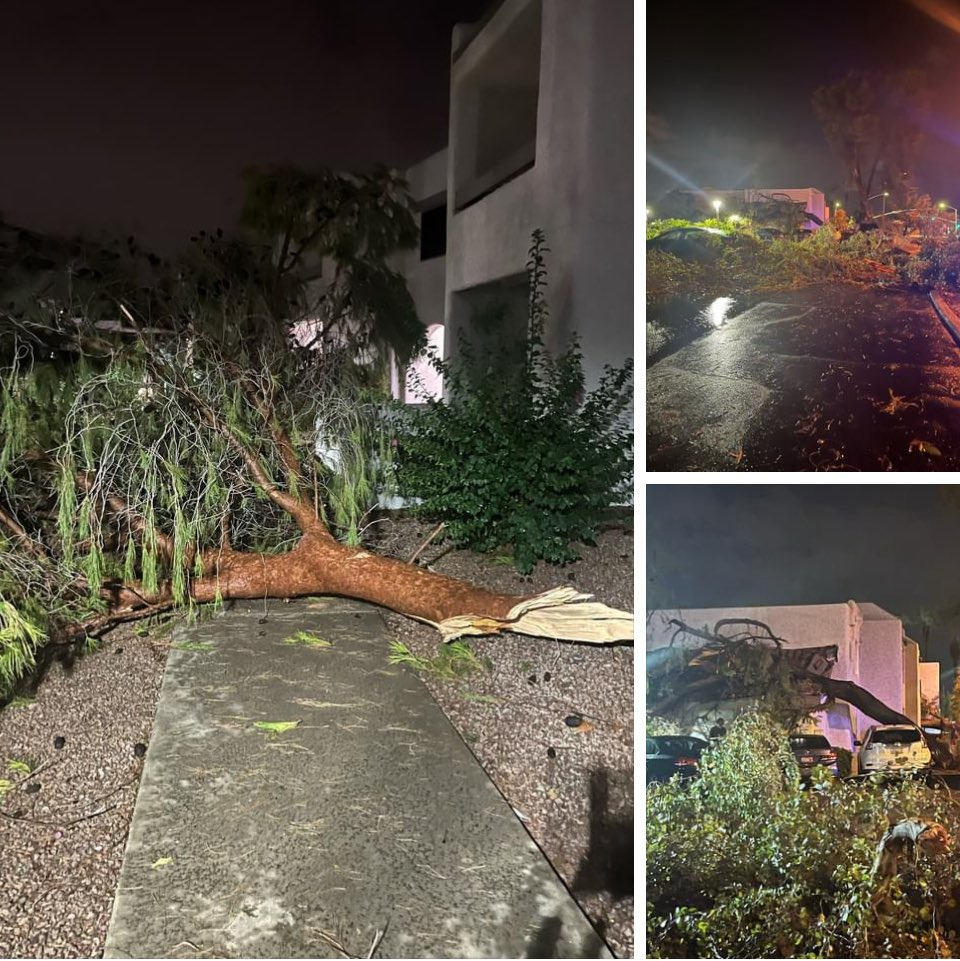
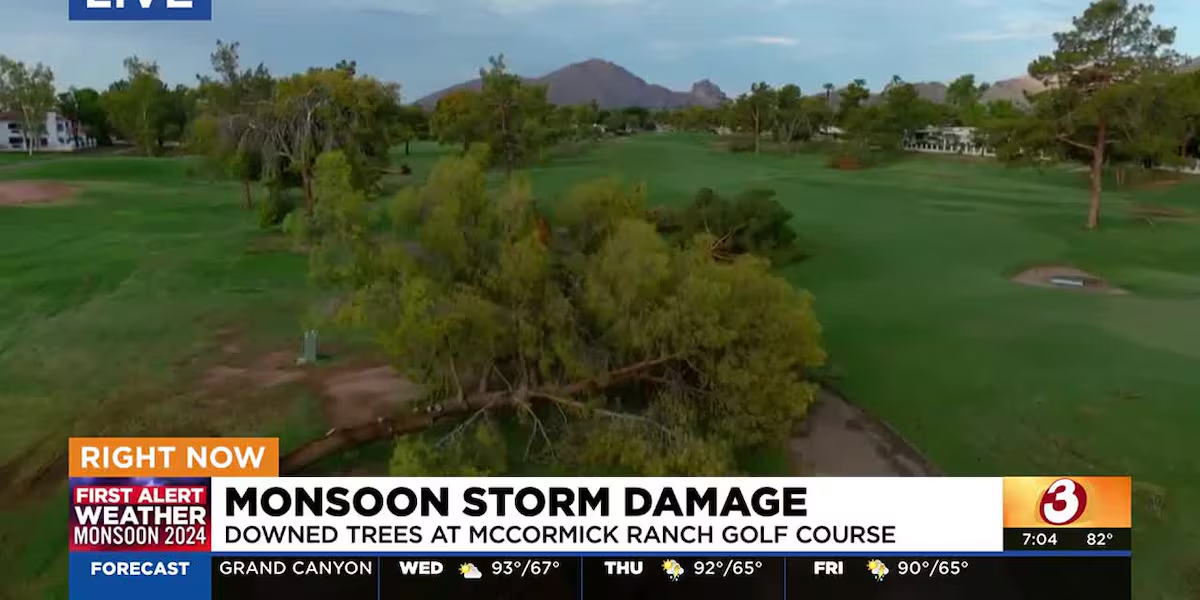
On the evening of August 6th, an isolated thunderstorm developed near the Intersection of Loop 101 and East Via de Ventura Road in Scottsdale, AZ and very quickly became severe as it moved westward through the McCormick Ranch neighborhood (Figure 1). At around 9:00 PM MST, a strong downburst signature was noted on the doppler radar velocity image, resulting in damaging straight-line winds (Figure 2). Reports of numerous large uprooted trees were received shortly after with most of the damage occurring in a small concentrated area at the intersection of Hayden and Via de Ventura Roads in the McCormick Ranch Neighborhood. The large uprooted trees caused significant damage to the Avia McCormick Ranch Apartment Complex as the downed trees destroyed a side roof, damaged vehicles, and blocked road access around the complex, forcing the Scottsdale Fire Department to evacuate several units as some residents were trapped inside (Figure 3). About 1 mile west, at the McCormick Ranch Golf Club, approximately 30 large trees were uprooted (Figure 4). Even though there were no reliable ground truth wind speed measuring sites nearby, based on the magnitude of the damage observed, it was estimated that peak wind gusts from the downburst signature were likely in excess of 60-70 mph.
Figure 1: KIWA doppler radar reflectivity imagery from 08:47 PM MST to 9:29 PM MST August 6, 2024 showing the severe thunderstorm that caused the extensive tree damage in the McCormick Ranch Neighborhood in Scottsdale, with the yellow polygon denoting the severe thunderstorm warning issued.
Figure 2: KIWA doppler radar velocity imagery from 08:54 PM MST to 09:01 PM MST August 6, 2024 showing the downburst signature over the McCormick Ranch Neighborhood in Scottsdale. Note the inbound (green) and outbound (red) pixels denoting a divergent wind pattern as annotated by the arrows, which is indicative that the damage was from straight-line winds The purple haze is indicative of range-folding, which is caused by blockage of the radar beam from nearby terrain features. The black dot indicates the location of the McCormick Ranch Neighborhood where the most extensive wind damage occurred.
Figure 3: Photo collage showing the tree damage at the Avia McCormick Ranch Apartment Complex located near the intersection of Hayden and Via de Ventura Roads. Photo collage from the Scottsdale Fire Department.
Figure 4: Drone footage showing the downed trees at the McCormick Ranch Golf Course. It was estimated that approximately 30 trees were uprooted at the golf course from the storm. Drone footage from AZFamily 3TV & CBS 5 News.
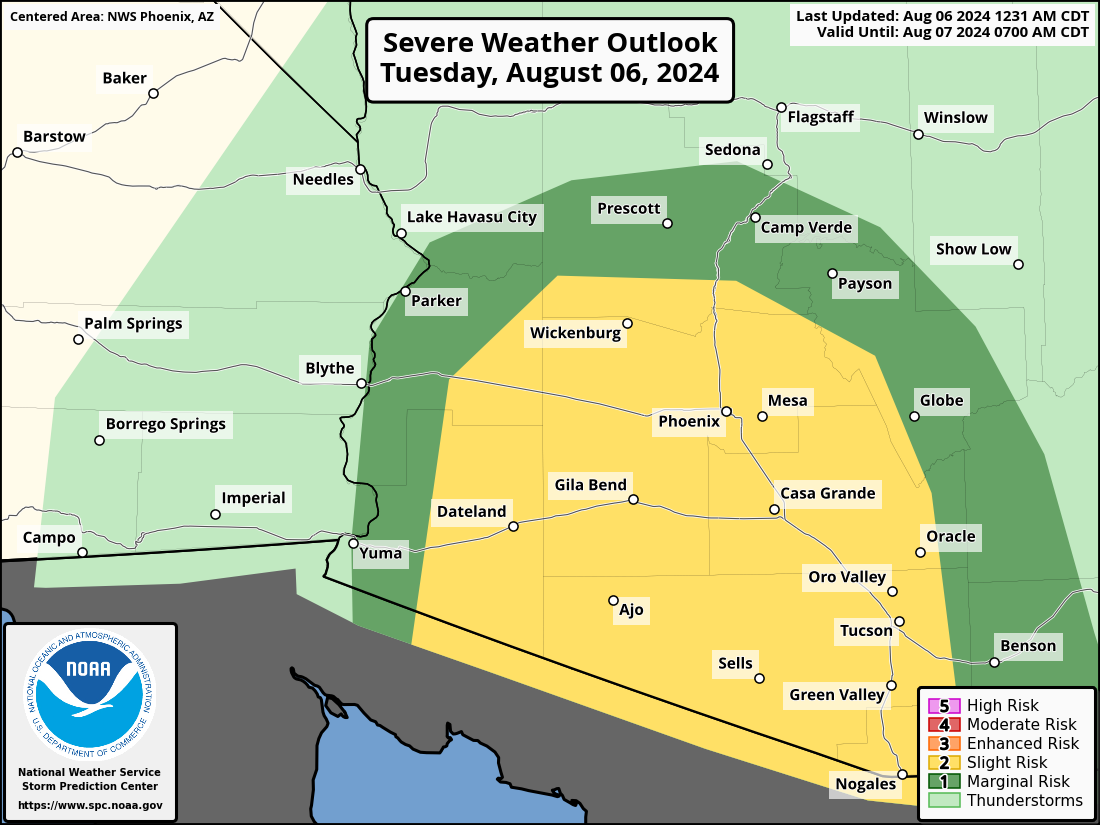
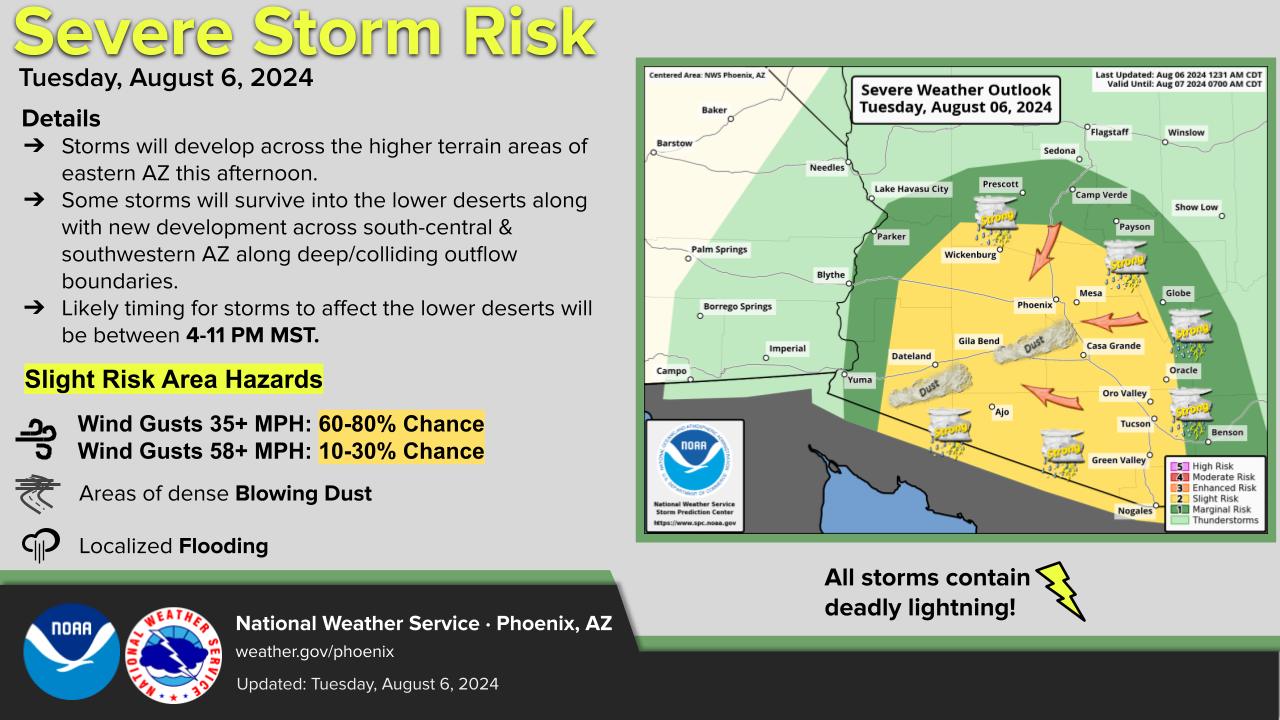
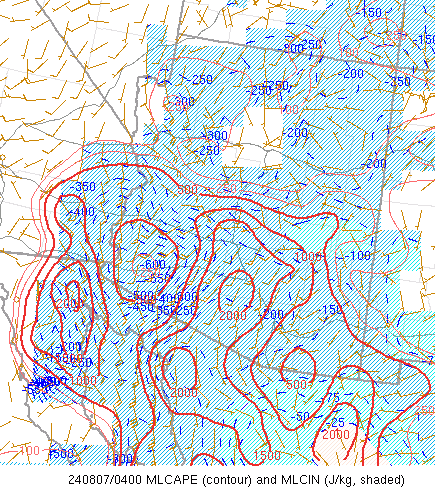
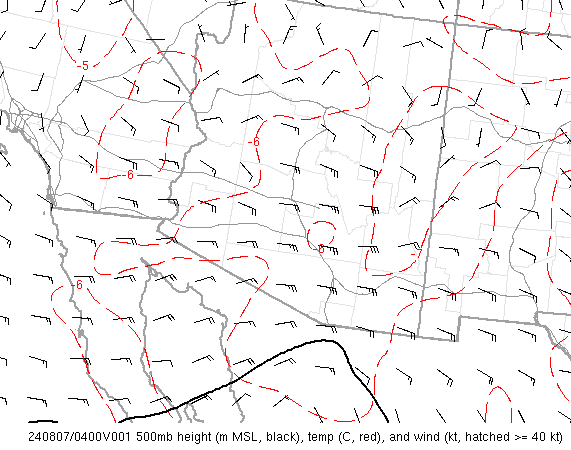
Storm Environment: The severe storm developed under very favorable environmental conditions. Instability was on the high side with the Mixed Layer Convective Available Potential Energy (MLCAPE) at around 1500 J/KG and likely explains the rapid strengthening of the storm as it was maturing (Figure 5). The Downdraft Convective Available Potential Energy (DCAPE), which is a metric used to measure the potential strength for rain-cooled downdraft air, was also on the high side at around 1500 J/KG, elevating the potential for damaging winds (Figure 6). However, what set this environment on this day apart from the environment of all the other typical monsoon thunderstorm days was an enhancement in the vertical wind shear. An easterly wave moving through the area aided in increasing the mid-level winds aloft, resulting in 25-30 kts of vertical wind shear (Figures 7-8). This increase in the vertical wind shear likely may have contributed to the overall storm organization, allowing the thunderstorm to quickly become severe. Given the favorable severe storm setup, the Storm Prediction Center in Norman, OK introduced a slight risk (Level 2) for severe weather, meaning increased confidence that some storms would contain damaging winds, beginning with their Day 1 Convective Outlook issued at 10:31 PM MST on August 5 (Figure 9). Using this outlook, NWS Phoenix messaged the heightened severe weather potential by producing an infographic that was posted to the different social media platforms and local website (Figure 10).
 |
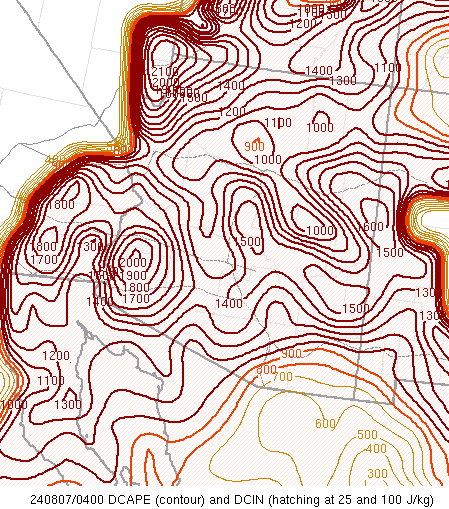 |
Figures 5-6: Objective analysis fields at 9 PM MST August 6, 2024: (Left) Mixed Layer Convective Available Potential Energy (MLCAPE) and Mixed Layer Convective Inhibition (MLCIN) and (Right) Downdraft Convective Available Potential Energy (DCAPE)
 |
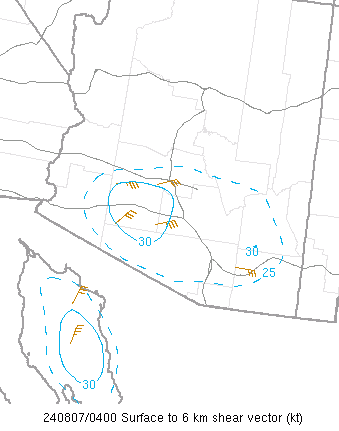 |
Figures 7-8: Objective analysis fields at 9 PM MST August 6, 2024 of (Left to Right): 500mb heights, temperatures, and winds; Surface to 6 km shear
Figure 9: Day 1 Convective Outlook issued by the Storm Prediction Center
Figure 10: Infographic issued by NWS Phoenix highlighting the severe weather threat