Review of the 2021 Monsoon Across the Southwest U.S.
Compiled by NOAA/NWS Phoenix, AZ. Published Nov. 23, 2021
Note: click on images for full-resolution versions.
Overview
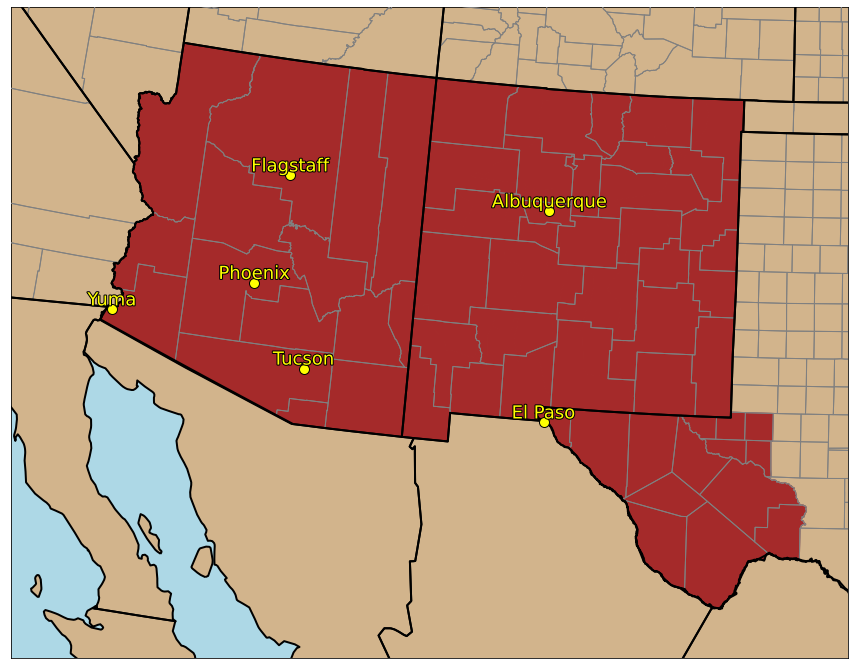
Fig 1. Areal extent of the “Southwest” commonly referenced in this analysis.
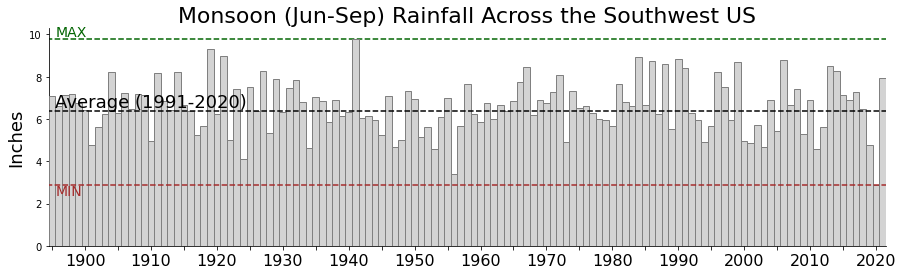
In a stark turn of events, following the driest monsoon on record (2020), the 2021 monsoon was one of the wetter on record across the Southwest US (here defined as Arizona, New Mexico, and far west Texas; Figure 1). Average rainfall during the core monsoon months of Jun-Sep across the region was 7.93", which was the 20th wettest on record (since 1895), wettest since 2014, and well above the 1991-2020 average of 6.39” (Figure 2).
Fig 2. Average monsoon rainfall across the Southwest by year. Data source: NCEI NClimGrid.
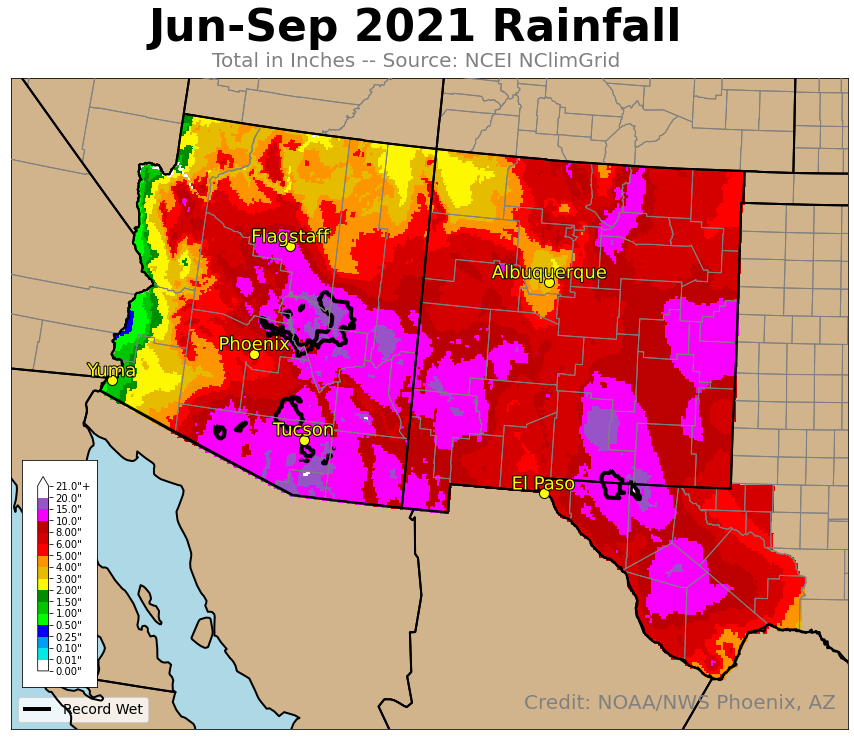
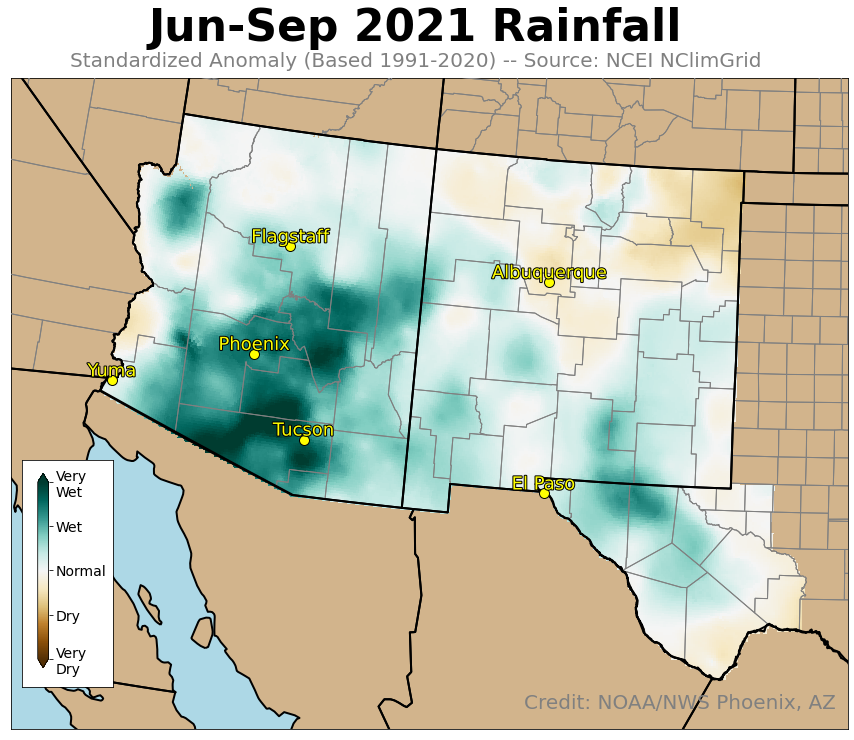
As is usually the case, the absolute heaviest rainfall amounts fell near and over the mountains across the region. Areas that saw record rainfall include (outlined in black, Figure 3-Left): northeast of Phoenix, AZ, east of Payson, AZ, and west of Show Low, AZ; northwest and south of Tucson, AZ; near Ajo, AZ; near the Guadalupe mountains (NM/TX). Correspondingly, these record-setting areas were within broader regions of above average rainfall, though above average rainfall was not observed across the entire Southwest (Figure 3-Right). Notably, much of northern New Mexico observed drier than usual conditions.
|
|
|
|
Fig 3. (Left) Total rainfall for June 2021 through September 2021. Black contours indicate areas of record rainfall (records since 1895). (Right) Standardized rainfall anomalies for June 2021 through September 2021 based on a normal period of 1991-2020. Data source: NCEI NClimGrid. |
|
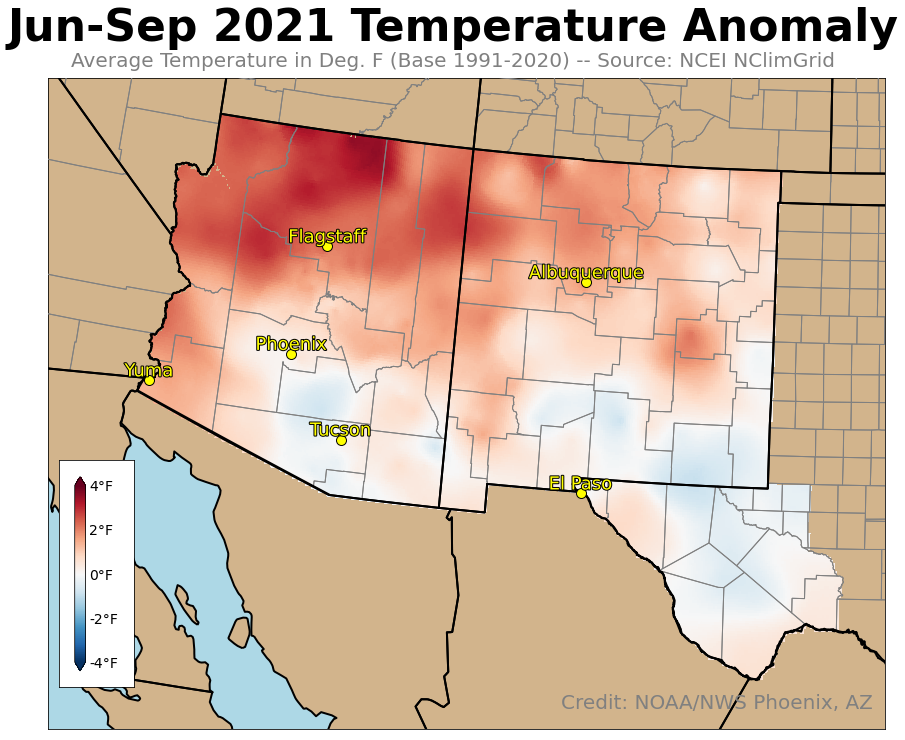
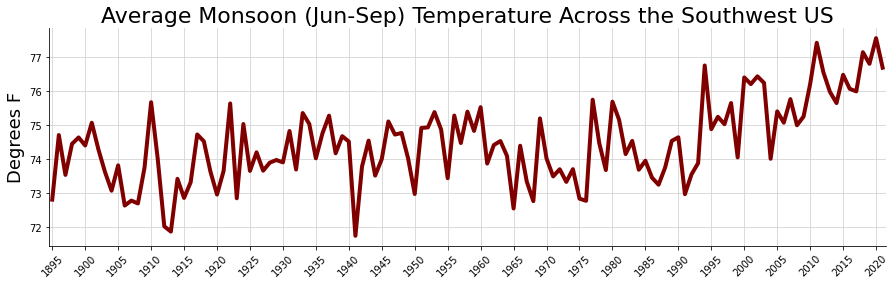
Despite the wetter than usual monsoon, temperatures were above normal for much of the region (Figure 4). Only areas that saw some of the most abnormally heavy rain observed subtly below average temperatures, a clear indication of how strong the climate change signal has become within the temperature records (Figure 5). The average temperature across the Southwest for June 2021 through September 2021 was 76.7°F, which was the coolest since 2017 but 6th warmest on record (since 1895).
Fig 4. Average temperature anomaly (compared to 1991-2020 normals) across the region for June 2021 through September 2021. Data source: NCEI NClimGrid.
Fig 5. Average temperature by year across the Southwest for June through September. Data source: NCEI NClimGrid.
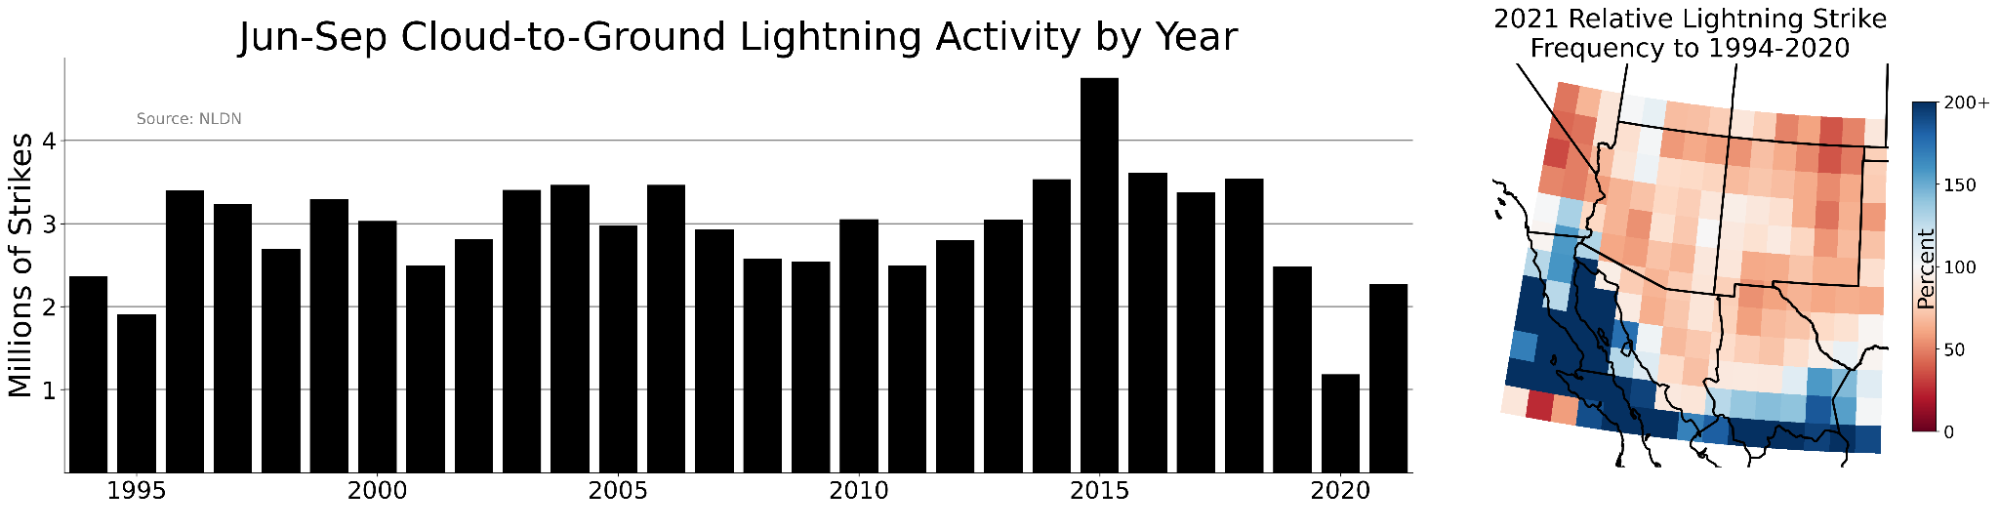
Fig. 6. (Left) Total cloud-to-ground (CG) lightning strikes across the broader region during Jun-Sep by year. (Right) Regional map of the relative CG frequency for June 2021 through September 2021, with red (blue) areas observing less (more) lightning activity than usual. Data source: NLDN.
Over 2.3 million cloud-to-ground (CG) lightning strikes occurred June 2021 through September 2021. Despite the increase in rainfall across the area, this was 30% under the historical average of 3 million. However, it was more than double the record low 1.1 million observed in 2020. An unusually high amount of activity was noted across far southwest Arizona into southeast California and the Gulf of California.
|
Focus: The North American Monsoon
During the summer months, high pressure in the mid-levels of the atmosphere over northern Mexico (often referred to as the “monsoon high”) strengthens, expands, and drifts northward. This causes a reversal in the weather pattern across the region, with storms moving from generally the west-to-east in the spring months to east-to-west in the summer. This monsoonal flow in turn causes a significant increase in atmospheric moisture levels across the typically parched desert region as tropical air moves northward. Combined with the heat of the summer, conditions become favorable for intermittent periods of showers and thunderstorms.
Fig. A1. Animation showing the typical gradual development, northward migration, and ultimate demise of the “monsoon high” through the summer. The black contours and red/blue colorfill represent the height (in meters) of the 500 mb pressure level, representing the vertical middle of the atmosphere. The cool/blue (warm/red) colors in the north (south) represent lower (higher) density air; temperature is directly proportional to pressure, thus blue (red) colors are associated with cool (warm) air. The blue/magenta/cyan lines represent precipitable water values (PWAT, the amount of water vapor in the atmosphere if condensed into liquid) of 1.0/1.5/2.0”. As the monsoon high builds, greater PWAT values move north. The inset trace is for Phoenix, AZ, showing the seasonal moisture trend. Data source: NCEP NARR.
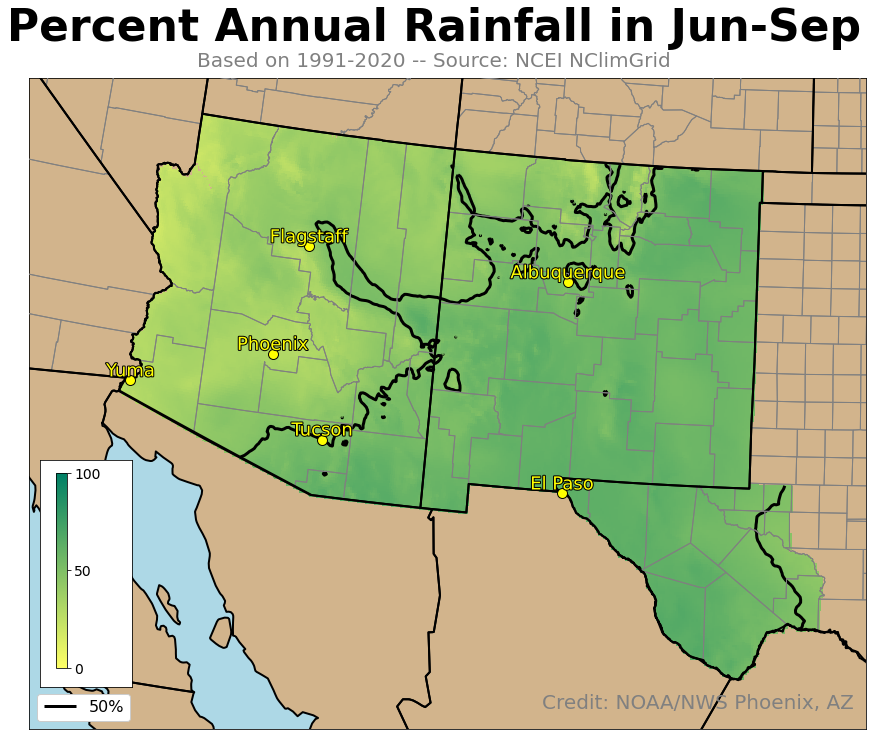
For the region as a whole, roughly 50% of annual precipitation falls during the June through September period. That amount varies significantly though, from less than 20% along the western Arizona border to almost 70% in the mountains of southern New Mexico and far west Texas. The increase in clouds, showers, and thunderstorms provide relief from the region’s relentless heat by blocking out sunshine and spreading rain-cooled air across the surface.
Fig. A2. The percent of annual rainfall which arrives during the core monsoon months of June through September. Typically the season’s rains are more notable across New Mexico and far southeast Arizona. Data source: NCEI NClimGrid. |
Weather Patterns During the 2021 Monsoon
The monsoon high quickly built northward in mid June, leading to an early start to thunderstorm activity. The high remained mostly to the north for much of July and August, allowing a persistent easterly flow to remain and sustaining the showers and thunderstorms. The period of July 21-25 was unusually active due to the presence of a significant easterly wave, which led to several rounds of severe weather. Another period in mid-August brought strong northeasterly flow to the region, which tends to be a favorable pattern for strong to severe thunderstorms.
Fig. 7. Animation showing the weather pattern during the 2021 monsoon. The black contours and red/blue colorfill represent the height (in meters) of the 500 mb pressure level, representing the vertical middle of the atmosphere. The blue/magenta/cyan lines represent precipitable water values (PWAT, the amount of water vapor in the atmosphere if condensed into liquid) of 1.0/1.5/2.0”. The inset PWAT trace is for Phoenix, AZ. Data source: NCEP NARR.
|
|
|
|
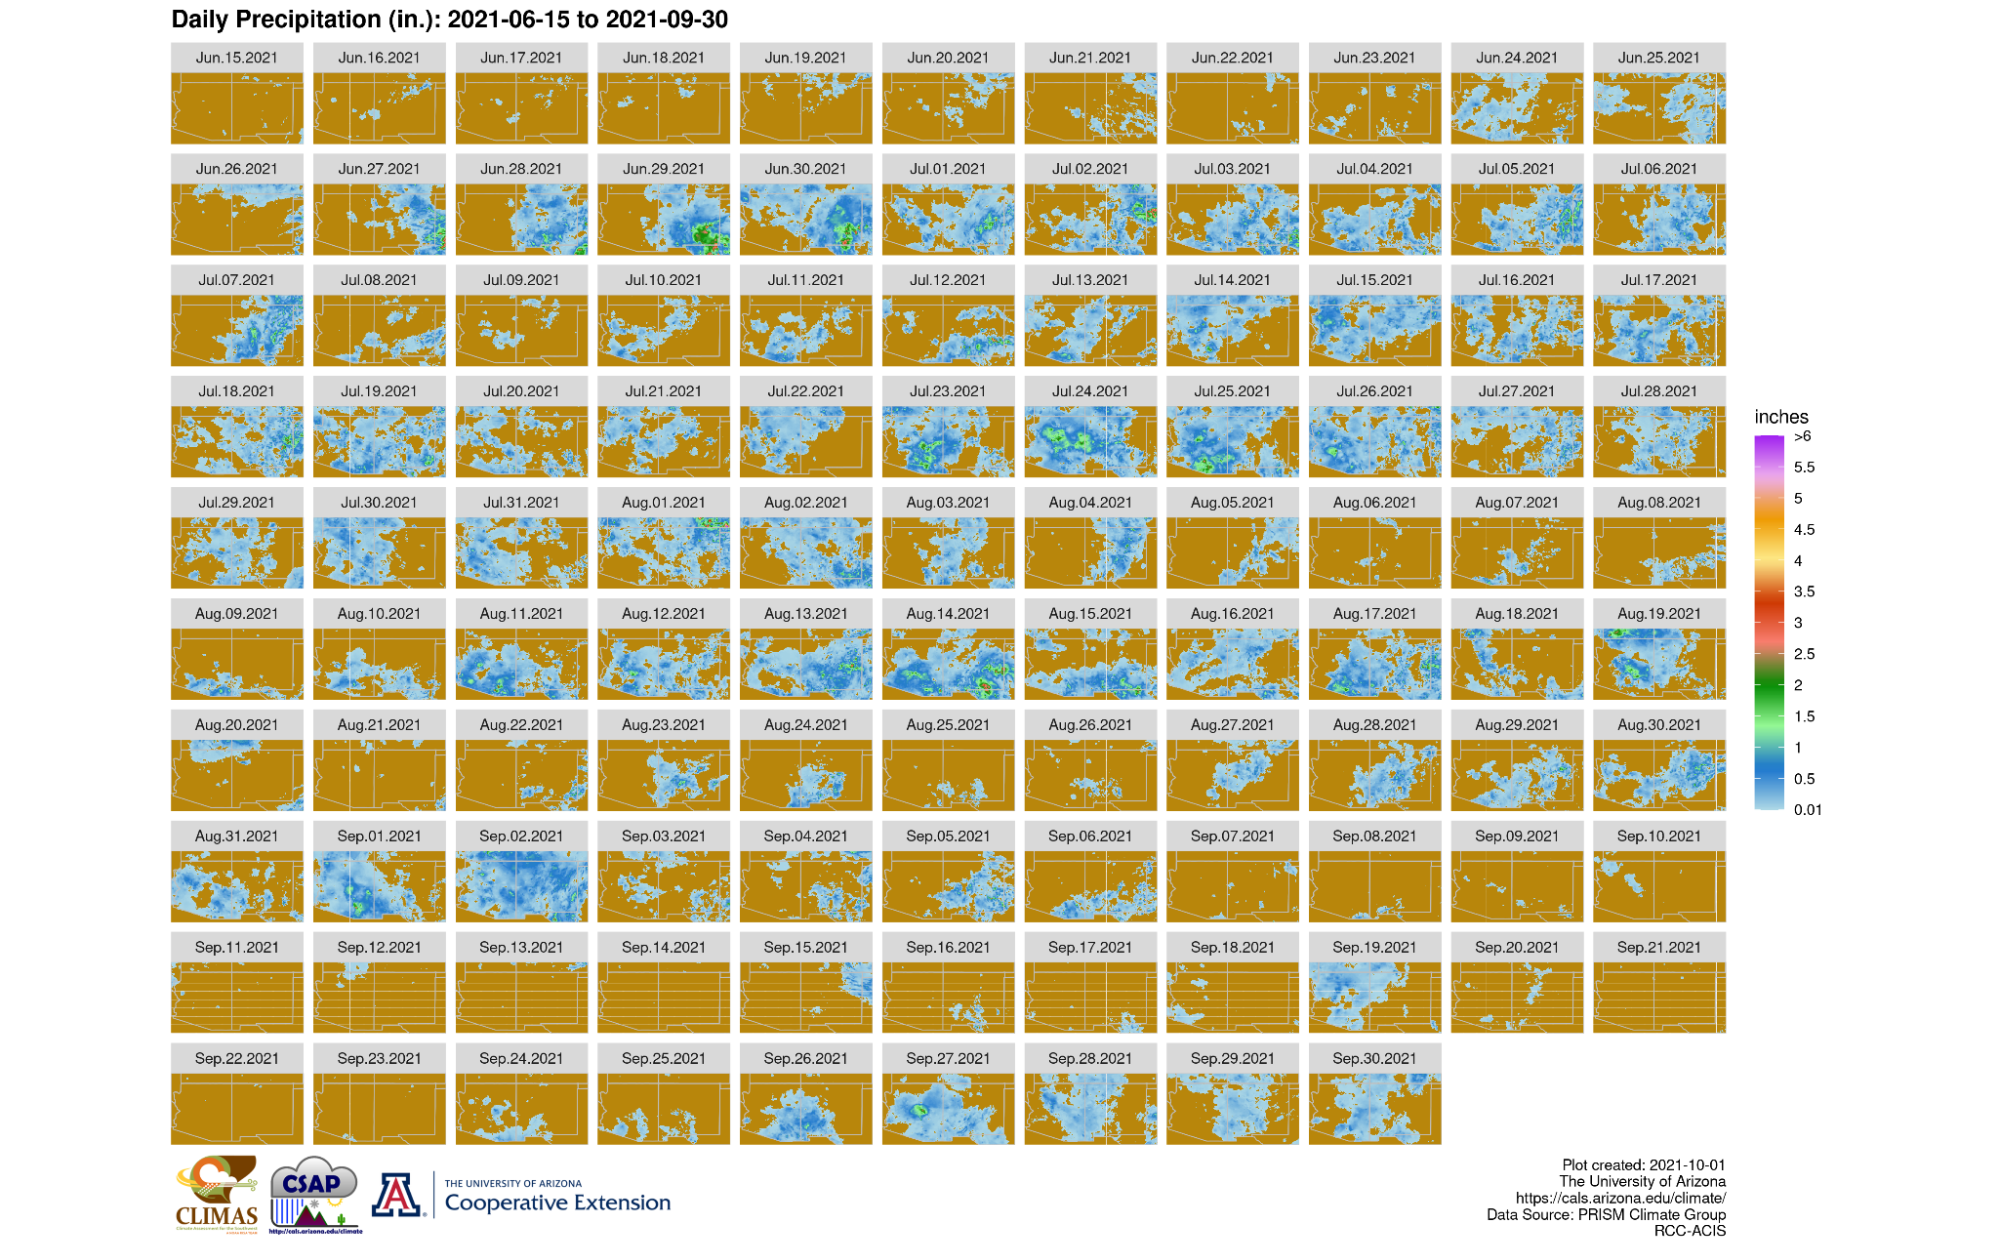
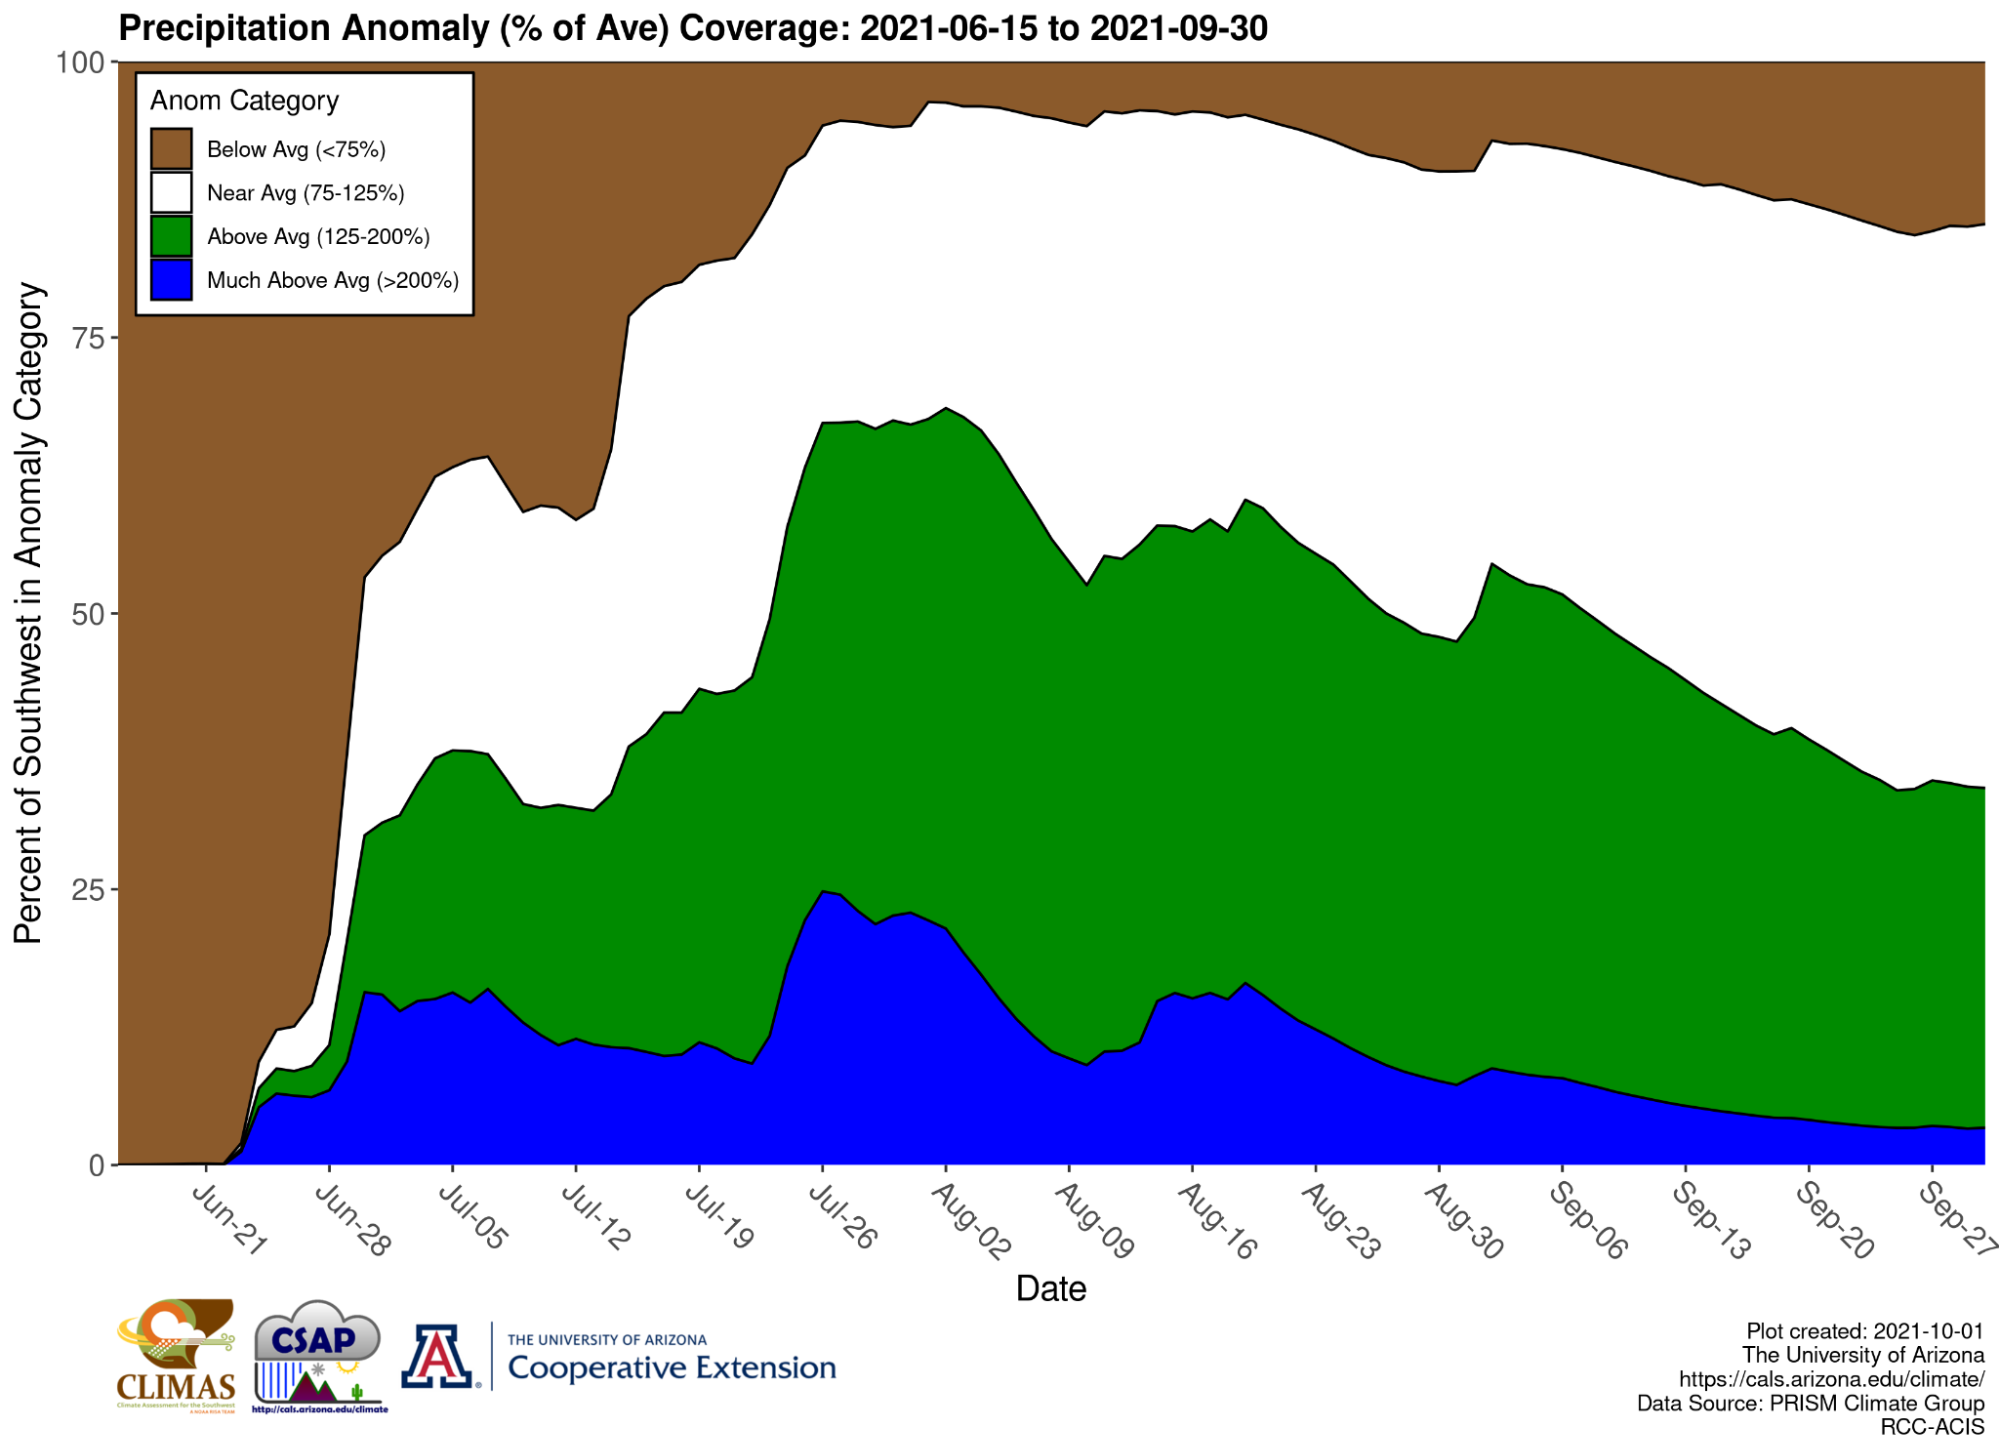
Fig. 8. (Left) Daily rainfall data across the region. (Right) Percent of the AZ/NM area with below/near/above/much above average rainfall. Source: CLIMAS. |
|
Within the NOAA/NWS Phoenix forecast area, several notable events occurred, including several days of heavy rain in July, catastrophic flooding in Gila Bend on Aug. 14, widespread damaging winds across Phoenix on Aug. 16, catastrophic flooding near Globe on Aug. 18, and flooding across southeast California on Aug. 30-31.
Factors
Several factors were analyzed to varying extents for their contribution to the active monsoon season across the Southwest. They include:
1. Monsoon High Position
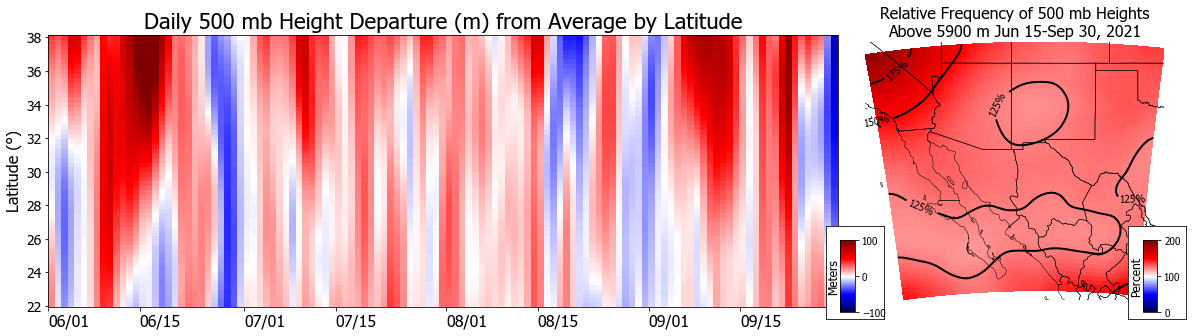
As shown in Figure A1, the monsoon high typically develops during June with the center moving near the Four Corners area in July and August. This process allows for the gradual increase of moisture across the Southwest. In 2021, the monsoon high quickly built north by mid/late June as shown by the dark reds in Figure 9, resulting in atmospheric moisture levels quickly increasing across the region. The high remained in a generally favorable position for much of the monsoon, which was a change from 2020 when a stronger high was near the international border. The frequency of very high 500 mb heights (5900+ meters) was slightly above average, a reflection of long term trends of increasing heights due to a warming atmosphere, but more uniformly distributed.
Fig. 9. (Left) The daily departure (in meters) of 500 mb heights from the long-term average (1979-2020) across the Southwest, averaged by latitude. Red (blue) colors denote above (below) average heights, indicative of stronger (weaker) high pressure aloft. (Right) The relative frequency (percent) of 500 mb heights above 5900 m during monsoon 2021 compared to the 1979-2020 average. Data source: NCEP NARR.
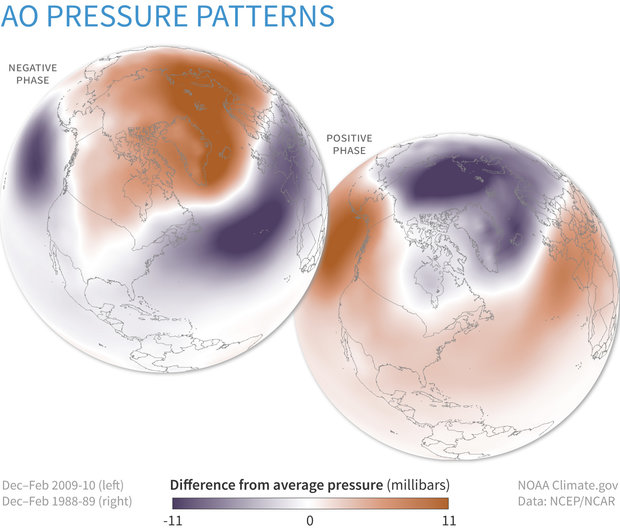
The early and northward development of the monsoon high may have partially been tied to the Arctic Oscillation (AO), which is a “back-and-forth shifting of atmospheric pressure between the Arctic and the mid-latitudes of the North Pacific and North Atlantic”. The AO is indexed by comparing the current height anomalies at 1000 mb (near surface) poleward of 20°N to identified loading patterns. A positive (negative) AO means higher (lower) pressure in the midlatitudes of the northern hemisphere due to a stronger (weaker) jet stream (Figure 10).
Fig. 10. Winter surface pressure across the Northern Hemisphere compared to the 1981-2010 average when the Arctic Oscillation (AO) was strongly negative (top, 2009-10) and when it was strongly positive (bottom, 1988-89). The negative AO favors a warm Arctic and cool conditions across the U.S. and Europe. The positive phase favors a cool Arctic and relatively warm conditions in the mid-latitudes. NOAA Climate.gov image, based on data from the Physical Sciences Lab.
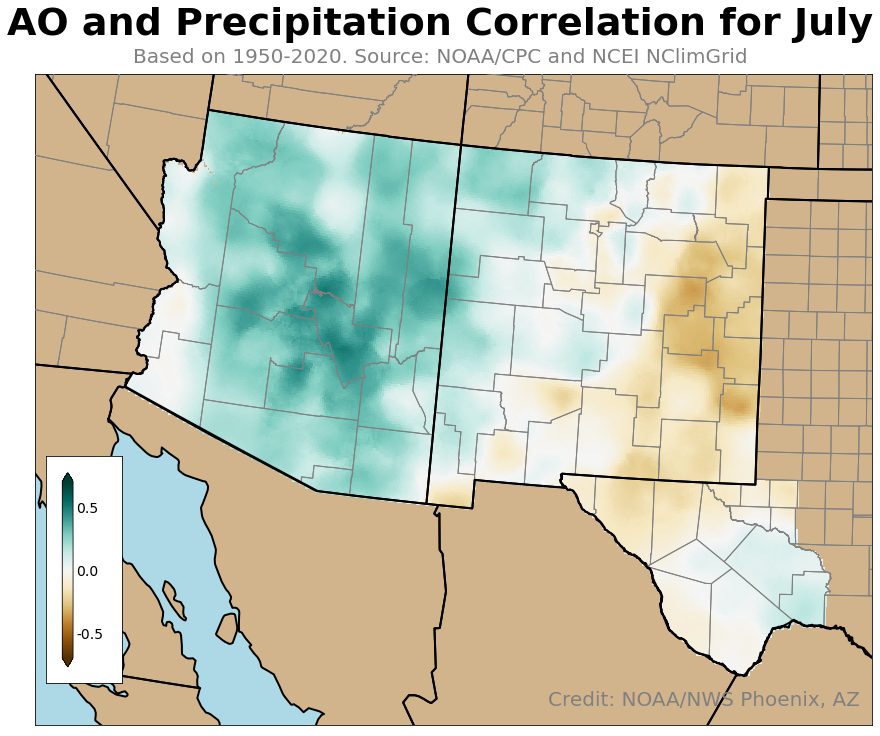
Fig. 11. The correlation between the Arctic Oscillation (AO) index and precipitation across the Southwest during July (based on 1950-2020). A positive (negative) correlation results in wetter (drier) conditions, as indicated by the green (brown) shading. Data source: NOAA/CPC and NCEI NClimGrid.
The AO is generally thought of as having more implications in the winter, though the mechanics in the early summer may still apply as the jet stream climatologically retreats north as the monsoon high builds in. A modest relationship does exist between the AO index and precipitation in July (Figure 11), suggesting that a positive AO favors increased rainfall across Arizona and decreased across far eastern New Mexico. The AO index for July 2021 was +0.62, which was the 8th highest on record (since 1950). Comparatively, the index was -0.89 and -0.41 in July 2019 and July 2020, respectively.
2. Favorable Mid/Upper Level Wind Patterns
Through the 2021 monsoon, several periods of enhanced mid-level northeast winds were noted across portions of Arizona and New Mexico. This is a known severe weather pattern referred to as a Maddox Type II setup (Maddox et al. 1995, Mazon et al. 2016), where the monsoon high drifts to the northwest of its typical location near the Four Corners. This results in northeast flow across Arizona and western New Mexico (Figure 12). Conceptually, this promotes thunderstorms that develop over the mountains of northern Arizona and New Mexico to drift to the southwest, often into much more unstable air allowing for further intensification.
Fig. 12. Streamline map (500 mb) for the Type II severe weather pattern across central/southern Arizona (from Maddox et al. 1995).
The severe weather event on July 30, 2018 is an example of this pattern. The Type II pattern can also be enhanced by transient upper level lows that migrate from east-to-west from Texas into the Southwest. Such an event occurred July 17-27, 2021 (Figure 13).
Fig. 13. GOES-16 satellite loop from July 17, 2021 through July 27, 2021 depicting upper level water vapor. Note the several counterclockwise circulations that move through the Central Plains, across Texas, and into the Southwest during the event.
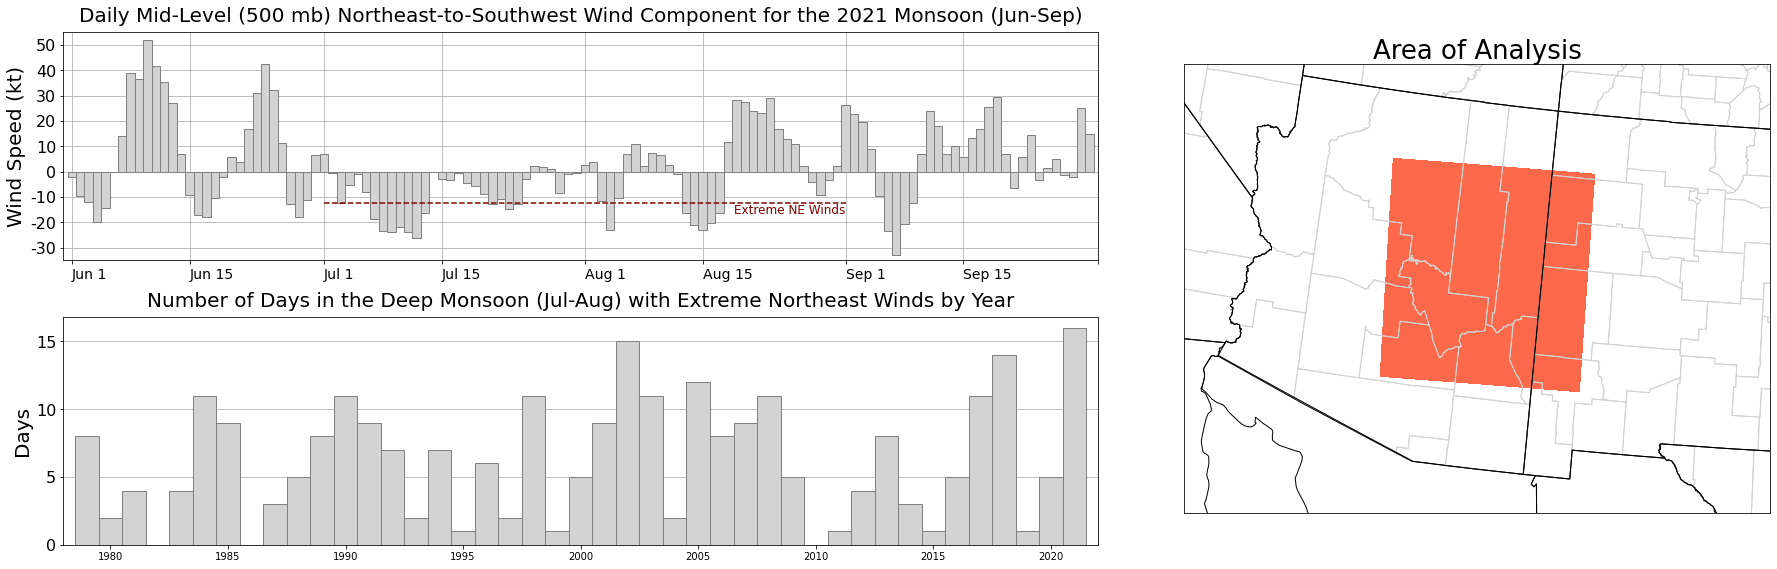
The 2021 monsoon featured a record number of days with extreme northeast mid-level flow. This was determined by calculating the daily northeast-southwest component of the 500 mb wind for a subregion of Arizona and New Mexico (Figure 14). Positive (negative) values indicate a wind from the southwest (northeast). Values near zero indicate purely northwest or southeast winds or calm winds. Days that fell below the 10th percentile indicated strong northeasterly flow and were deemed “extreme northeast wind” days. Sixteen such days occurred during the core monsoon months of July-August in 2021, the most on record.
Fig. 14. (Top-left) Subregional daily average northeast/southwest 500 mb wind component (kt) for the 2021 monsoon (Jun-Sep). (Bottom-left) Number of days, by year, that fell in the 10th percentile during the core monsoon months of July-August. (Right) Sub-region used for midlevel flow analysis. Data source: NCEP NARR.
Looking closely at the individual days, there were three notable periods with strong and persistent northeast flow: July 7-13, July 21-25, and August 13-17. They correlated with extended periods of very active weather across Arizona. Conversely, instances of strong southwest winds corresponded with decreased moisture levels and low thunderstorm activity.
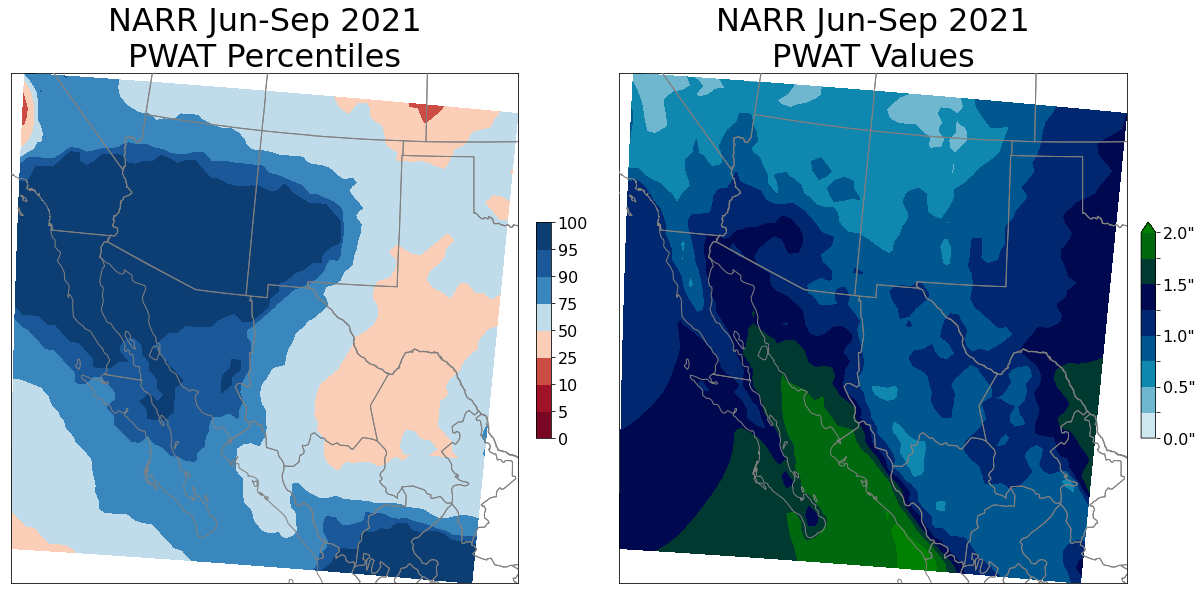
3. Record High Moisture Amounts
Based on reanalysis data (1979-2021), the average amount of water vapor in the atmosphere over a large portion of the Southwest during the 2021 monsoon was the highest on record (Figure 15). Analysis (not shown) comparing average precipitable water (PWAT) values to average rainfall by season shows a modest correlation (r=0.50). Broadly, the average rainfall across the Southwest if mean seasonal PWAT values are above (below) average is 5.1” (4.0”).
Fig 15. (Left) Percentile of average precipitable water (PWAT) values from June 2021 through September 2021 relative to 1979-2020. Dark blue areas covering much of Arizona and southwest New Mexico indicate PWAT values were the highest on record in the dataset. (Right) Absolute average PWAT values. Data source: NCEP NARR.
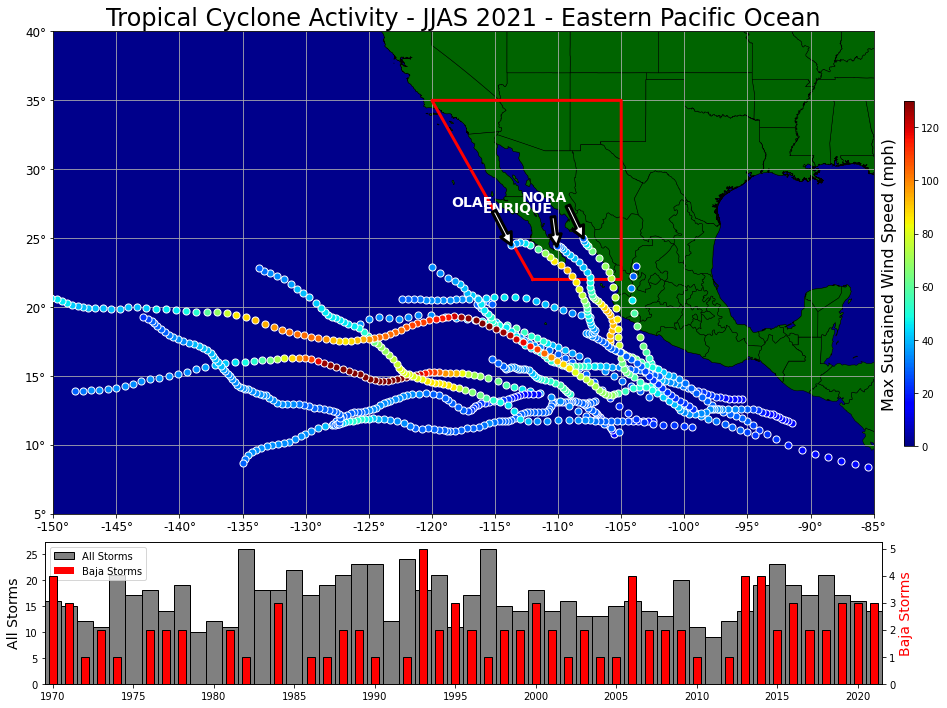
4. Tropical Cyclone Activity
There were 14 tropical cyclones in the Eastern Pacific Ocean from June 2021 through September in 2021 (Figure 16). This was the fewest since 2013 but comparable to the long term average of 15.
Fig 16. (Top) Tropical cyclone track and intensity for the 2021 monsoon across the East Pacific Ocean. Cyclones that enter the Baja California area (red box) have potential to influence precipitation across the Southwest due to moisture influxes and/or direct cyclonic activity. (Bottom) Historical plot of East Pacific Ocean tropical cyclones (gray bars) and cyclones within the Baja California area (red bars). Data source: HURDAT2.
When looking at tropical cyclones that moved into a favorable area to potentially impact the Southwest (as depicted by the red box in Figure 16), there were three such storms in 2021 - on par with the past several years. They included Enrique (June 25-30), Nora (August 25-30), and Olaf (September 7-12). While tropical cyclones have moved into the Southwest directly (last being Newton in 2016), none did so this year though indirect impacts through increased atmospheric moisture did occur.
5. Wildfire Activity
During calendar year 2021 (through November 1), approximately 724,000 acres burned across the Southwest Area (Figure 17), which was the fourth most since 2000. Notably different from 2020, persistent smoke layers were generally not observed during 2021. Although not quantified in this analysis, published research (McKendry and Gutzler 2014) has shown smoke particulate matter can inhibit the process in which water droplets form and grow. This in turn reduces the ability for raindrop formation and ultimately can lower rainfall amounts. Smoke can also reduce the insolation reaching the earth’s surface, which lowers the heating of the near-ground air and thus reduces the amount of atmospheric instability. Therefore, it is reasonable to assume that smoke ultimately played some role in reducing rainfall amounts.
Fig 17. (Left) Acres of land burned by year across the Southwest Area (through October for 2021). (Right) Map depicting the Southwest Area. Data source: NIFC Southwest Coordination Center.
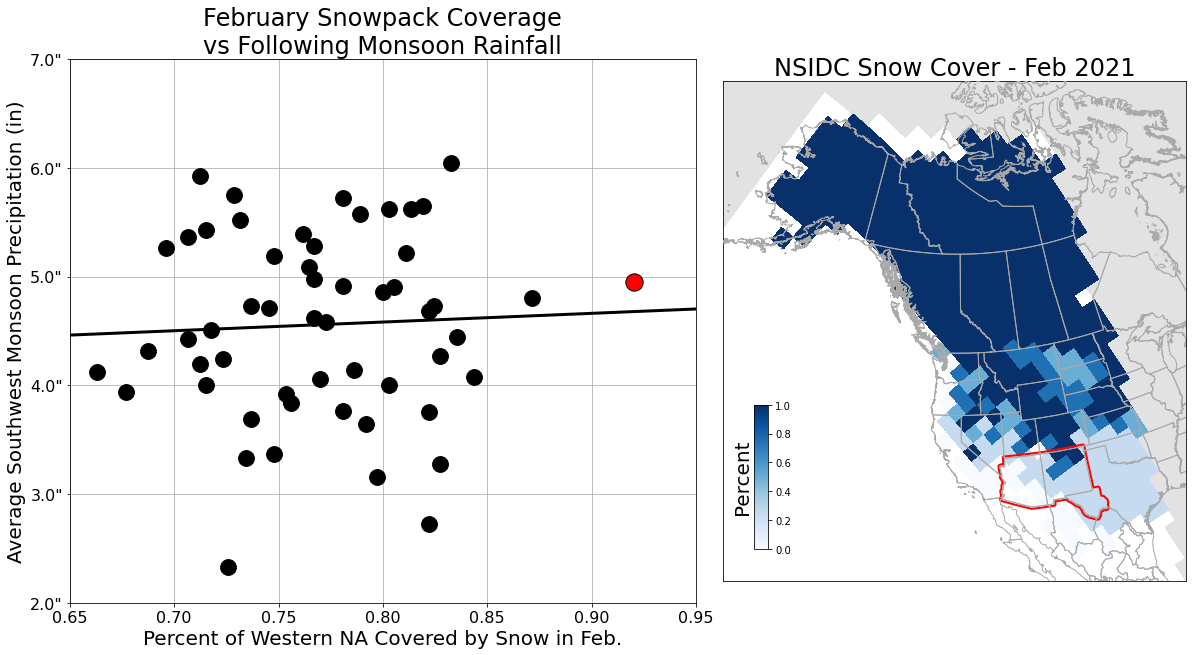
6. Snowpack Across Western North America
Previous published research (Hawkins et al. 2002) suggested precipitation across the Southwest during the monsoon is correlated to the spatial extent of snow cover across western North America, particularly during the month of February. The authors found that “during years of low snow-cover extent, 500-mb heights were higher across much of the United States and 850-mb specific humidity values were increased over the desert southwest compared with high snow-cover extent years.” They theorized a lack of snow cover allowed the monsoon high to build northward earlier than usual, leading to enhanced seasonal rainfall.
Fig 18. (Left) Plot of average February snowpack extent for western North America land areas (x-axis) against the average monsoon (Jun-Sep) rainfall across the Southwest (y-axis). The red dot indicates 2021. (Right) Snowpack extent for February 2021. Gray shading indicates masked areas outside of western North America as defined in previous research. The Southwest precipitation area is outlined in red. Data source: NSIDC, NCEI.
While this analysis does not disagree with the premise, reassessing the research with several decades of additional data unfortunately does not yield similar results. Regression analysis of? western North America February snowpack against subsequent precipitation across the Southwest during the monsoon yields nearly no correlation (r=0.04). February 2021 featured the most extensive snowpack across western North America (Figure 18) on record (since 1967), part of the overall weather pattern which brought bitter and deadly cold to the Deep South. Based on previous research, it arguably should have resulted in a slower monsoon onset, which was not the end result. Further research would be warranted on this topic.
NOAA/NWS Services During the 2021 Monsoon
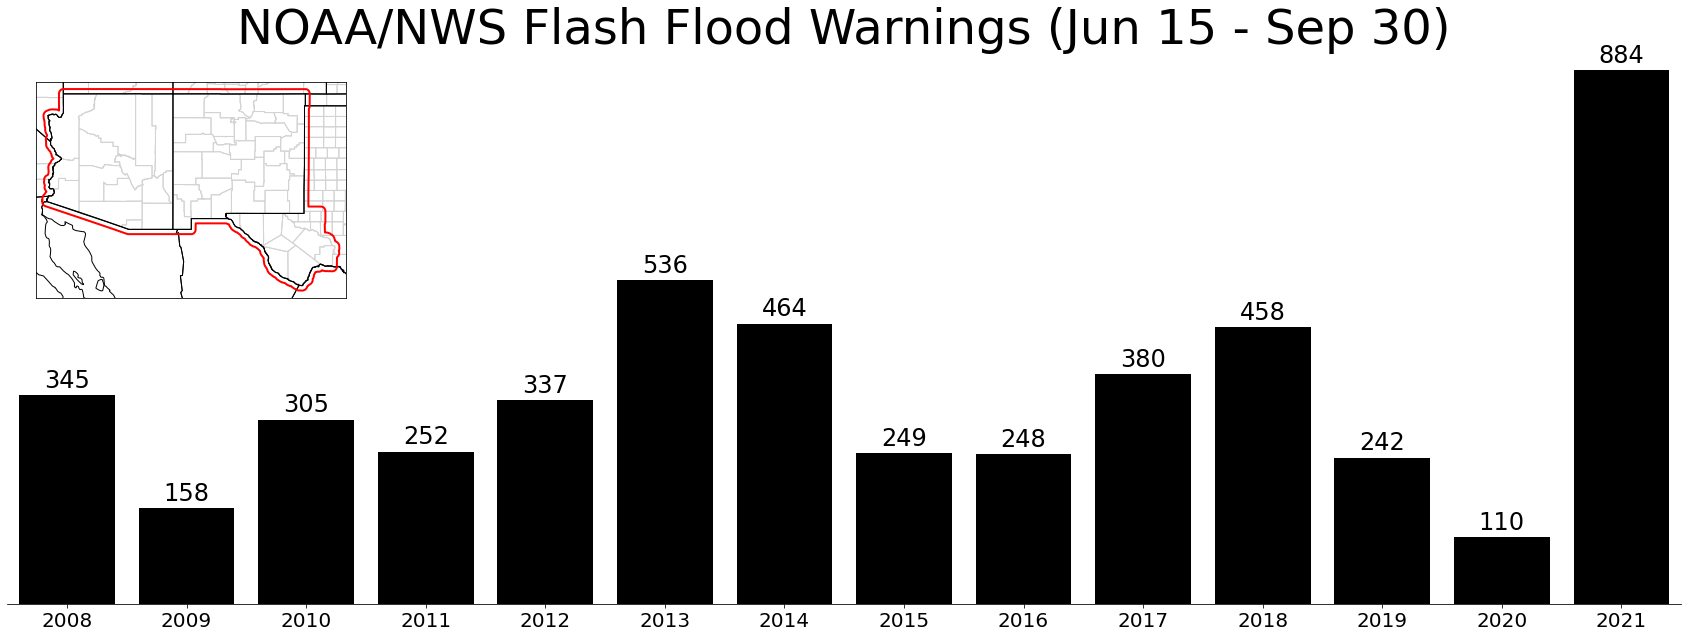
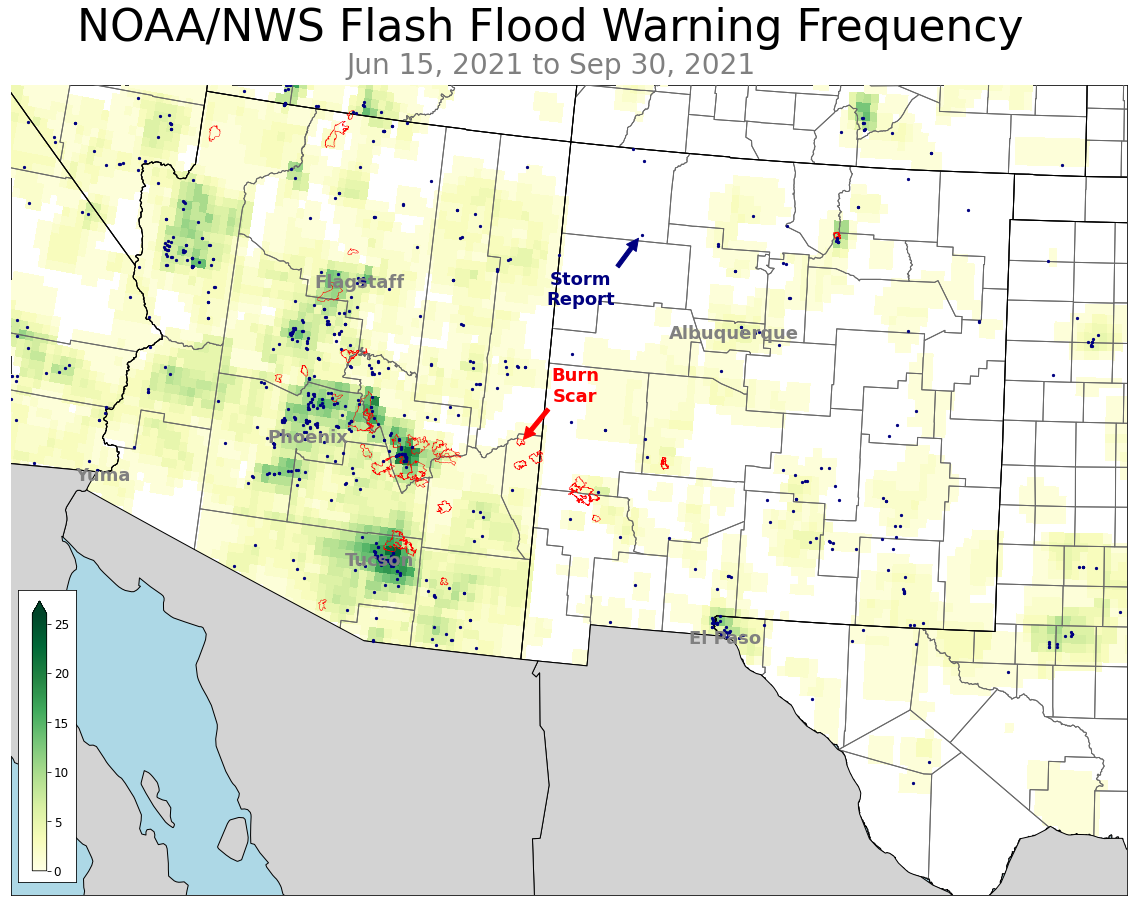
Nearly 900 Flash Flood Warnings (FFWs) were issued by NOAA/NWS Weather Forecast Offices (WFOs) across the Southwest during the 2021 monsoon, which was a record for the modern warning era (since 2008) (Figure 19). Most of the activity was concentrated in Arizona (Figure 20). The drastically higher frequency of FFWs was driven by a combination of the active weather patterns, the large amount of recent burn scars (highly susceptible to flash flooding), and a continued focus on impact-based services. Over 650 flood-related storm reports were received by WFOs.
Fig. 19. The number of FFWs issued by WFOs across the Southwest by year since 2008. The 2021 monsoon saw, by far, the most FFWs.
Fig. 20. A density map of FFWs issued by WFOs during the 2021 monsoon. Local Storm Reports (information received by WFOs indicating a flash flood occurred) are denoted as small blue circles. Burn scars, which are highly susceptible to heavy rains, are also outlined (red).
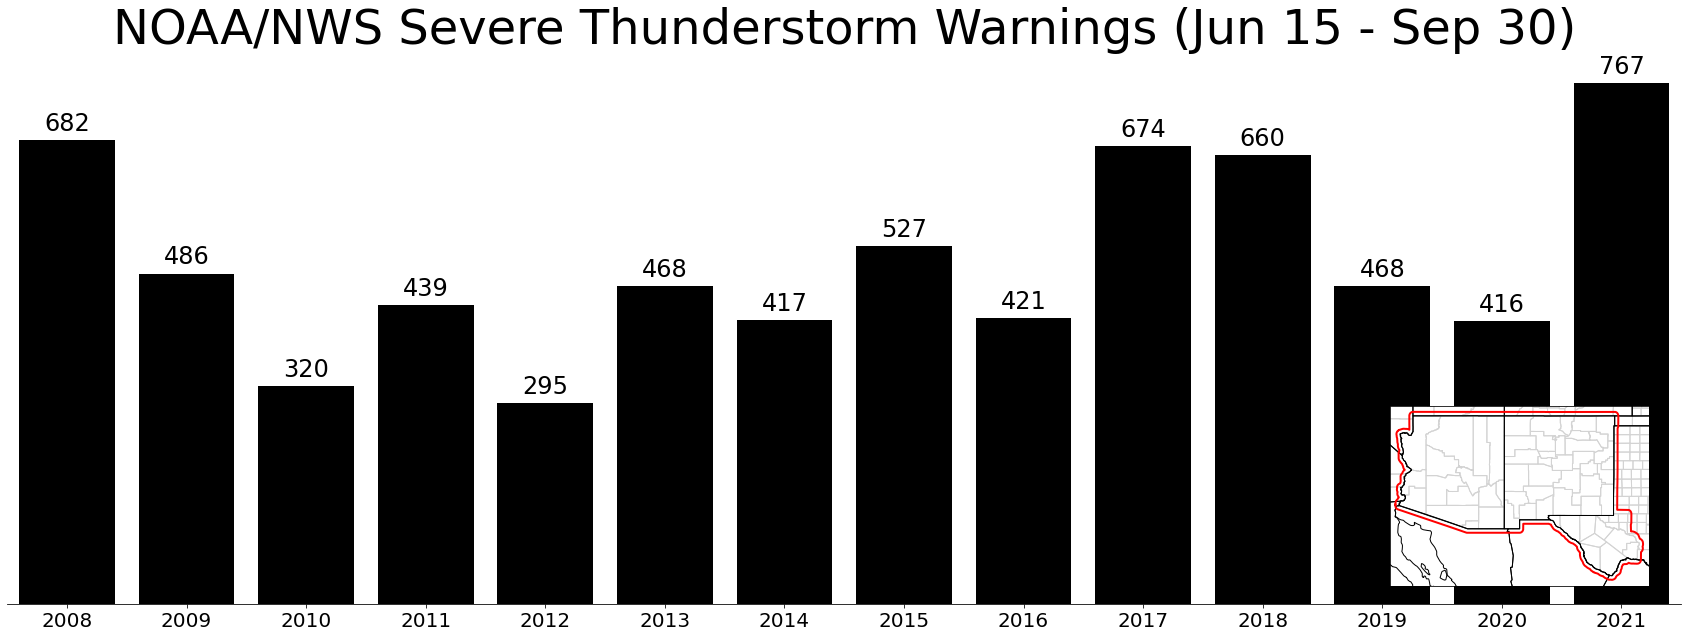
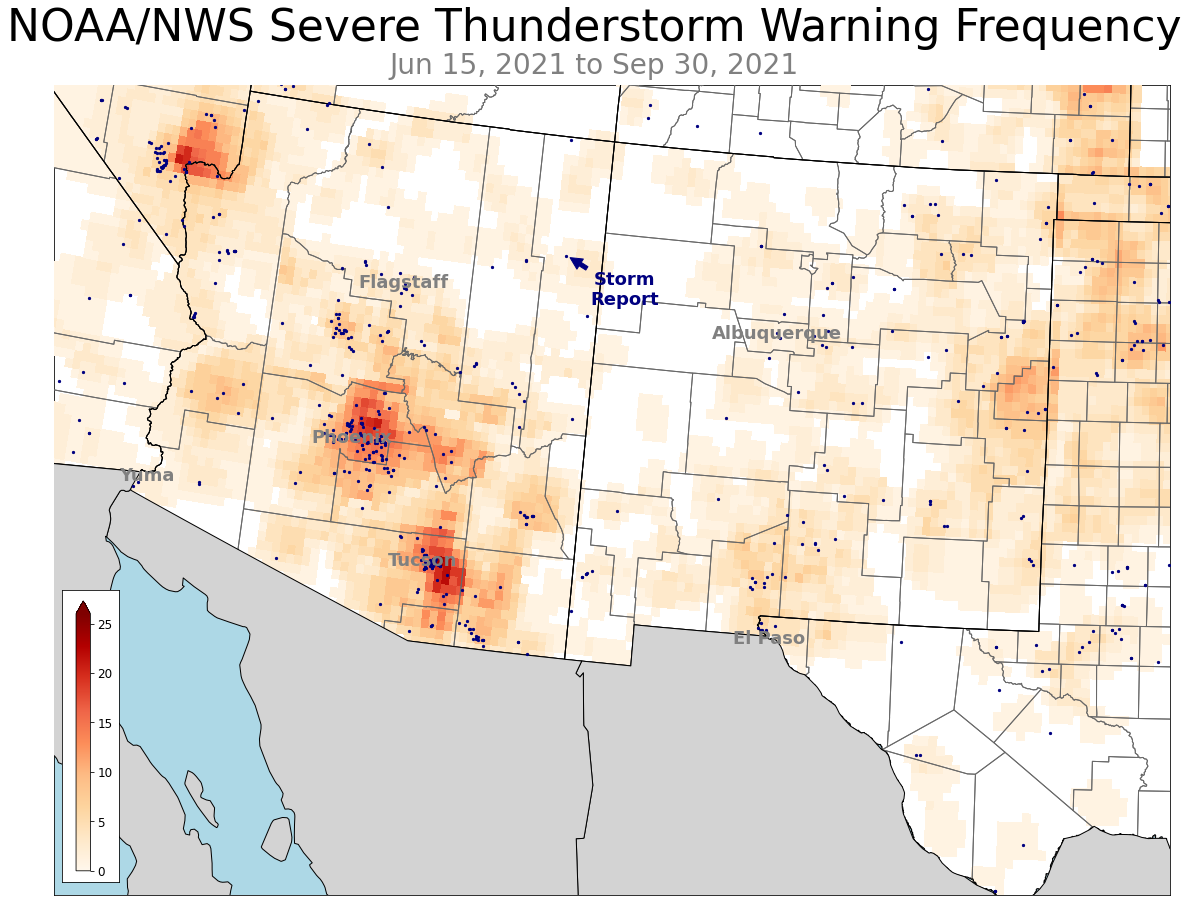
The nearly 800 Severe Thunderstorm Warnings (SVRs) issued by WFOs also set a new record, however it was not drastically higher than some more active years in the recent past (Figure 21). Spatial coverage was more uniform across the region, with higher frequencies noted near major population centers where the potential for significant impacts are increased (Figure 22). Over 450 severe-related storm reports were received by WFOs.
Fig. 21. The number of SVRs issued by WFOs across the Southwest by year since 2008. The 2021 monsoon saw a record number of SVRs.
Fig. 22. A density map of SVRs issued by WFOs during the 2021 Monsoon. Local Storm Reports (information received by WFOs indicating storm damage, high winds, or large hail occurred) are denoted as small blue circles.