August 22, 2024 Phoenix Metro Severe Thunderstorms and Dust Storm
Note: For the first two radar images, click on the image for full-resolution versions
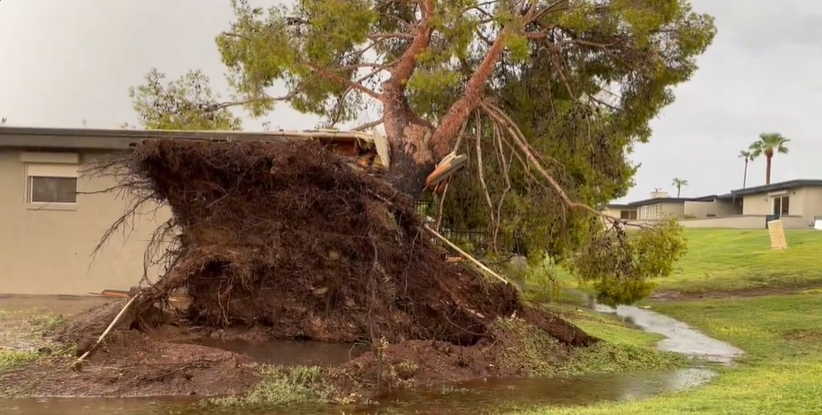
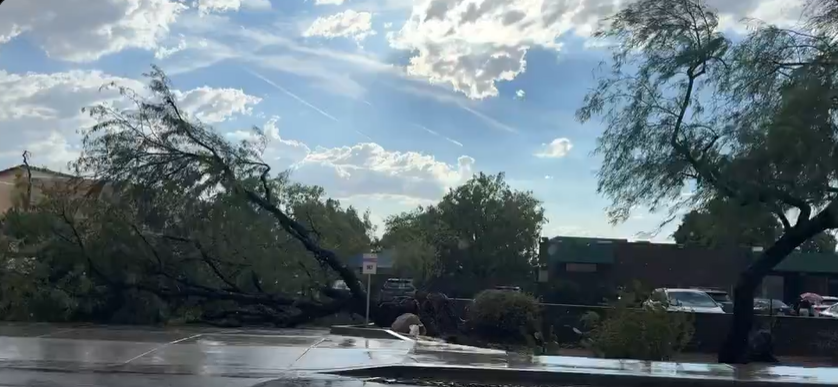
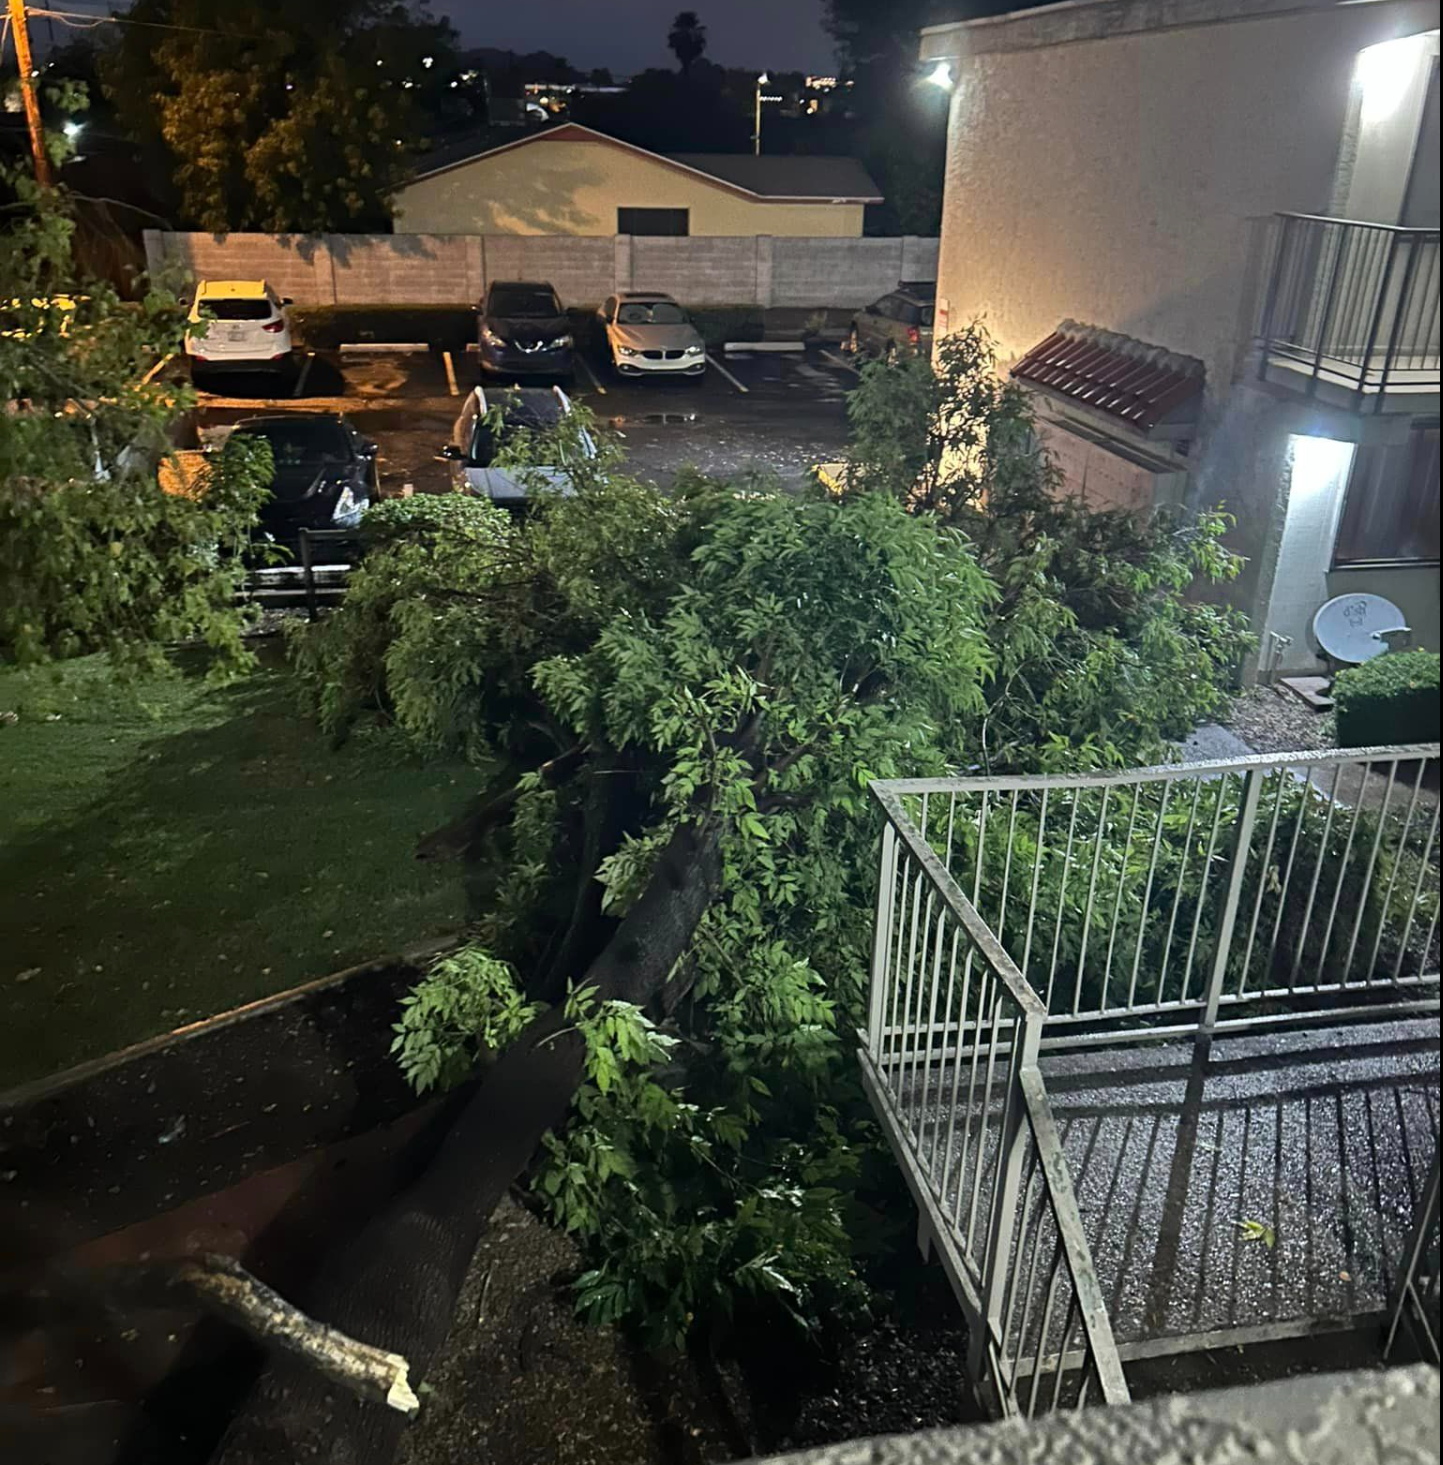
During the mid to late afternoon hours of August 22nd, several thunderstorm clusters developed across the greater Phoenix area. At approximately 4:30 pm MST, the first thunderstorm cell developed right over Phoenix Sky Harbor International Airport and very quickly produced strong downburst winds, with a 64 mph peak gust measured by the Automated Surface Observing System (ASOS) located at the south end of the airport (Figures 1-3). The thunderstorm cell then gradually moved northeastward towards the north Tempe and Scottsdale areas between 4:40-5:00 PM MST, where it intensified and produced another strong downburst signature (Figures 1-4). Reports came in shortly after of several large uprooted trees and downed power lines, resulting in several hundreds of customers losing power at one point (Figures 5-8). The thunderstorm also produced very heavy rainfall in a short amount of time, especially over the Scottsdale area, with reports of over half an inch in 30 minutes by local NWS storm spotters with minor street flooding observed from live broadcast by the local media.
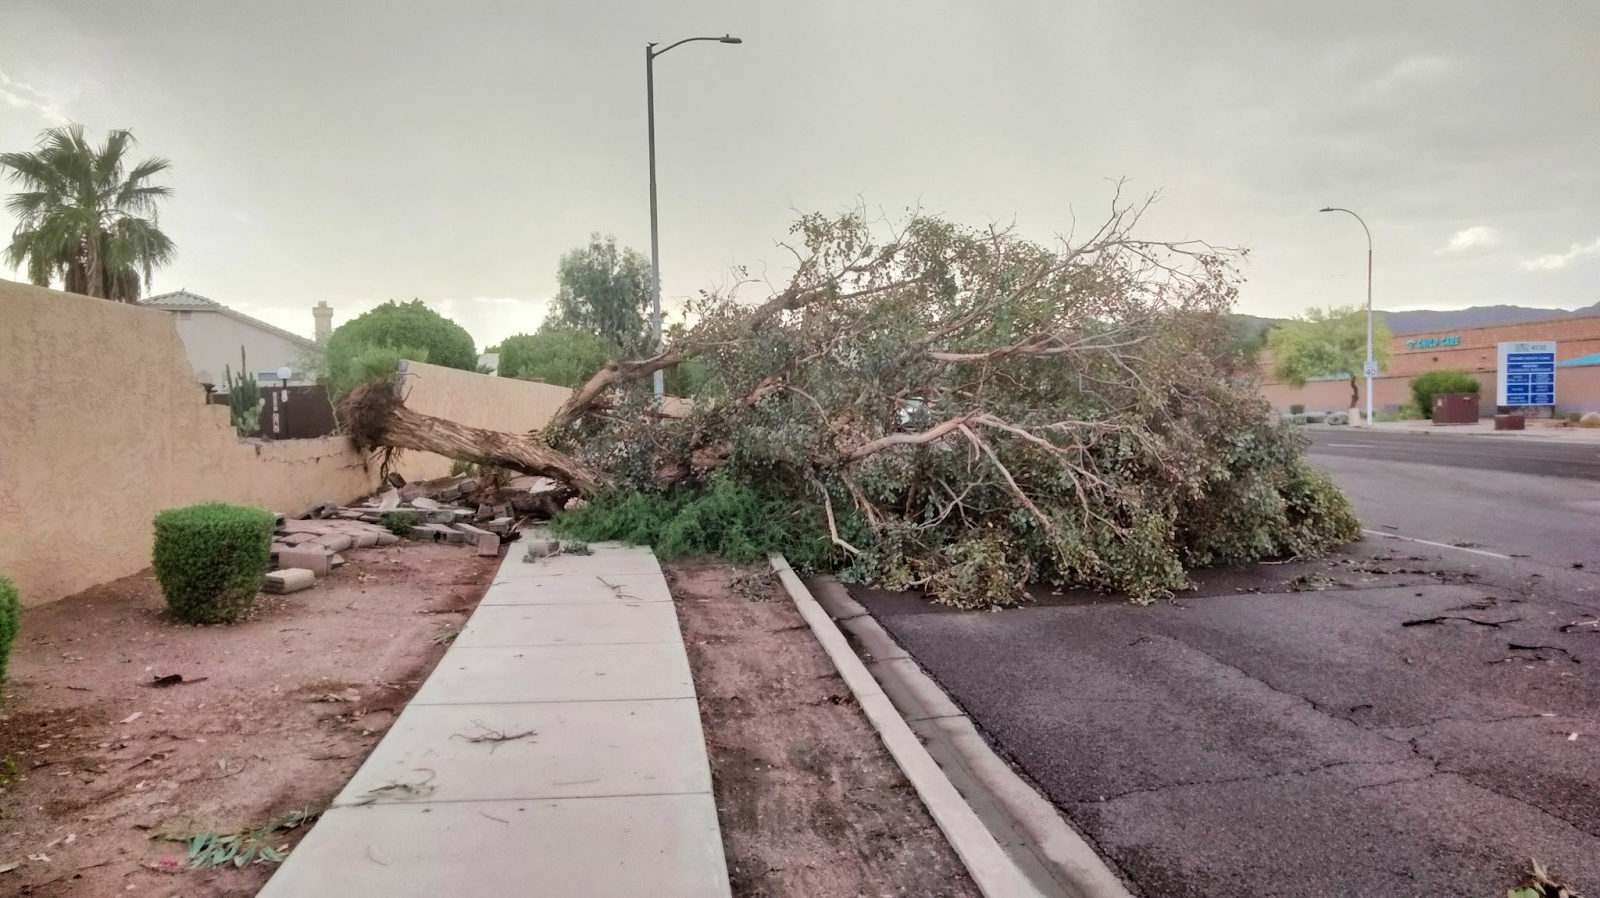
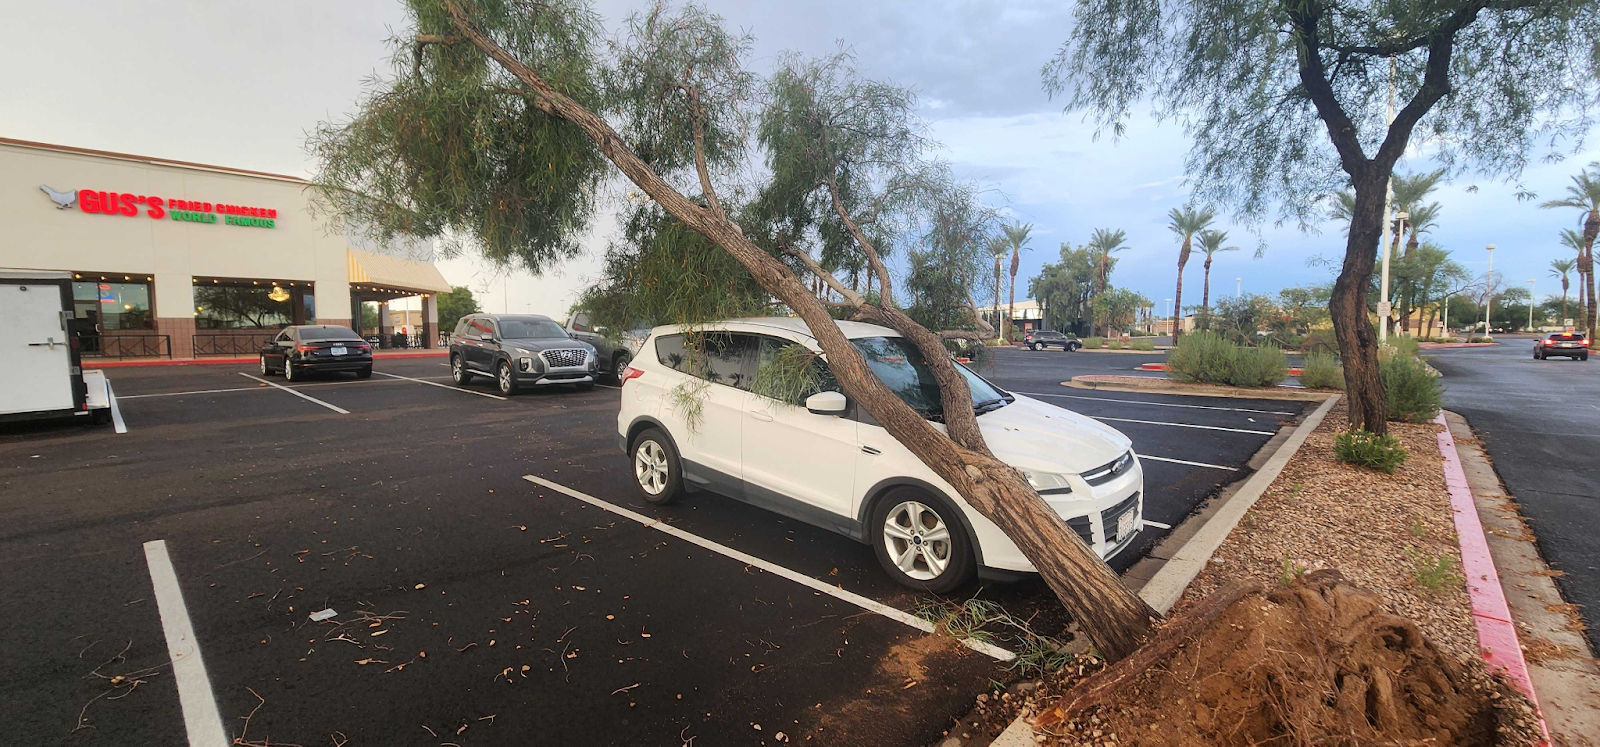
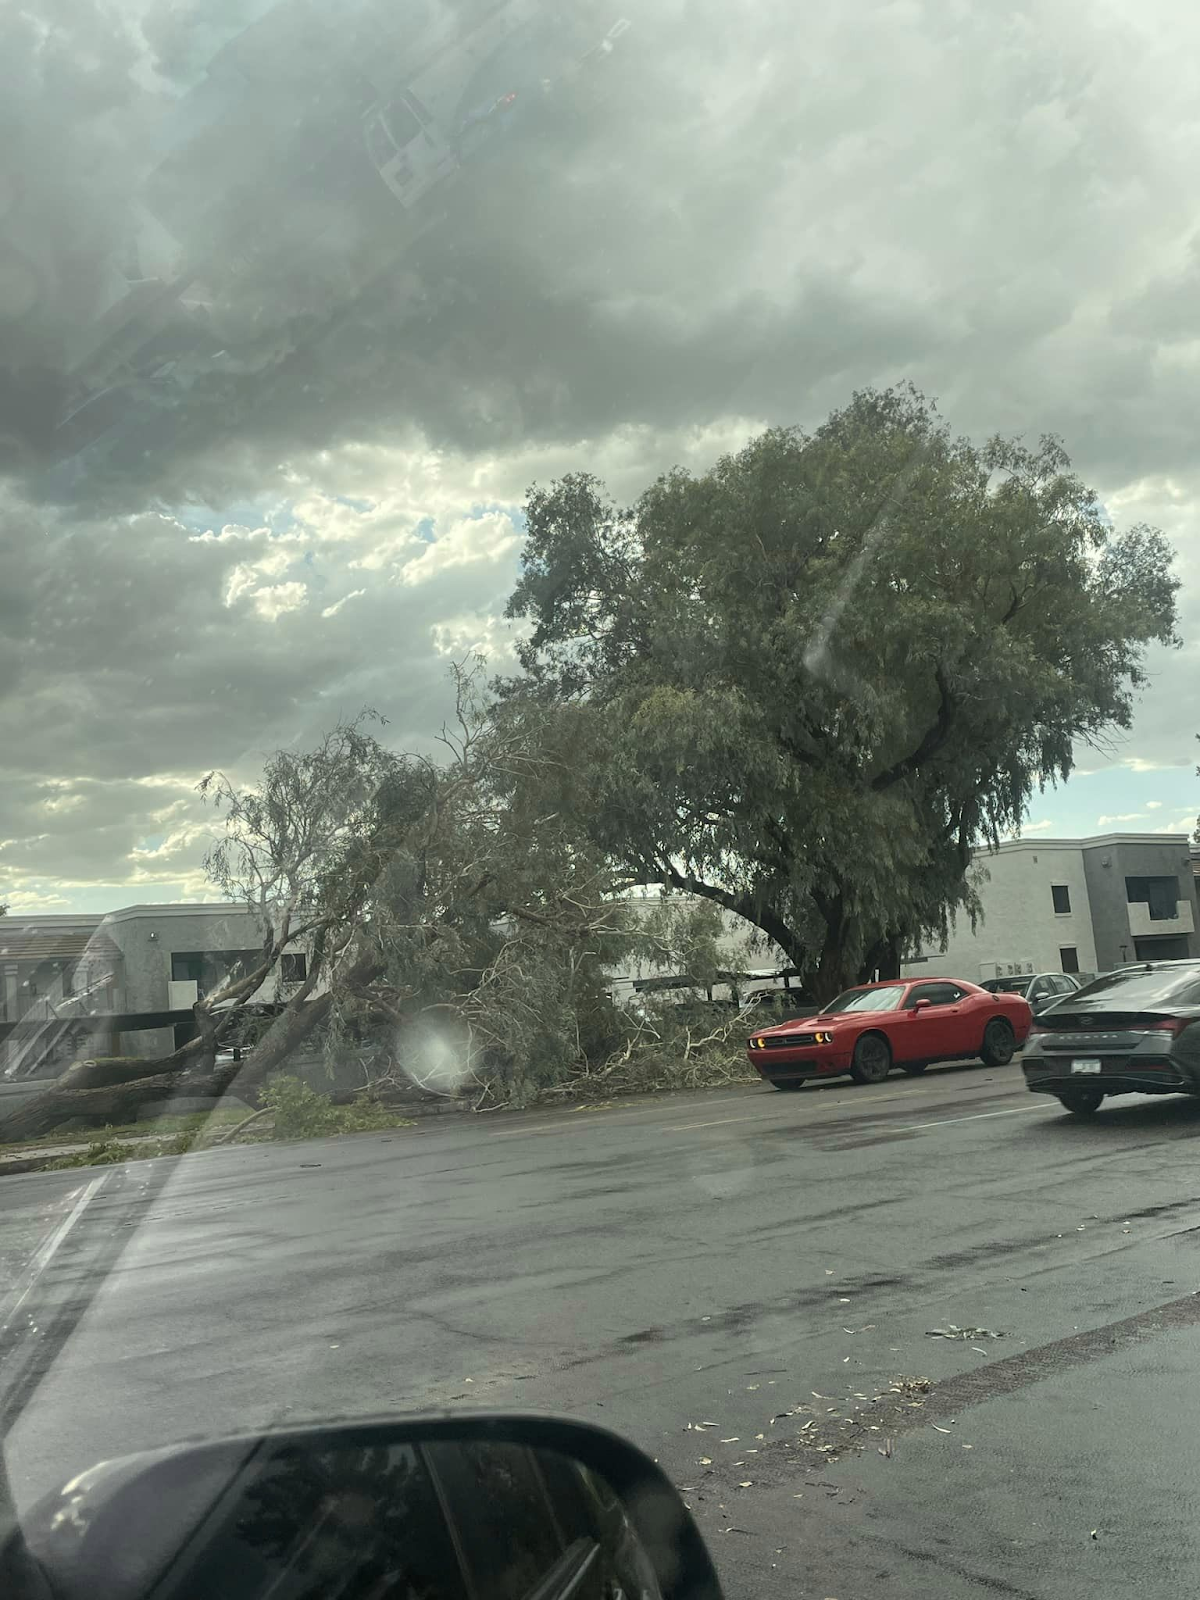
Another separate thunderstorm cell developed over the Ahwatukee Foothills at approximately 4:55 PM MST and it too produced a strong downburst signature (Figures 9-10). Damaging winds also accompanied this thunderstorm with reports coming in shortly after of several large uprooted trees causing damage to light posts, vehicles, and concrete fencing structures (Figures 11-14).
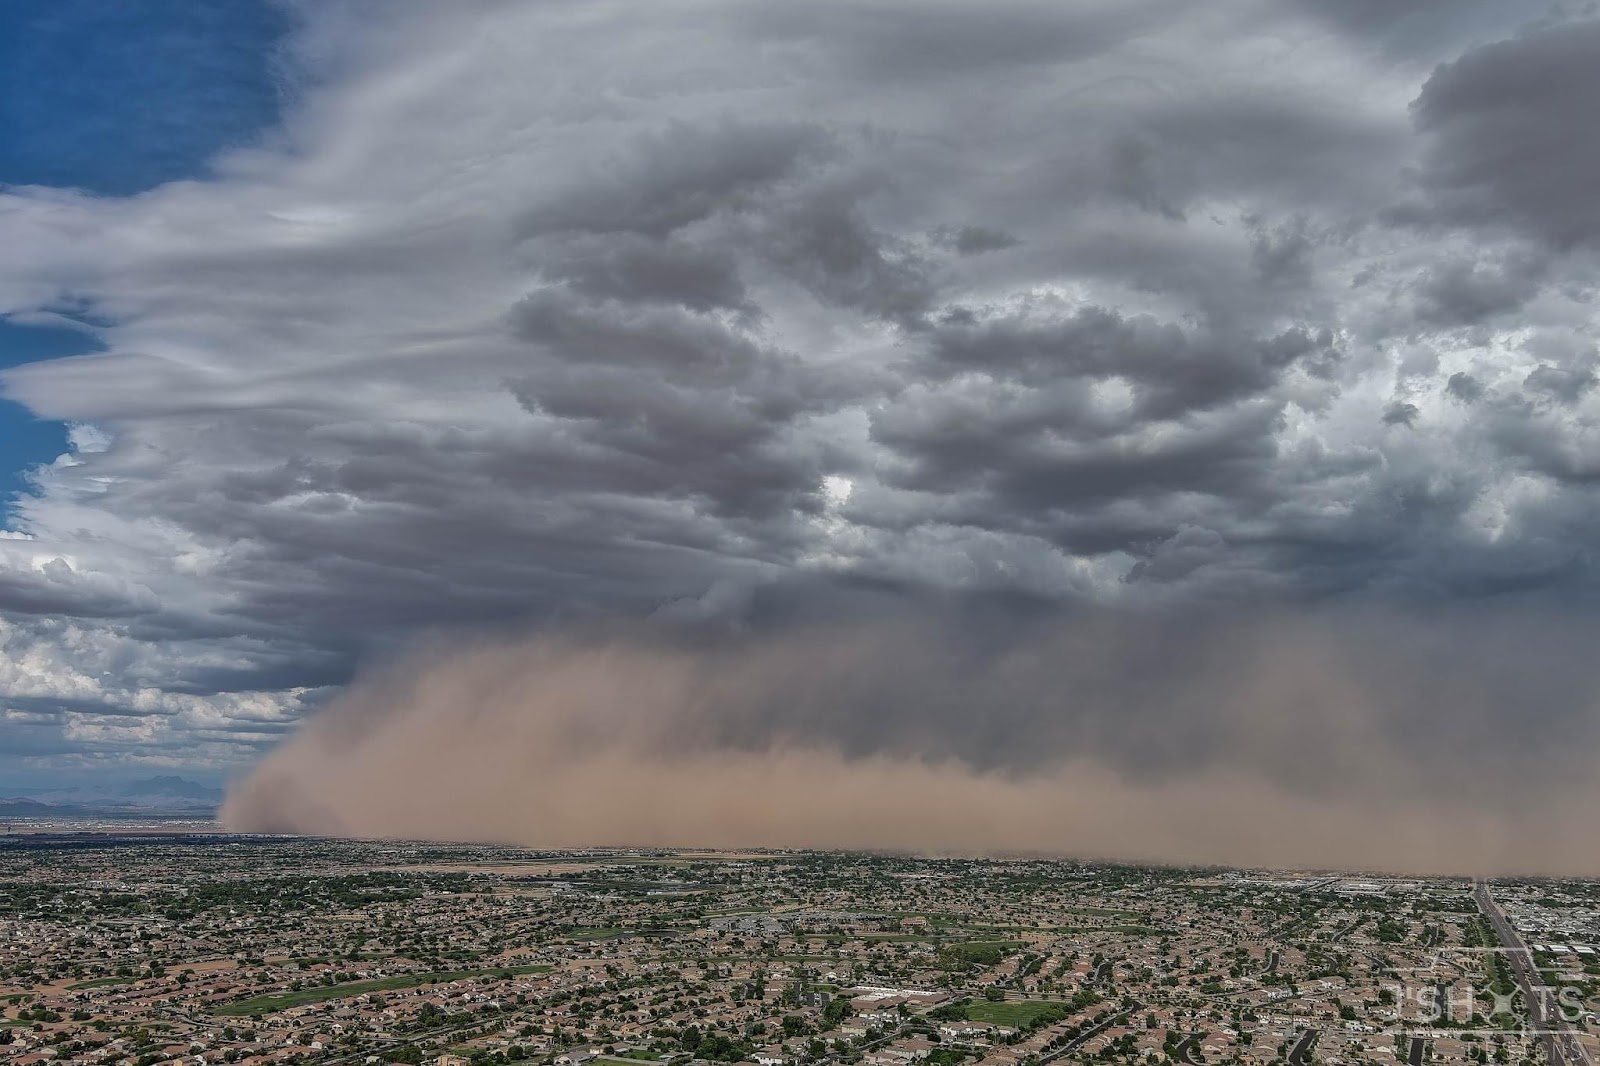
Before the thunderstorm activity initiated over the Phoenix area, a complex of storms that developed earlier in the afternoon over Pinal County sent a strong outflow boundary northwestward towards the East Valley of Phoenix (Figure 15). The outflow boundary, which carried wind gusts in excess of 50 mph, produced a large dust storm reducing visibilities to as low as a quarter of a mile in some locations (Figures 16-17).
Fig. 1-2: TPHX Doppler Radar Reflectivity (left) and Velocity (Right) loop from 4:19 PM to 5:09 PM MST on August 22, 2024, showing the thunderstorm cell that affected Phoenix Sky Harbor International Airport and areas northeast through north Tempe and Scottsdale with multiple downburst signatures. In the velocity field, the green colors indicate inbound velocities (winds moving towards the radar) and the red colors indicate outbound velocities (winds moving away from the radar)
Fig. 3: Time lapse video looking eastward from Downtown Phoenix towards the thunderstorm cell that produced a series of downbursts that affected Phoenix Sky Harbor Airport as well as areas further north and east of the airport. Video footage taken by an NWS Phoenix Meteorologist.
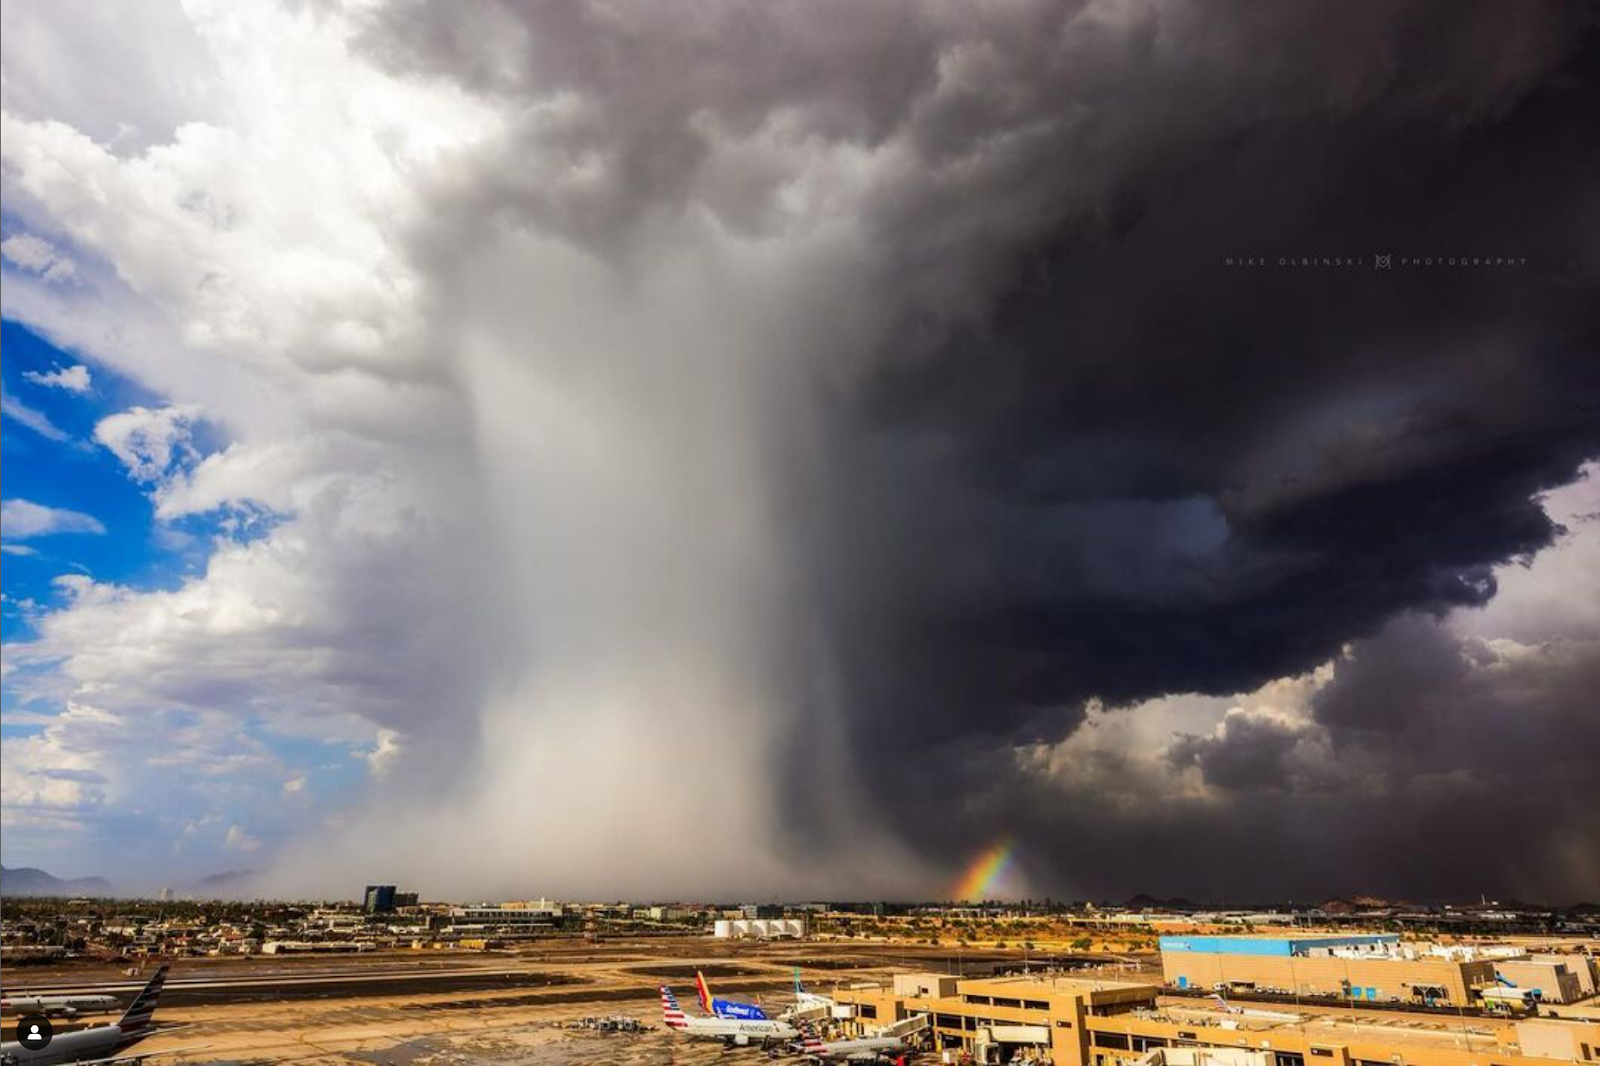
Fig. 4: Another visual view of the downburst as the thunderstorm cell was moving northeast of Phoenix Sky Harbor Airport towards the north Temple and Scottsdale areas. Visual view captured by Storm Chaser Mike Oblinski
 |
 |
 |
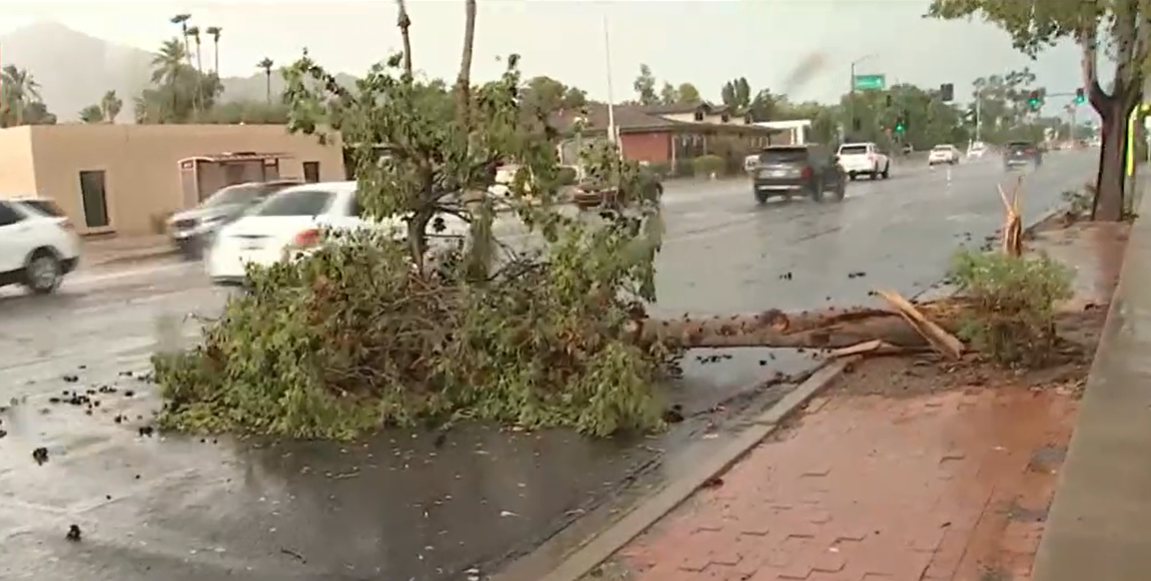 |
Fig. 5-8: Images of the wind damage in Scottsdale and North Tempe. Image location and sources (clockwise from top-left): Large uprooted tree that damaged the roof of a home located near the area 60th St. and Vernon Ave. in Scottsdale (Marissa Sarbak); Mesquite tree down near the area of 52nd St. and Thomas Rd. in Scottsdale (Christine Stanwood); Snapped tree fell onto Indian School Road in Scottsdale (AZFamily); Large uprooted tree in an apartment complex located near the area of North Priest Drive and Loop 202 in Tempe (Tonya Burrtan)
Fig. 9-10: KIWA Doppler Radar Reflectivity (left) and Velocity (Right) loop from 4:46 PM to 5:15 PM MST on August 22, 2024, showing the thunderstorm cell that developed over the Ahwatukee area with a downburst signature noted. In the velocity field, the green colors indicate inbound velocities (winds moving towards the radar) and the red colors indicate outbound velocities (winds moving away from the radar).
 |
 |
 |
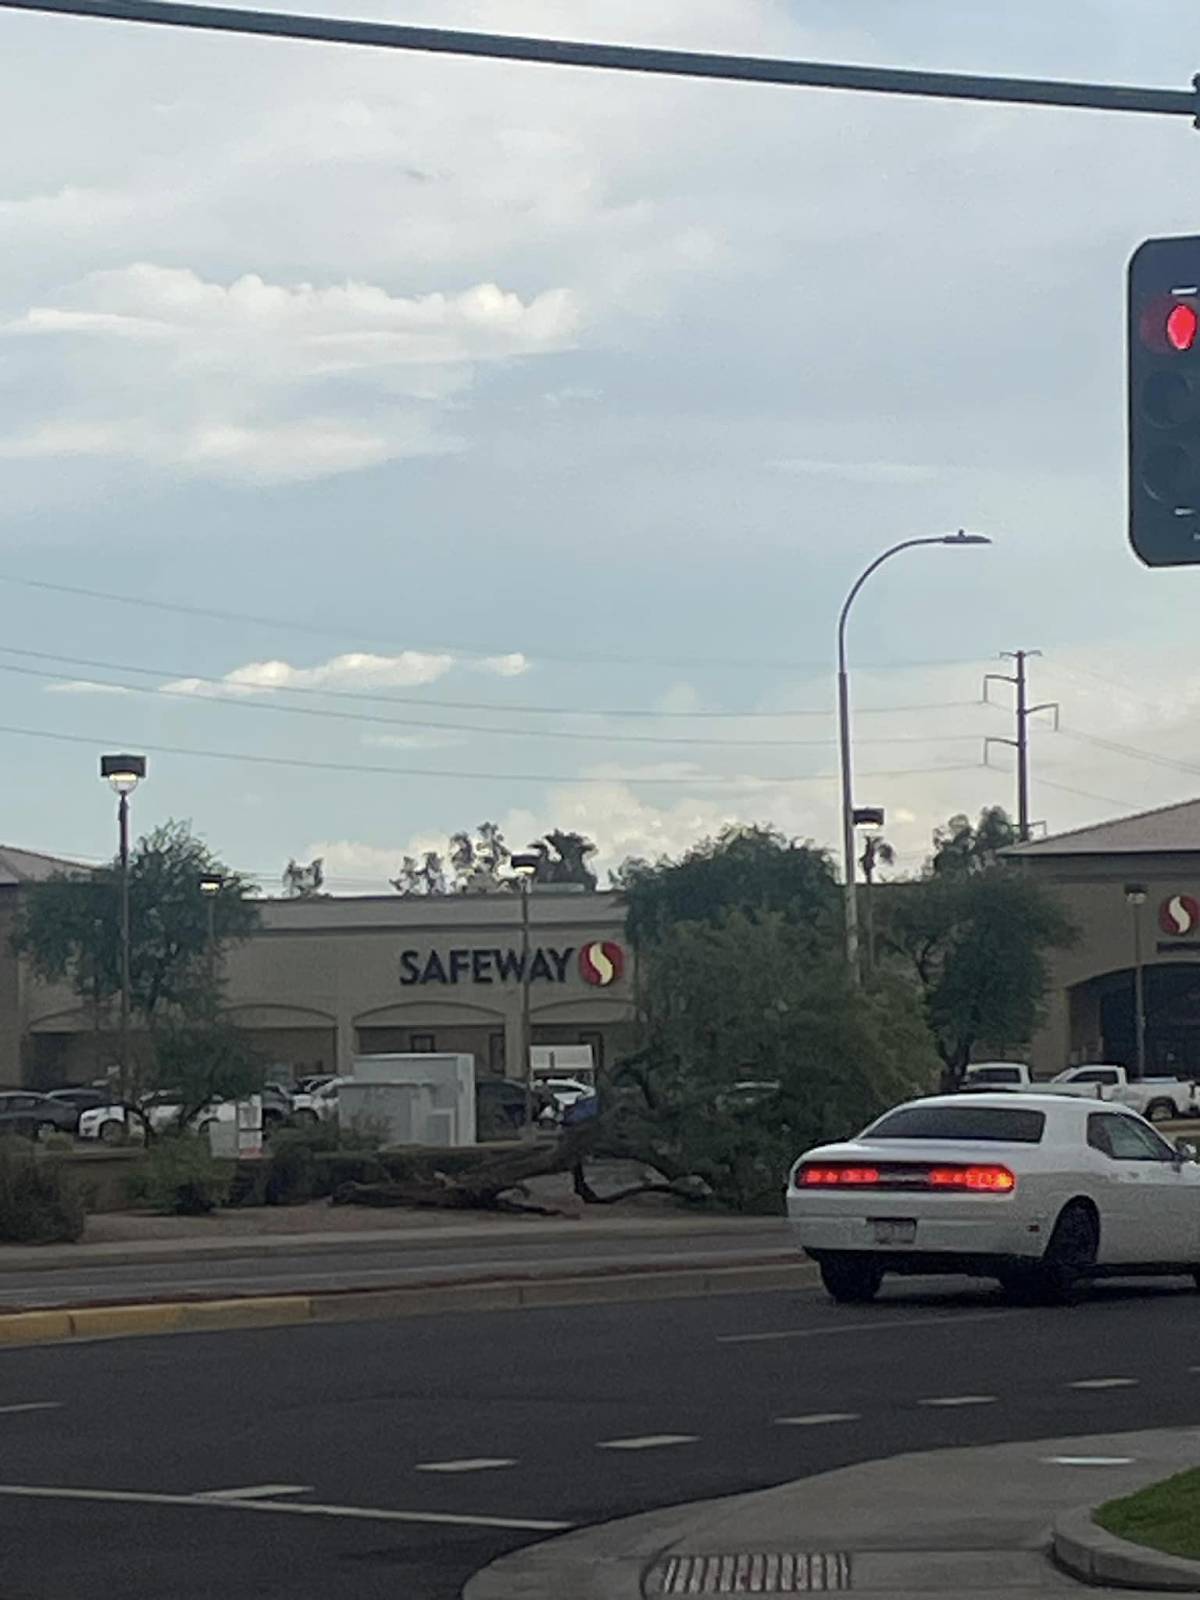 |
Fig. 11-14: Images of the wind damage in the Ahwatukee area. Image location and sources (clockwise from top-left): Large uprooted tree that destroyed part of a concrete wall along Ray Rd. between 46th and 48th St. (Jorge Torres); Uprooted Tree that fell onto a car in the area of Ray Rd. and 48th St. (Michael Drapkin); Large uprooted tree in the area of 48th St. and Elliot Rd. (Elyse Newman); Large uprooted tree in the area of 48th St. and Elliot Rd. (Elyse Newman)
Fig. 15: KIWA Doppler Velocity loop from 4:08 PM to 4:40 PM MST on August 22, 2024, showing a strong outflow boundary pushing through eastern portions of the Phoenix Metro area. In the velocity field, the green Colors indicate inbound velocities (winds moving towards the radar) and the red colors indicate outbound velocities (winds moving away from the radar)
 |
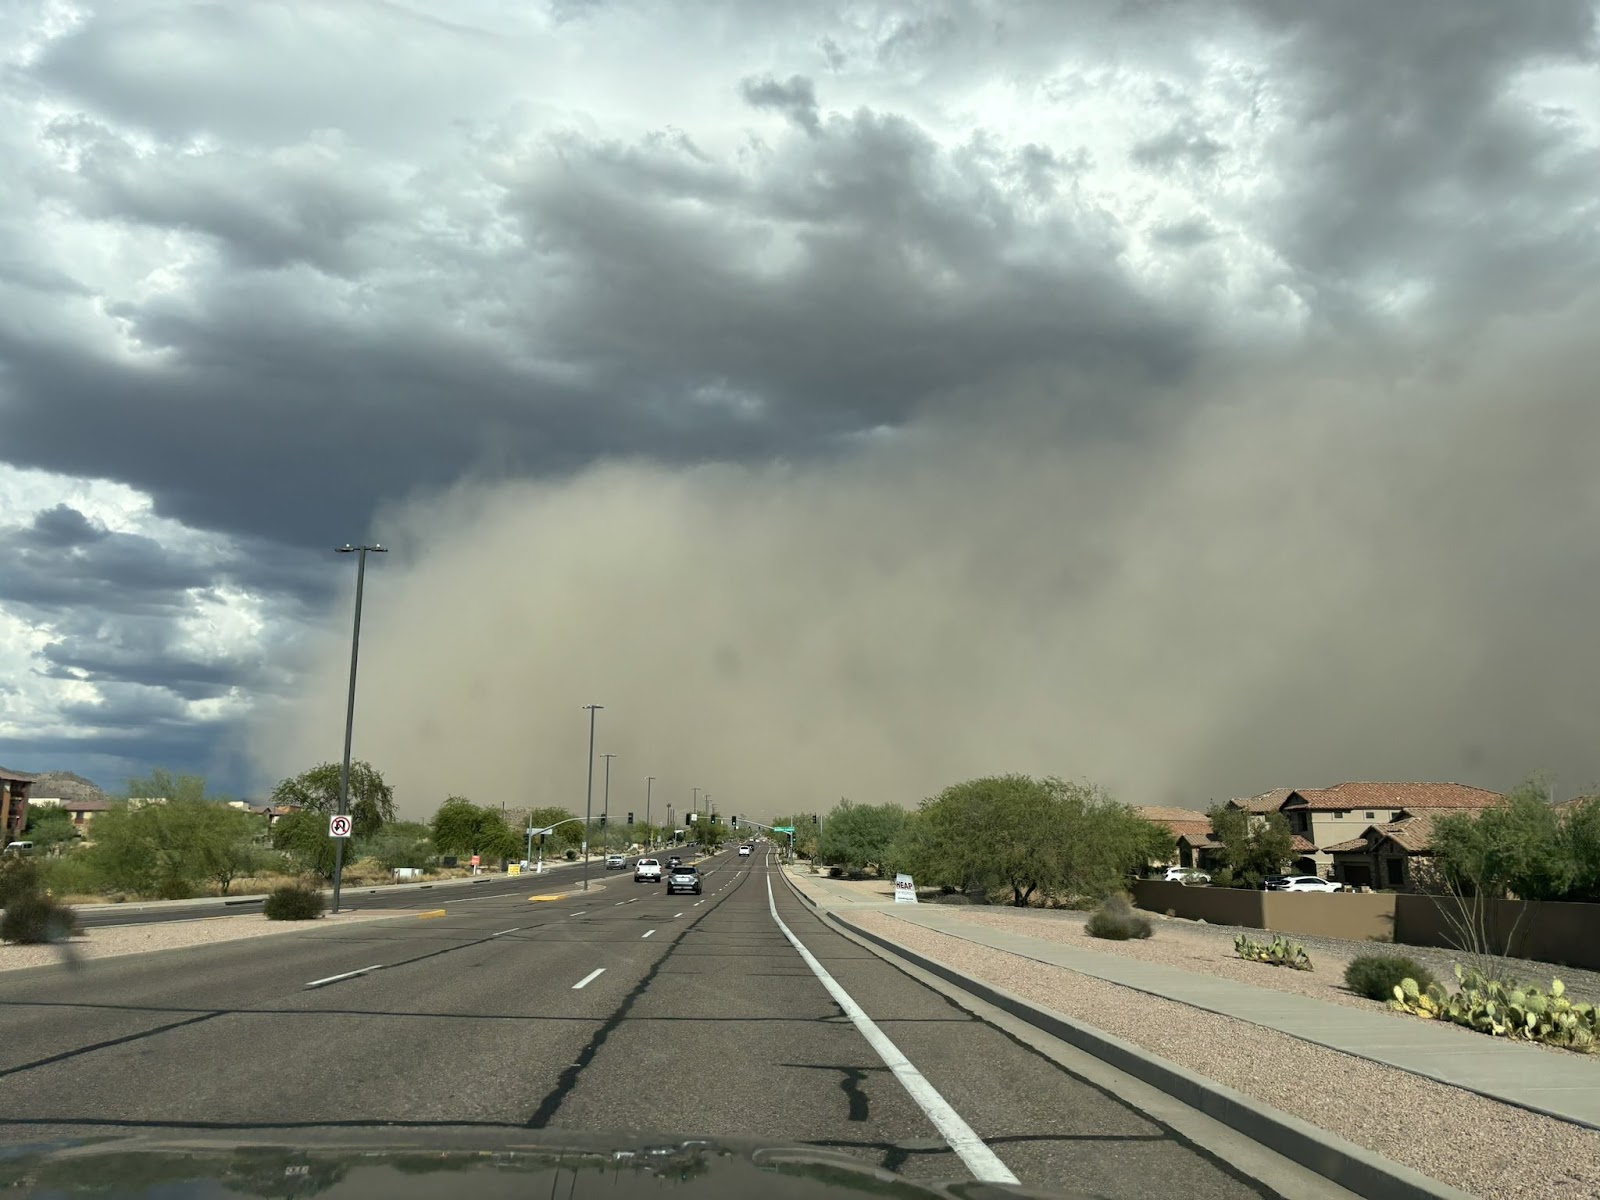 |
Fig. 16-17: (Left) Aerial photo of a large dust storm rolling through the East Valley of Phoenix. Image by Jason Morrow; (Right) Street level view of an approaching dust storm in Mesa, AZ. Photo taken by Matthew Pace.
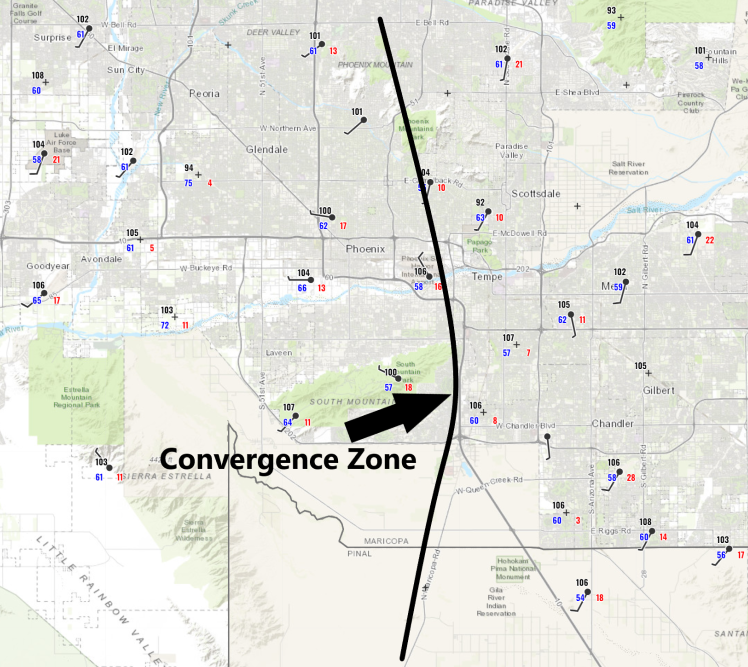
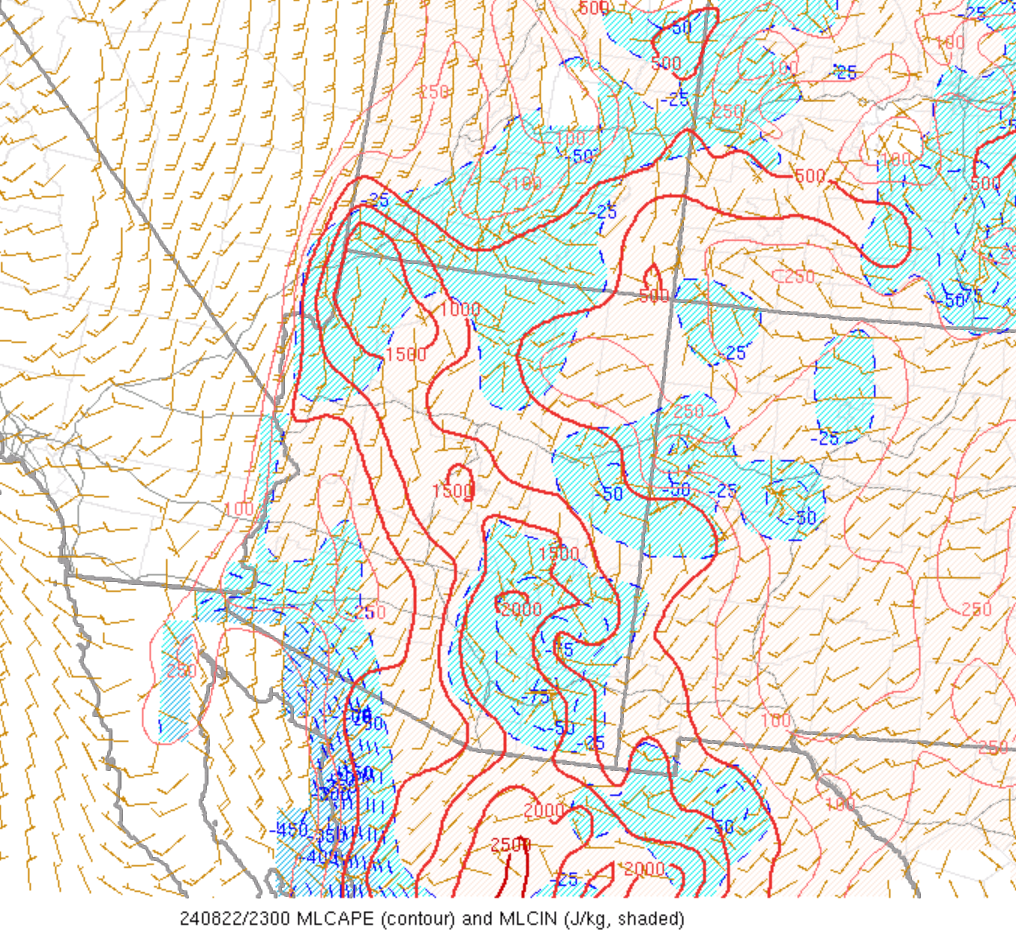
Storm Environment: The overall environment that these thunderstorms developed under is something that is very typical of a normal monsoon day. Instability values were on the moderate side with the Mixed-Layer Convective Available Potential Energy (MLCAPE) averaging at around 1000 J/KG along with near zero convective inhibition (CIN), which is a metric used to measure the amount of resistance to rising motion (Figure 18). The Downdraft Convective Available Potential Energy (DCAPE), which is a metric used to measure the potential strength for rain-cooled downdraft air, was on the high side averaging around 1500 J/KG, and thus the potential for damaging wind gusts was elevated (Figure 19). Even though there was a noticeable lack of dynamical forcing for ascent, with the convective inhibition nearly absent and with strong daytime heating, it did not take that much of a triggering mechanism for convective initiation. That triggering mechanism likely came in the form of surface convergence, which is one form to get air to rise. This was observed according to the surface observations taken at 4 PM MST, shortly before the first thunderstorm cell developed (Figure 20).
 |
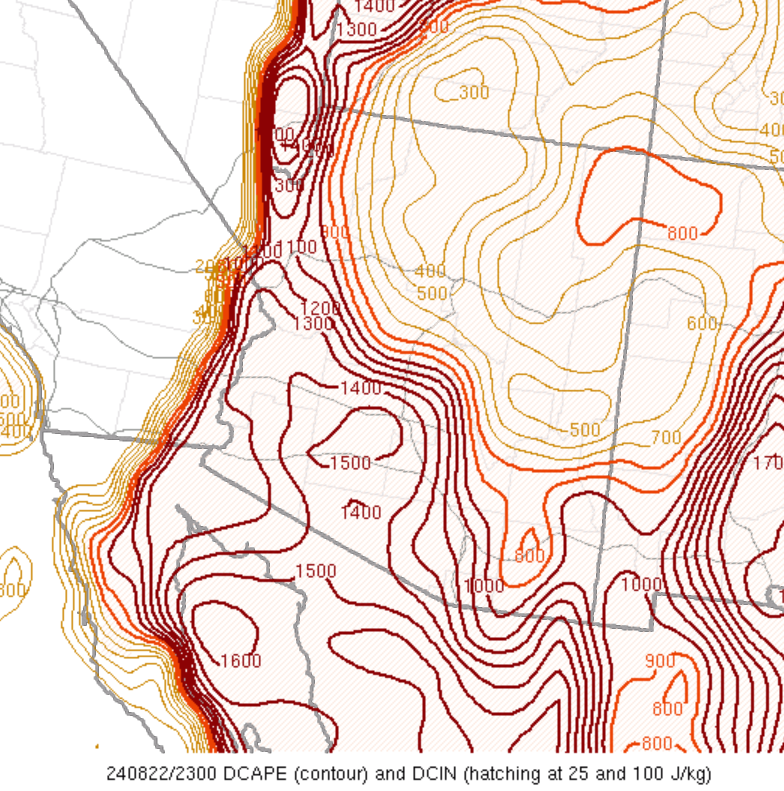 |
Fig. 18-19: Objective analysis fields at 4 PM MST August 22, 2024: (Left) Mixed Layer Convective Available Potential Energy (MLCAPE) and Mixed Layer Convective Inhibition (MLCIN); (Right) Downdraft Convective Available Potential Energy (DCAPE)
Fig. 20: Surface observations taken at 4 PM MST on August 22, 2024, right before thunderstorm initiation. Note the surface convergence occurring in the Phoenix area with westerly winds in the central and western sections of the Phoenix area and more southerly winds near the Scottsdale, Temple, Mesa, and Chandler areas.