
Numerous severe thunderstorms are expected across a broad region from the Ohio Valley to the Mid-Atlantic and Northeast States today into tonight. Swaths of damaging wind gusts are expected and some tornadoes are possible. Bertha is expected to bring tropical storm conditions to portions of the Gulf Coast from the Florida Panhandle westward to southeastern Louisiana later today and Wednesday. Read More >
Overview
|
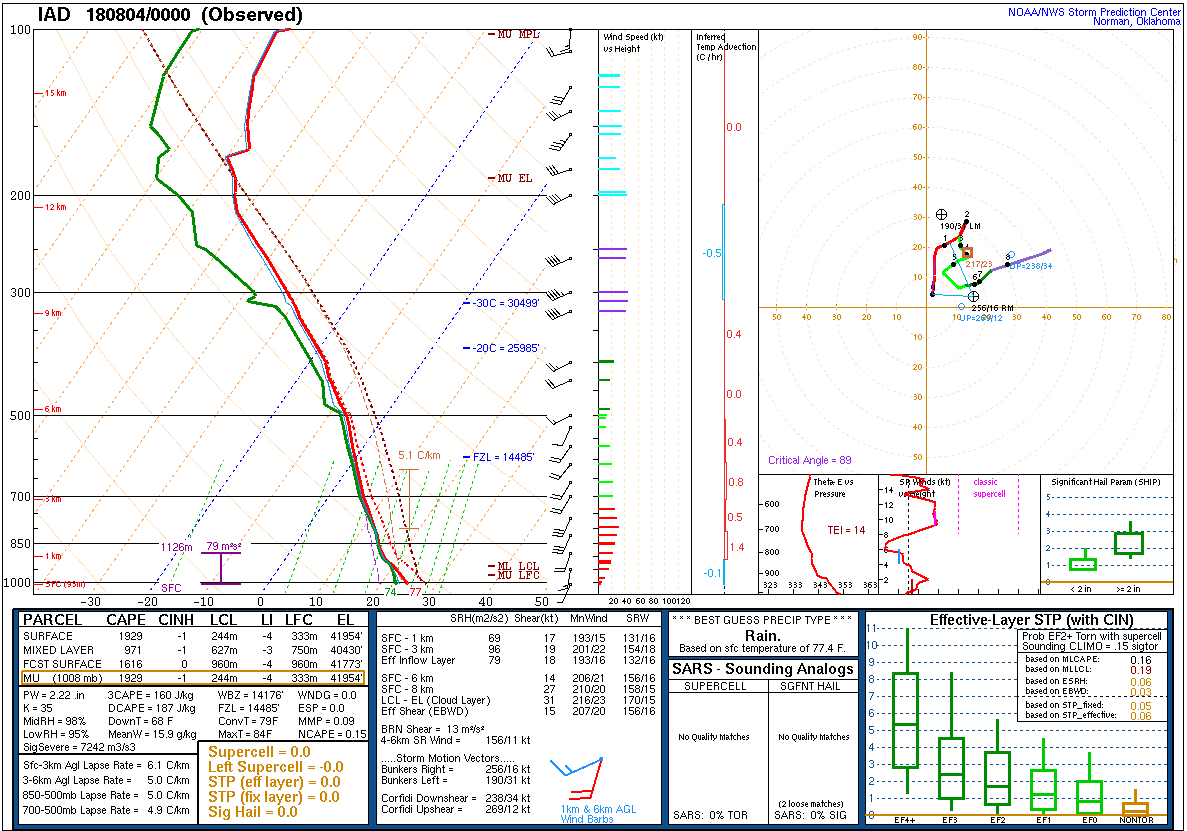
A surface trough developed in eastern Pennsylvania southwestward through central Virginia on 3 August 2018. In advance of the trough, a long fetch of anomalously moist air was transported northward to the west of a strong ridge of high pressure in the western Atlantic. With the aid of a shortwave trough approaching the region, convection developed near the trough axis during the evening and continued to regenerate on the southwest side as the predecessor storms moved northeastward. As the storms continued to train over Berks County northeastward through the Lehigh Valley into northern New Jersey, a swath of 2-5+ inches of rainfall accumulated in this corridor by daybreak. Several reports of flooding were received, especially from Berks, Lehigh, and Northampton Counties. During the morning, the axis of convection moved northeastward into more urban portions of northern and central New Jersey. Though rainfall amounts were lower in these areas, flash flooding occurred owing to the high rain rates combined with the rapid runoff from increased urbanization. |
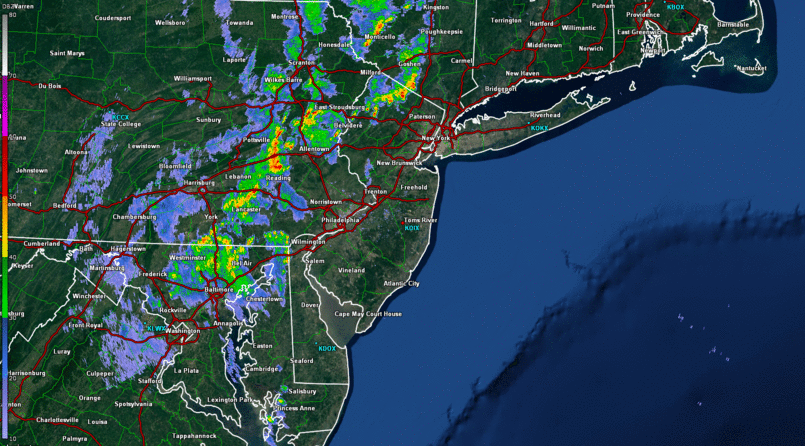 Radar Reflectivity Animation for the Event (via GR2Analyst) |
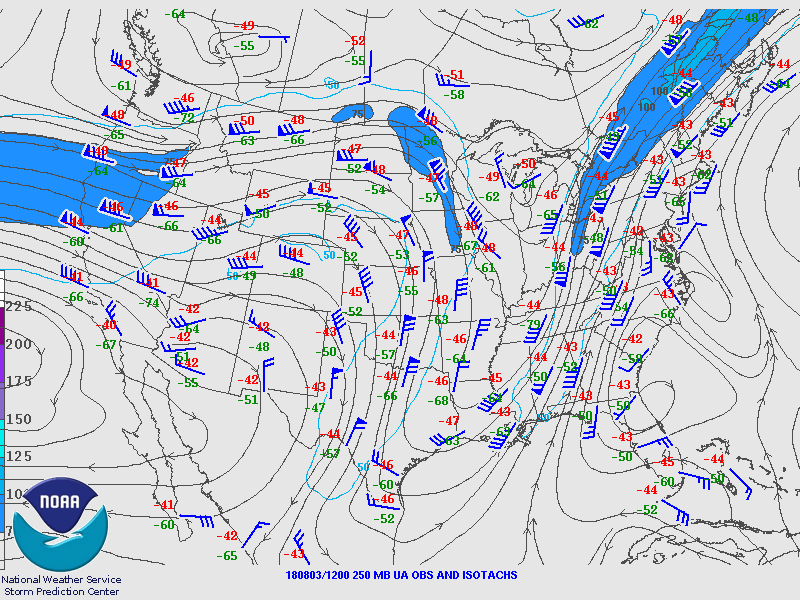
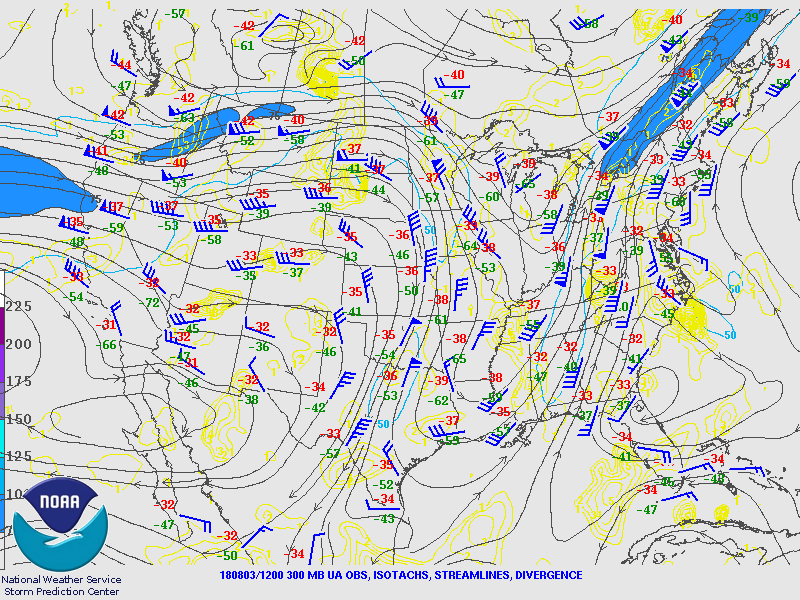
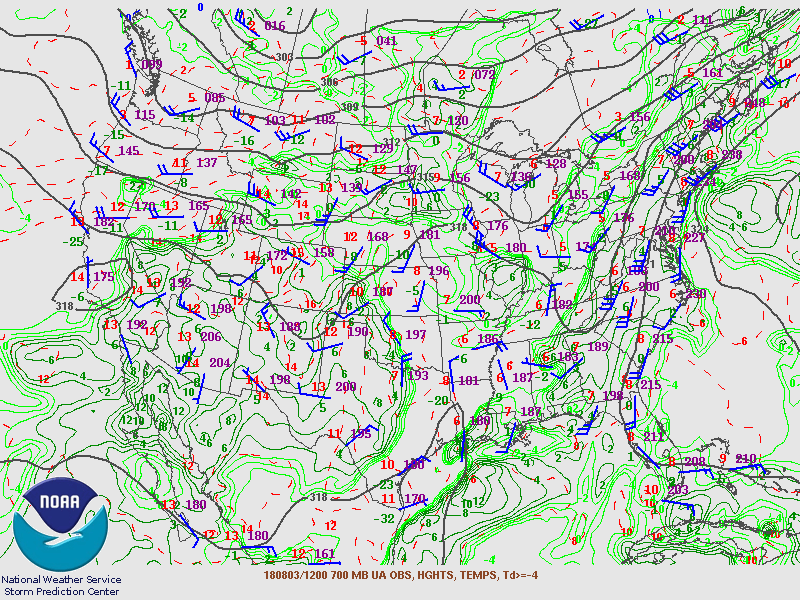
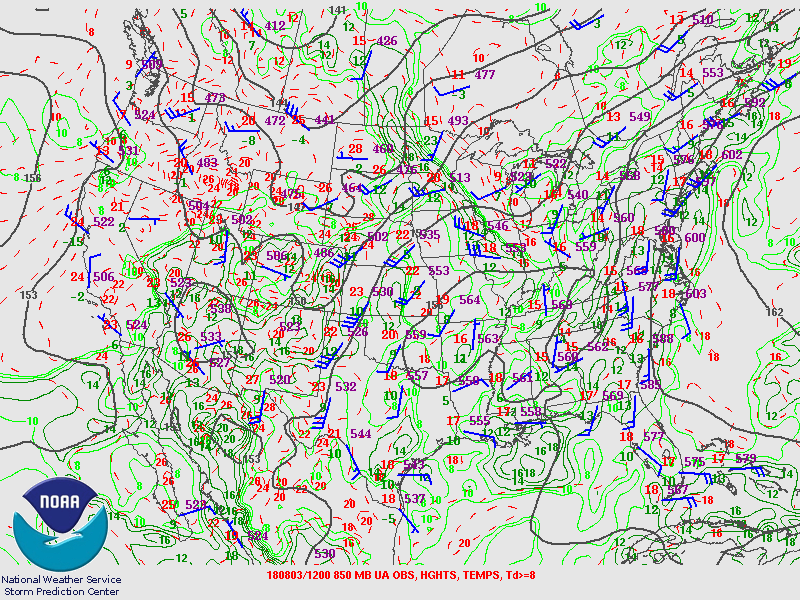
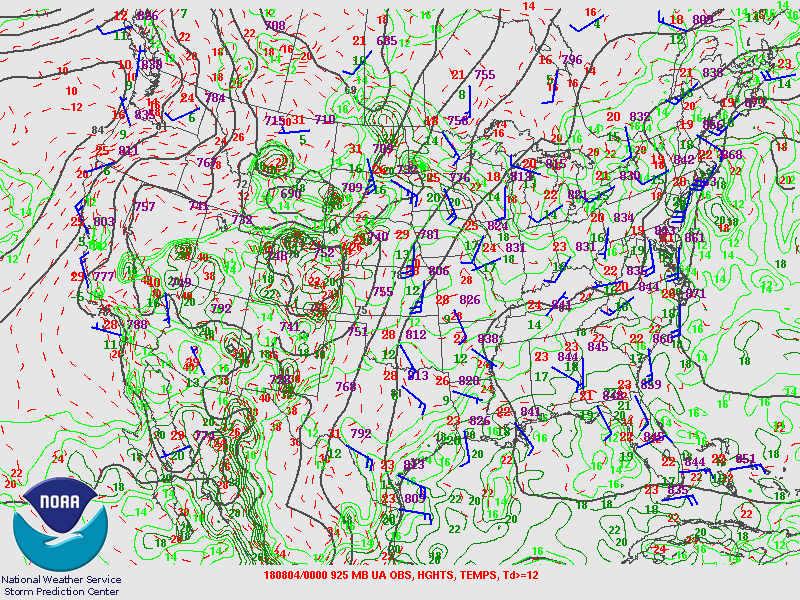
Synoptic Overview at 12z 3 Aug 2018 (courtesy of SPC)
 |
 |
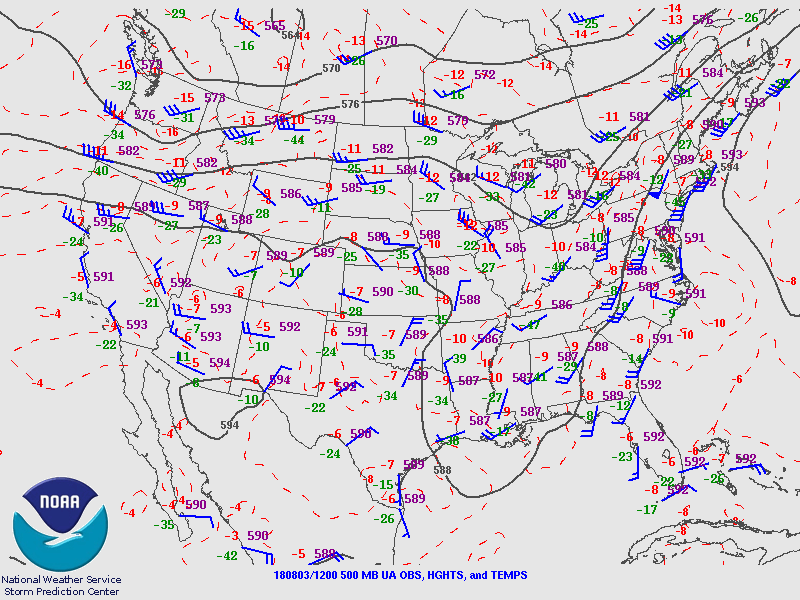 |
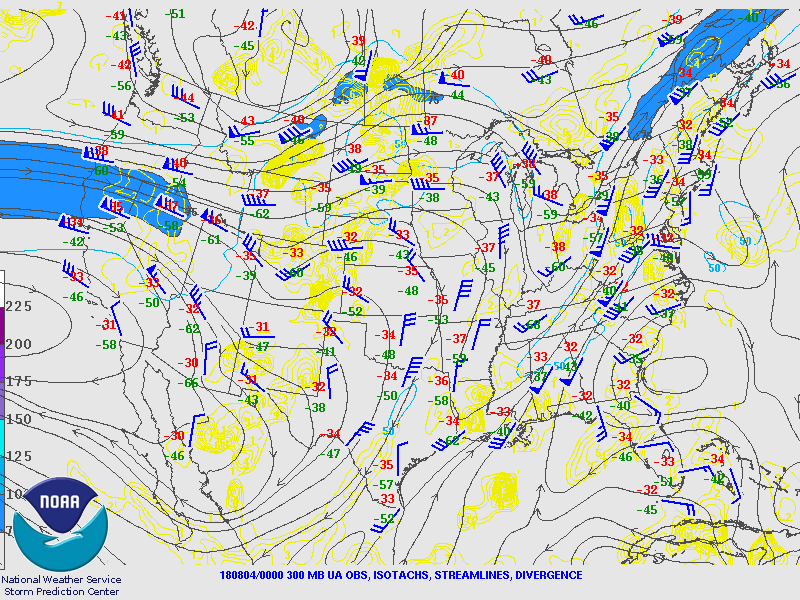
| Figure 1: 250-mb analysis | Figure 2: 300-mb analysis | Figure 3: 500-mb analysis |
 |
 |
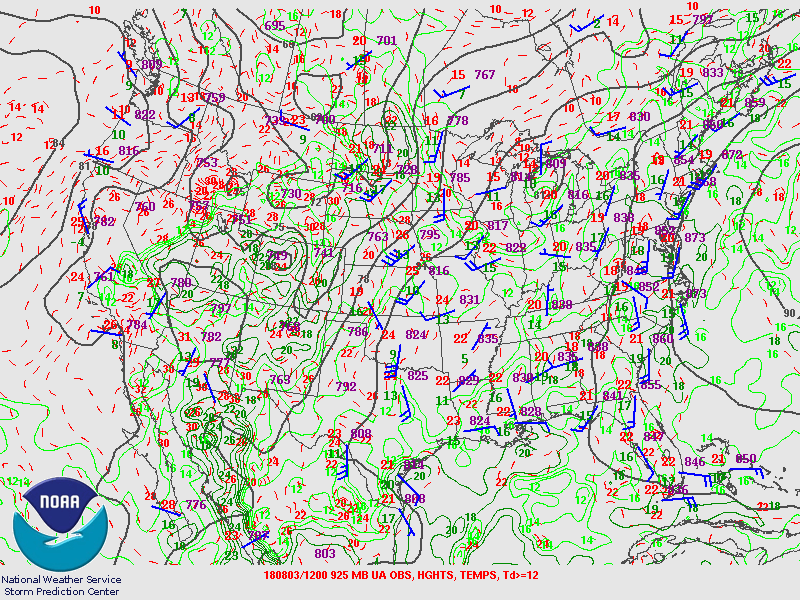 |
| Figure 4: 700-mb analysis | Figure 5: 850-mb analysis | Figure 6: 925-mb analysis |
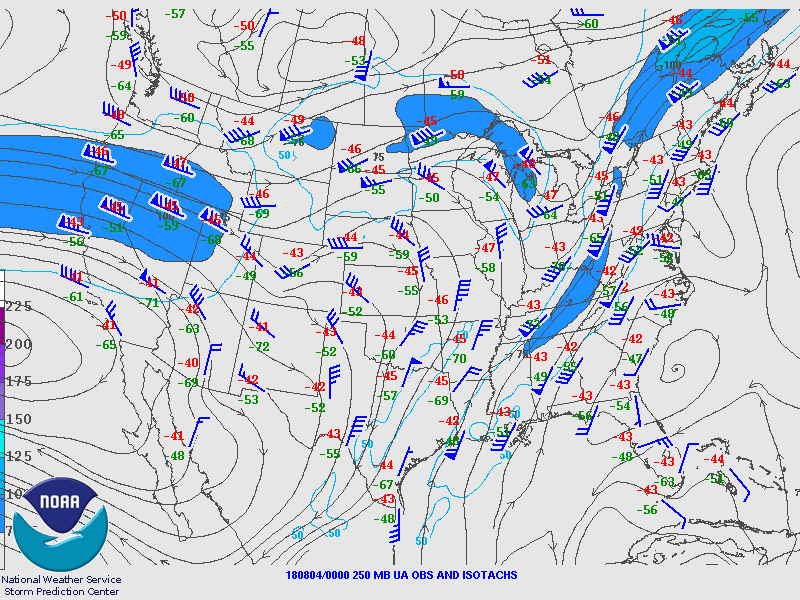
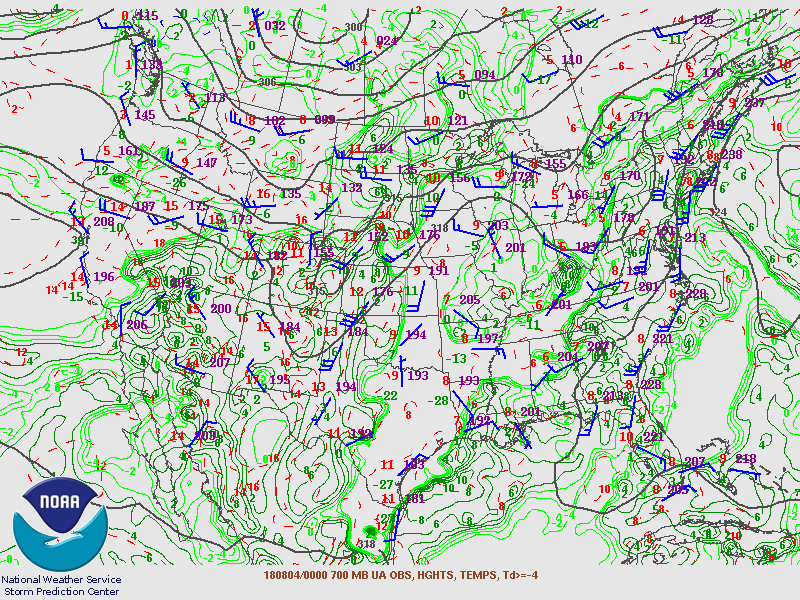
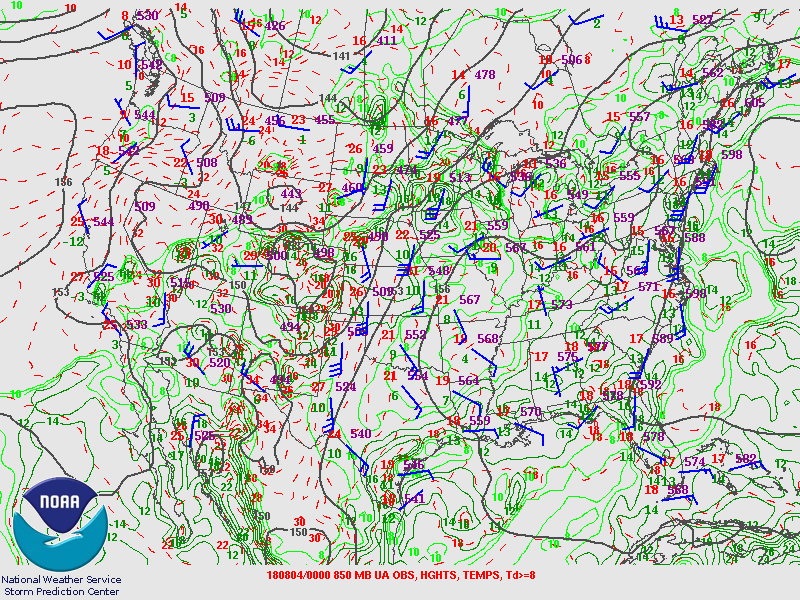
Synoptic Overview at 00z 4 Aug 2018 (courtesy of SPC)
 |
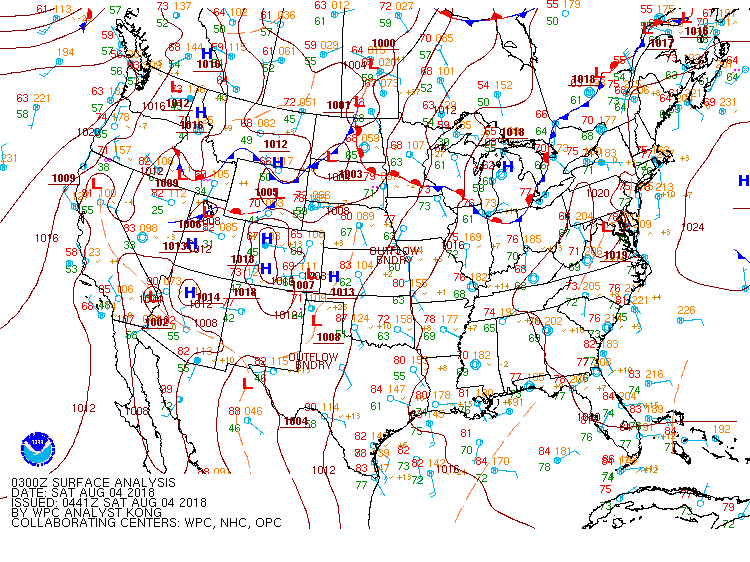
 |
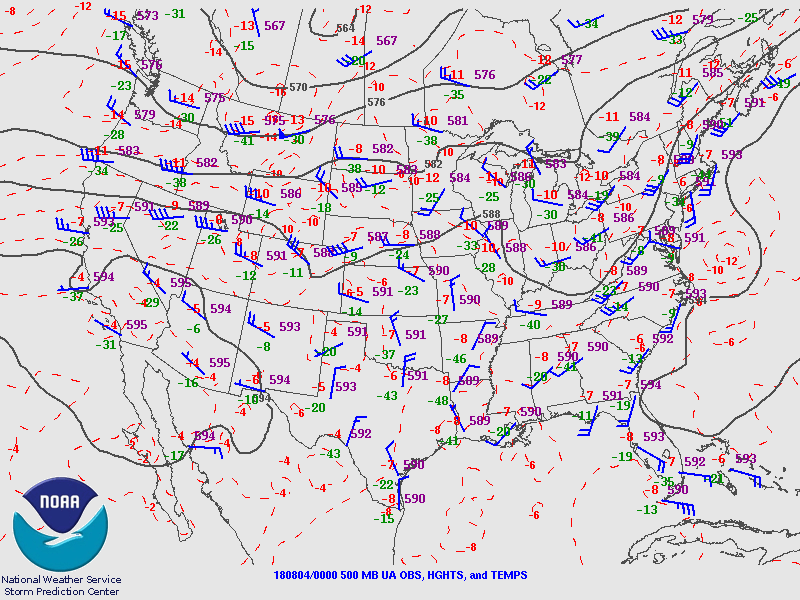 |
| Figure 7: 250-mb analysis | Figure 8: 300-mb analysis | Figure 9: 500-mb analysis |
 |
 |
 |
| Figure 10: 700-mb analysis | Figure 11: 850-mb analysis | Figure 12: 925-mb analysis |
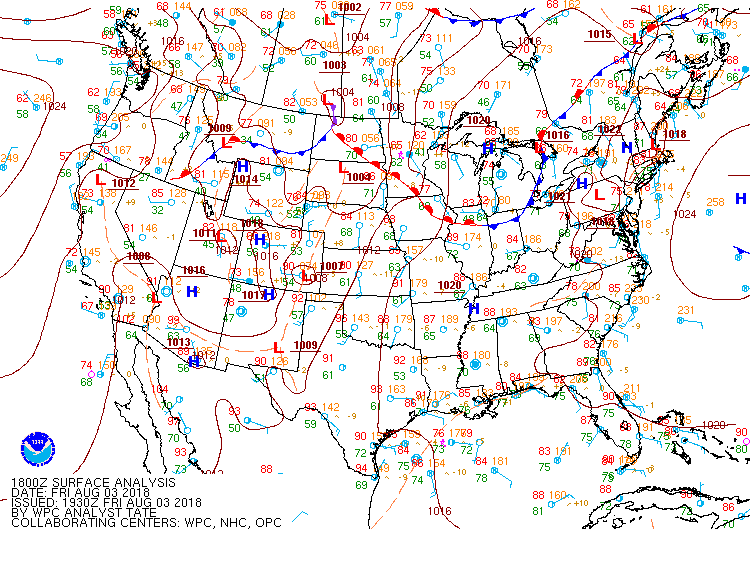
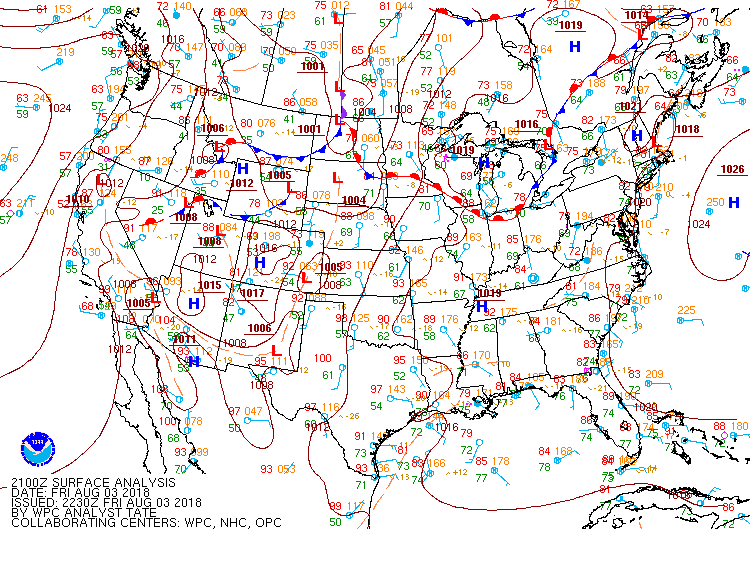
Surface Maps (courtesy of WPC)
 |
 |
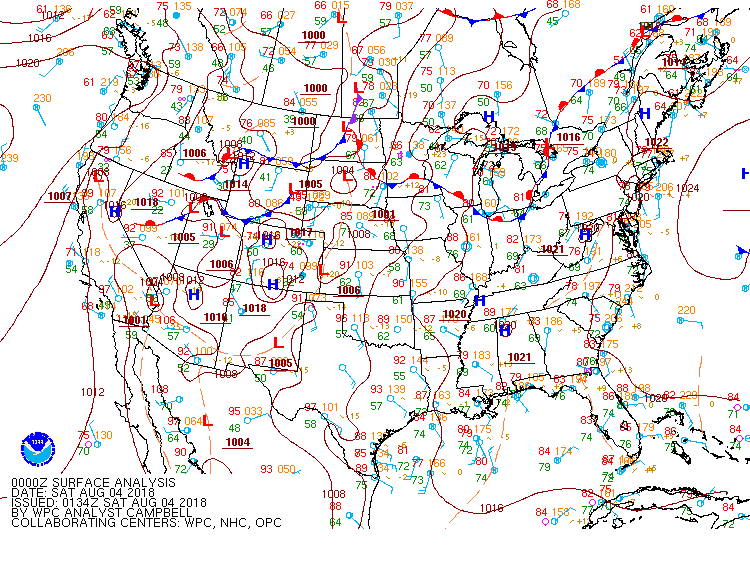 |
| Figure 13: 18z surface map | Figure 14: 21z surface map | Figure 15: 00z surface map |
 |
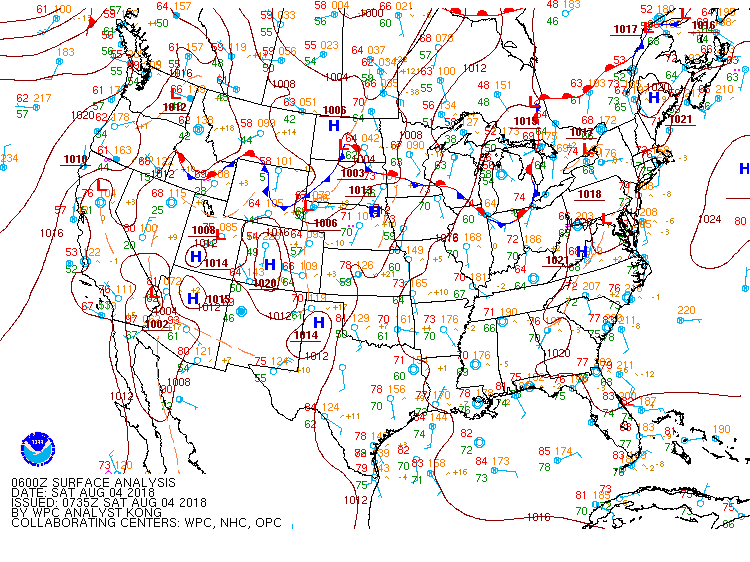 |
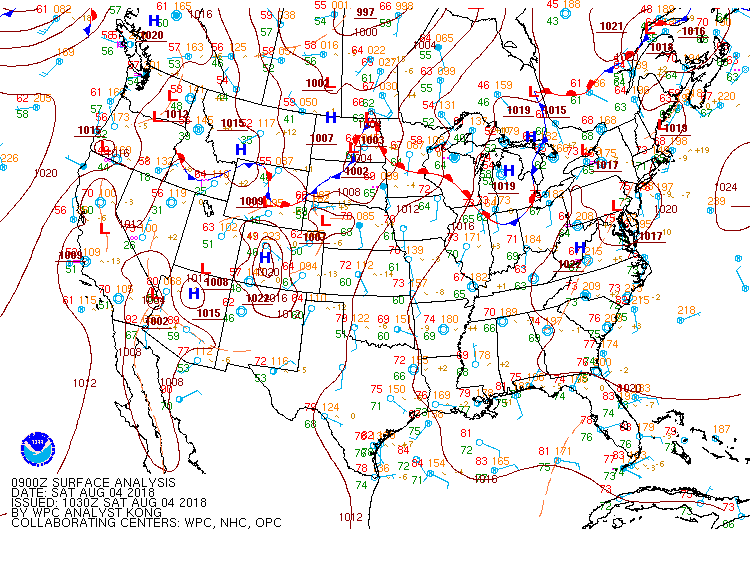 |
| Figure 16: 03z surface map | Figure 17: 06z surface map | Figure 18: 09z surface map |
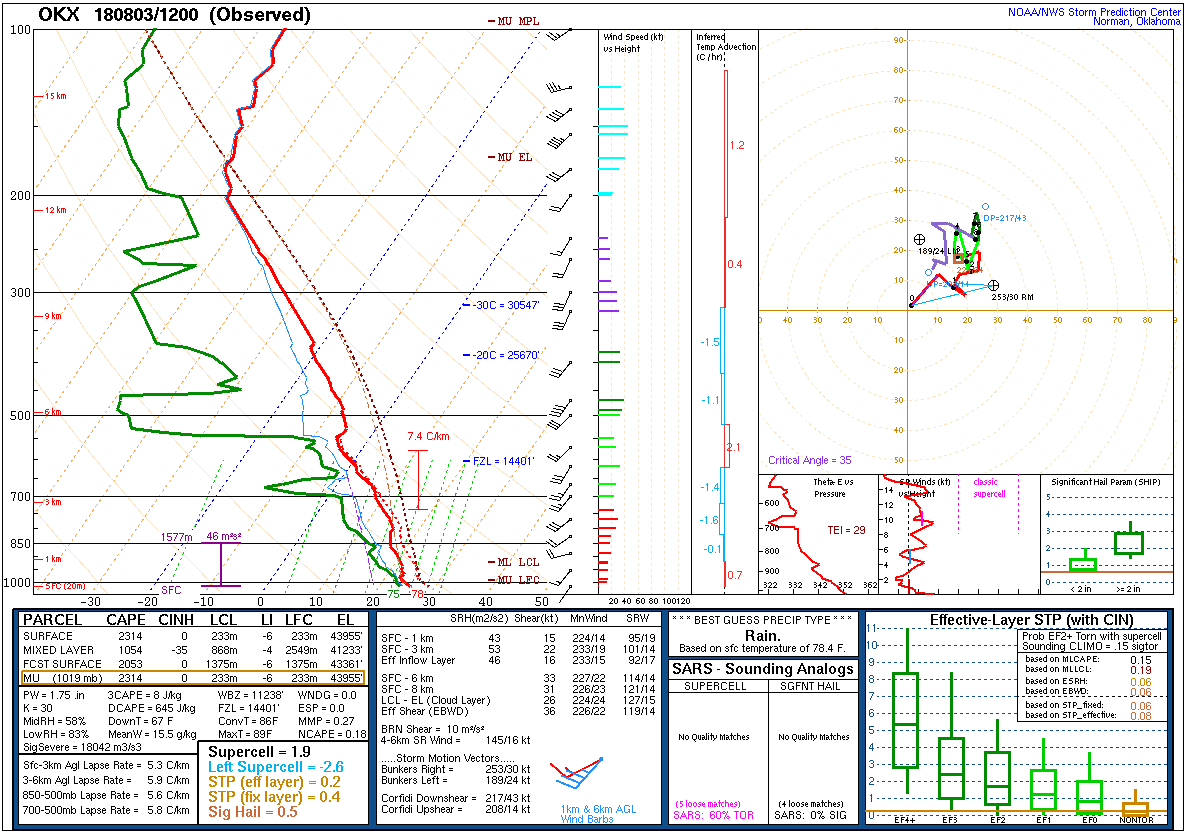 |
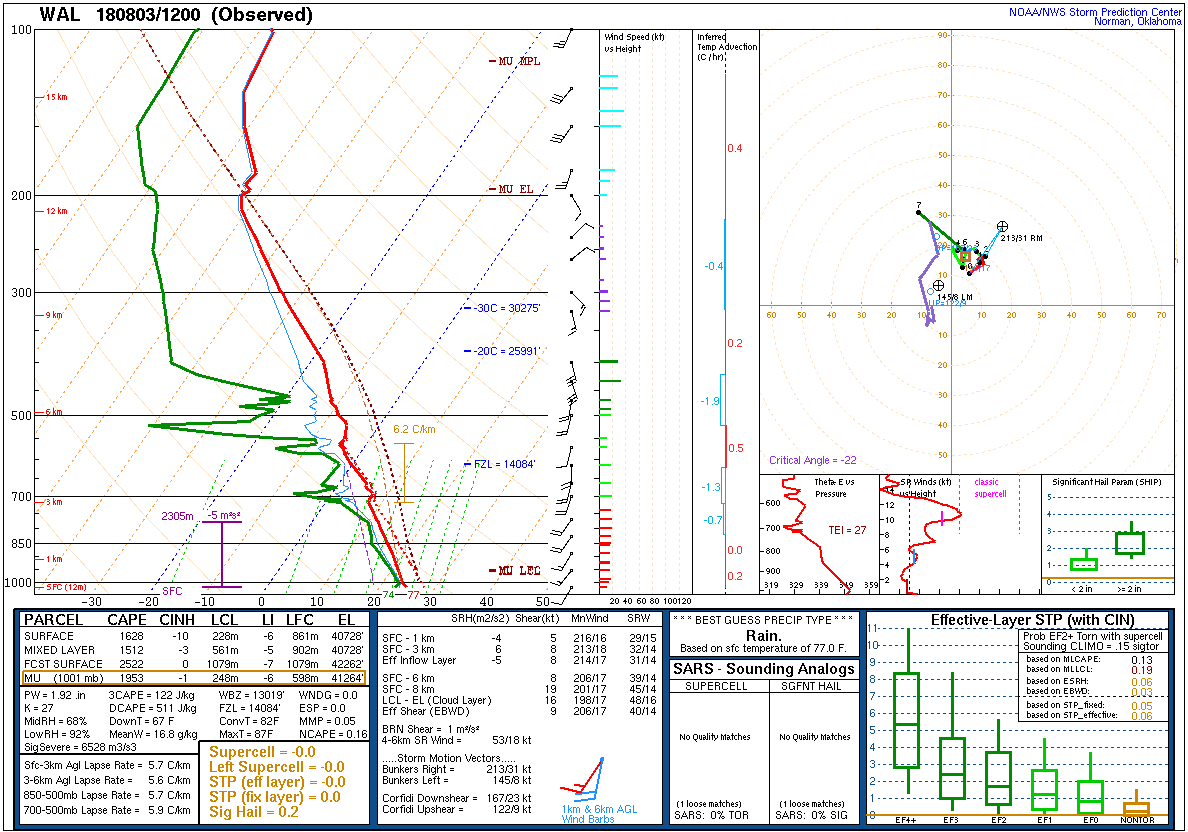 |
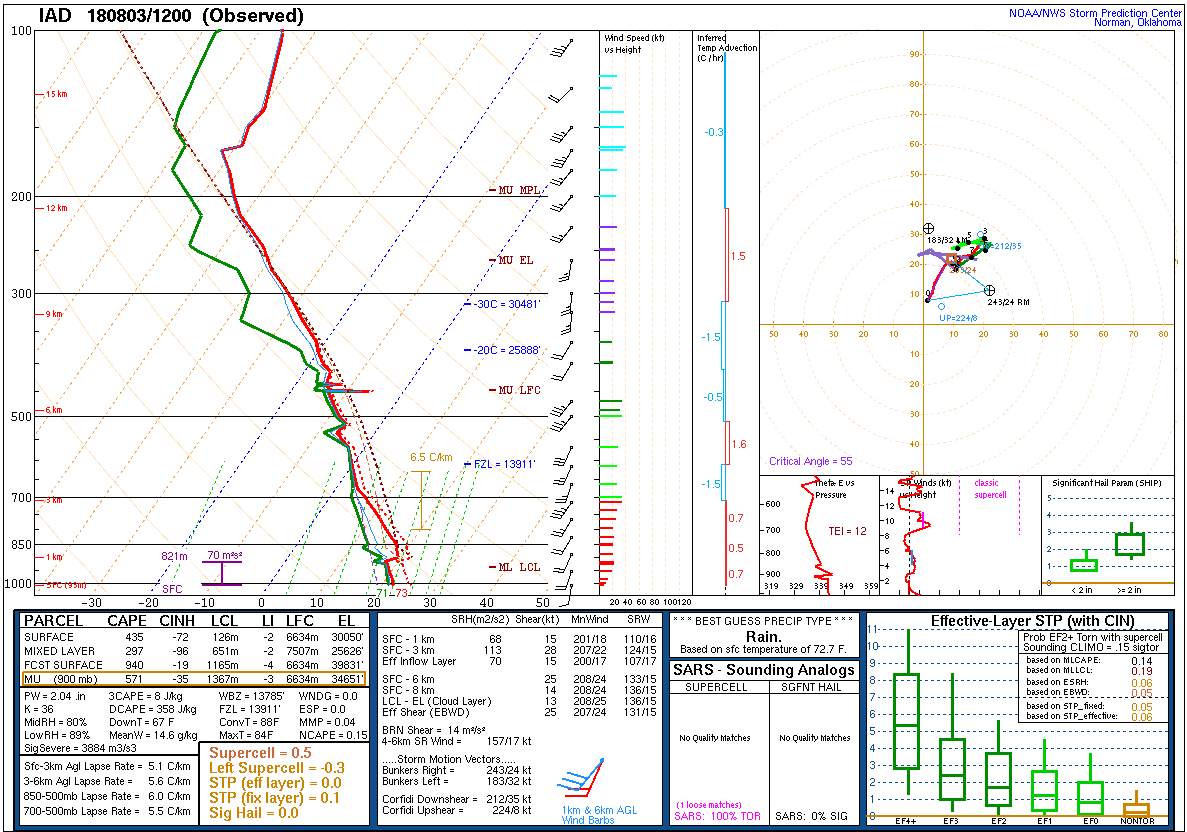 |
| Figure 19: 12z Upton, NY sounding | Figure 20: 12z Wallops Island, VA sounding | Figure 21: 12z Sterling, VA sounding |
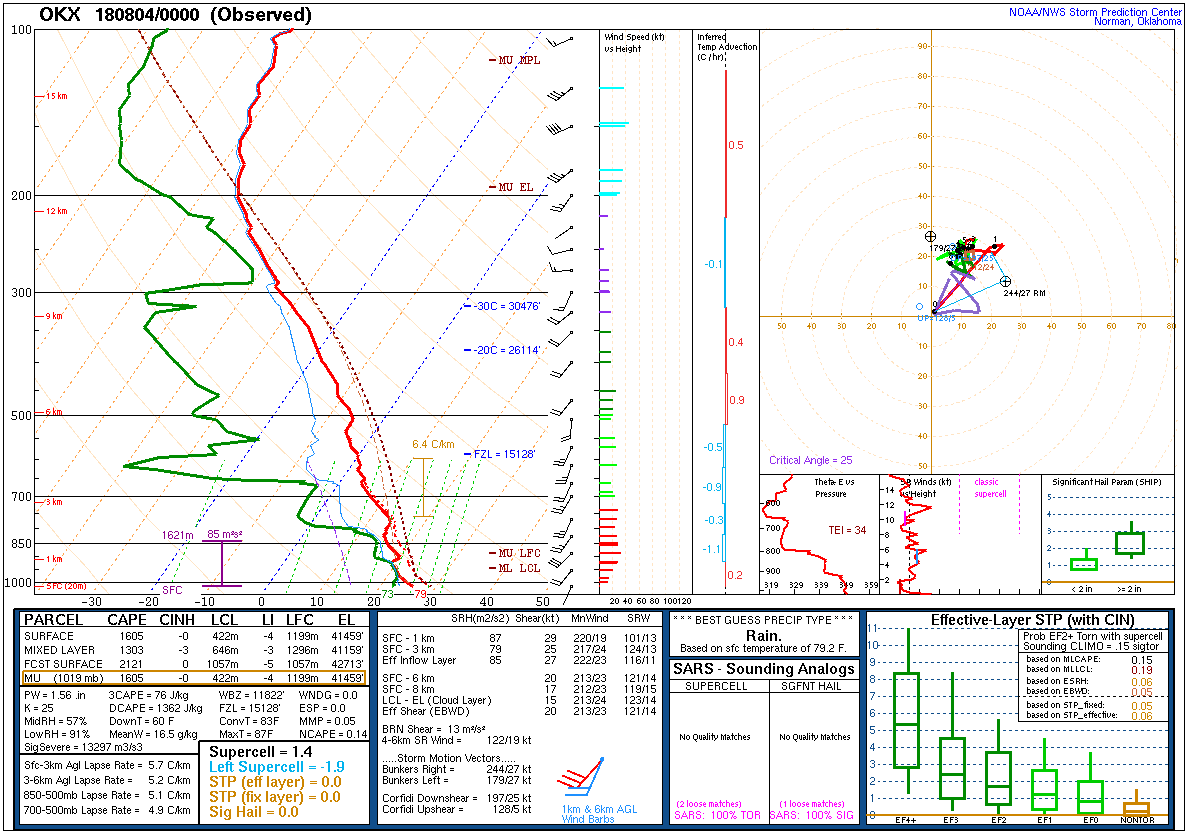 |
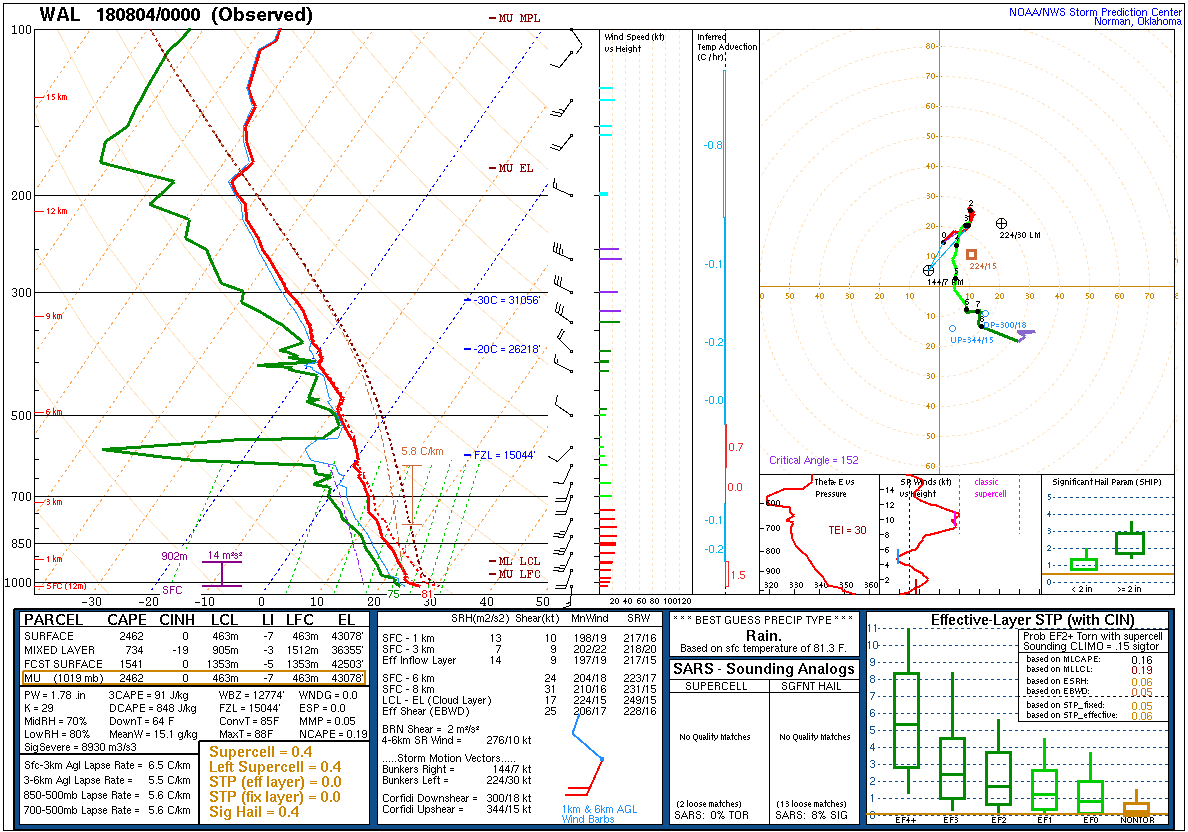 |
 |
| Figure 22: 00z Upton, NY sounding | Figure 23: 00z Wallops Island, VA sounding | Figure 24: 00z Sterling, VA sounding |
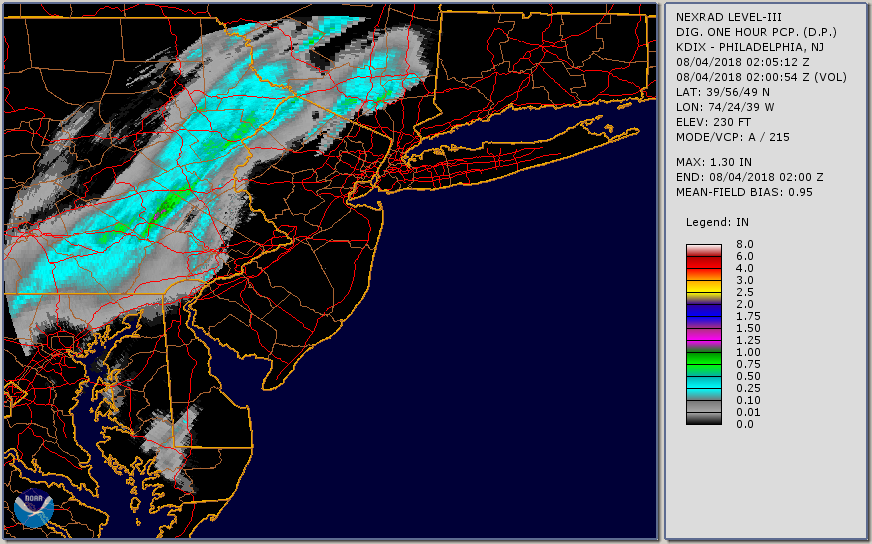
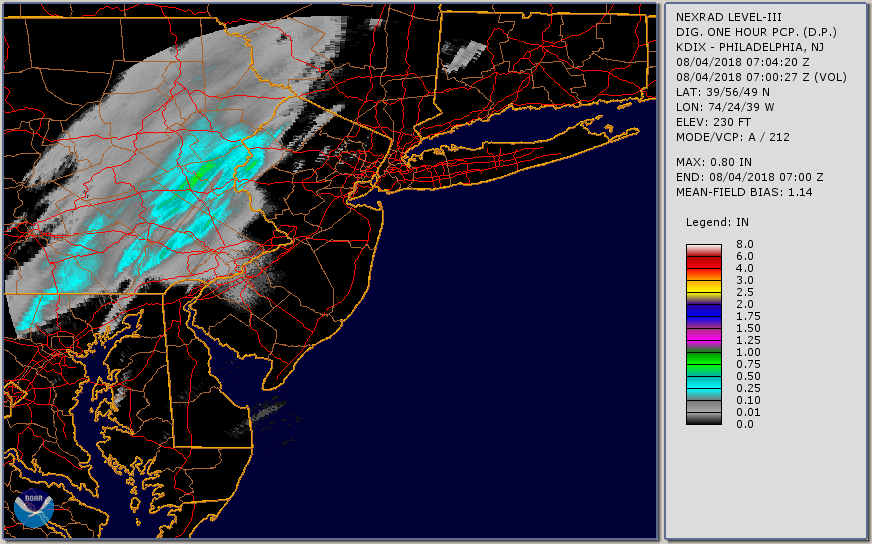
One-Hour Polarimetric Rainfall Accumulations (via GR2Analyst)
 |
 |
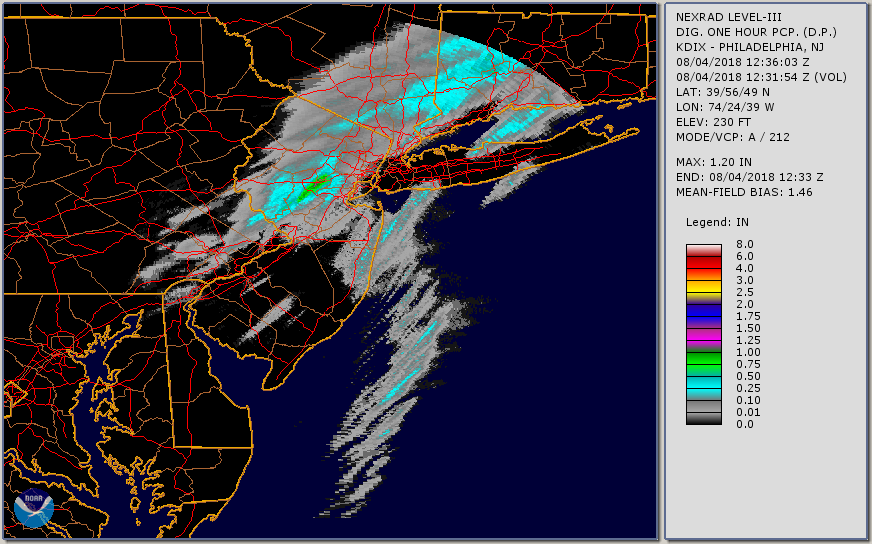 |
| Figure 1: KDIX 1-hr rainfall accumulations via polarimetric estimation ending at 0200 UTC 4 Aug 2018. | Figure 2: Same as Fig. 1, ending at 0700 UTC 4 Aug 2018. | Figure 3: Same as Fig. 1, ending at 1230 UTC 4 Aug 2018. |
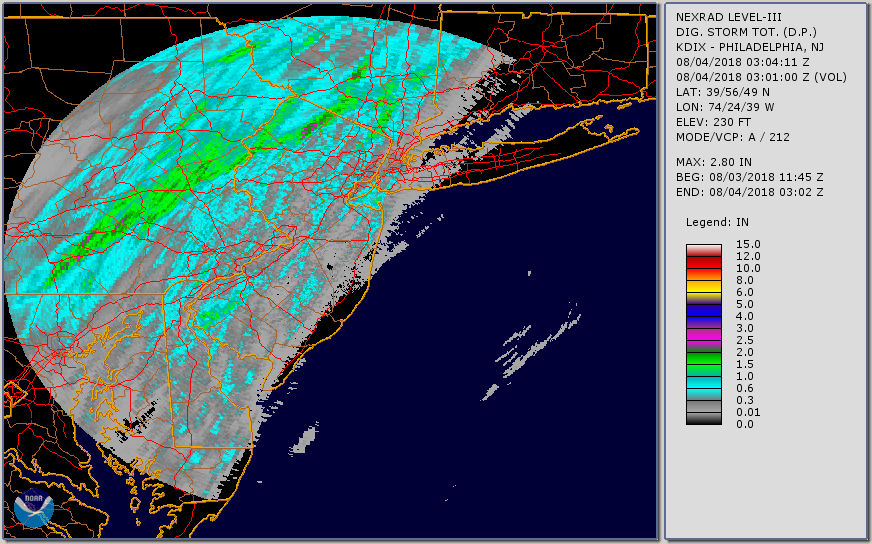
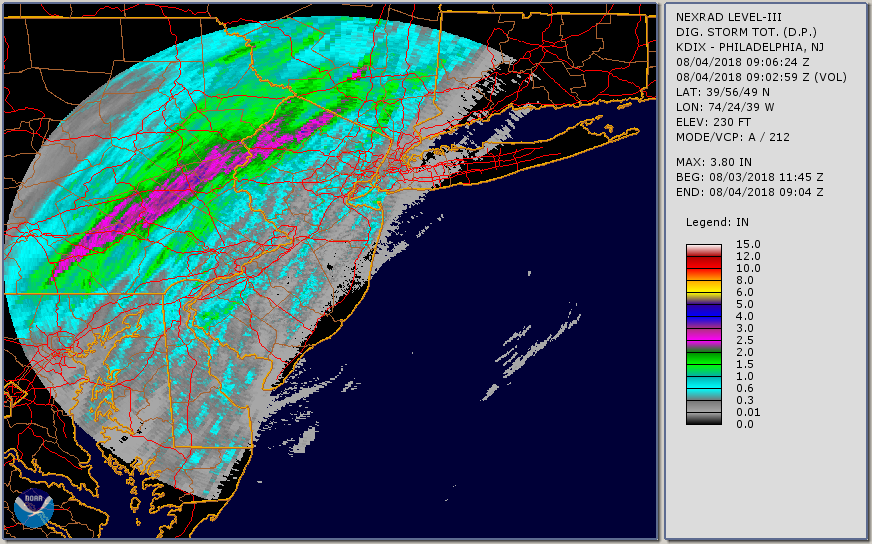
Storm Total Polarimetric Rainfall Accumulations (via GR2Analyst)
 |
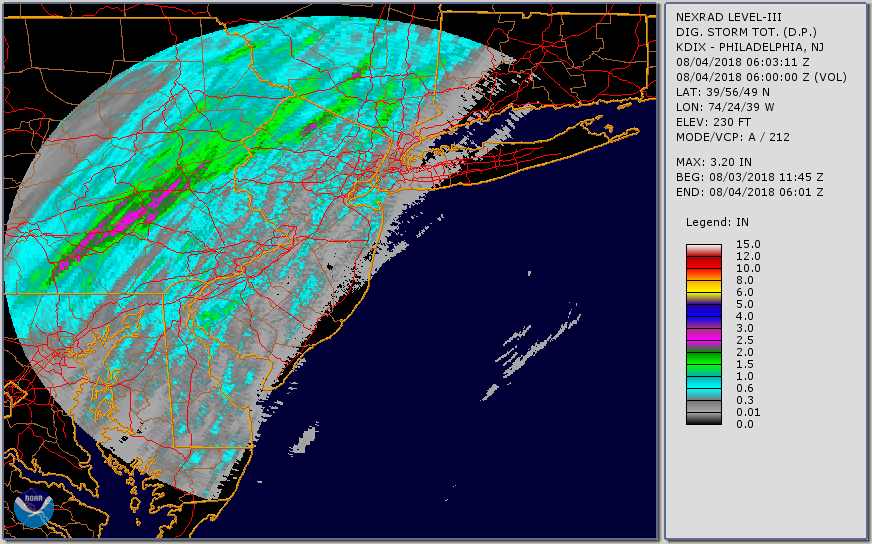 |
| Figure 4: KDIX storm total rainfall accumulations via polarimetric estimation ending at 0300 UTC 4 Aug 2018. | Figure 5: Same as Fig. 4, ending at 0600 UTC 4 Aug 2018. |
 |
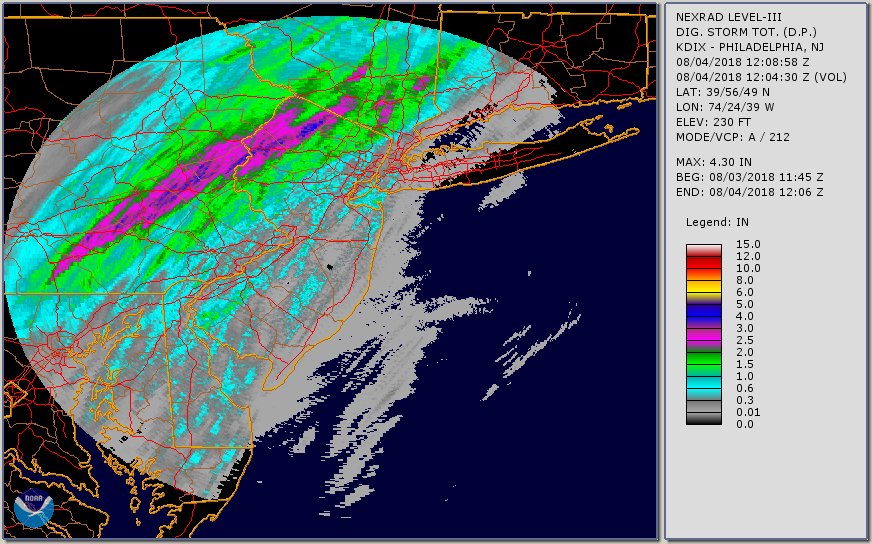 |
| Figure 6: Same as Fig. 4, ending at 0900 UTC 4 Aug 2018. | Figure 7: Same as Fig. 4, ending at 1200 UTC 4 Aug 2018. |
Areal Flood Advisory 0187
Areal Flood Advisory 0188
Areal Flood Advisory 0189
Flash Flood Warning 0049
Areal Flood Advisory 0190
Flash Flood Warning 0050
Areal Flood Advisory 0191
Areal Flood Advisory 0192
Areal Flood Advisory 0193
Areal Flood Advisory 0194
Areal Flood Warning 0046
Areal Flood Advisory 0195
Areal Flood Advisory 0196
Areal Flood Warning 0047
Areal Flood Warning 0048
Areal Flood Advisory 0197
Areal Flood Advisory 0198
Areal Flood Advisory 0199
Areal Flood Advisory 0200
Flash Flood Warning 0051
River Flood Warning 0026
Areal Flood Advisory 0201
Areal Flood Advisory 0202
Areal Flood Warning 0049
River Flood Warning 0027
Flash Flood Warning 0052
Areal Flood Warning 0050
Areal Flood Warning 0051
River Flood Warning 0028
Areal Flood Warning 0052
River Flood Warning 0029
NWUS51 KPHI 050943
LSRPHI

PRELIMINARY LOCAL STORM REPORT...SUMMARY
NATIONAL WEATHER SERVICE MOUNT HOLLY NJ
542 AM EDT SUN AUG 05 2018

..TIME...   ...EVENT...      ...CITY LOCATION...     ...LAT.LON...
..DATE...   ....MAG....      ..COUNTY LOCATION..ST.. ...SOURCE....
            ..REMARKS..

0915 PM     TSTM WND DMG     WYOMISSING              40.33N  75.96W
08/03/2018                   BERKS              PA   SOCIAL MEDIA

            SEVERAL REPORTS OF TREES AND WIRES DOWN IN BERKS COUNTY
            FROM EARL TWP THROUGH WYOMISSING AND READING INTO EXETER
            AND RUSCOMBMANOR TOWNSHIPS. GENERAL TIMING FROM 915 PM
            TO 945 PM BASED ON RADAR.

0924 PM     FLASH FLOOD      1 S COUNTRY RIDGE ESTAT 40.35N  76.19W
08/03/2018                   BERKS              PA   SOCIAL MEDIA

            WATER RESCUE ON BRICKPLANT ROAD IN HEIDELBERG TWP.

1018 PM     FLOOD            FRITZTOWN               40.30N  76.06W
08/03/2018                   BERKS              PA   SOCIAL MEDIA

            BASEMENT FLOODING AT A RESIDENCE ON FRITZTOWN ROAD.

1032 PM     FLOOD            FRITZTOWN               40.30N  76.07W
08/03/2018                   BERKS              PA   SOCIAL MEDIA

            FRITZTOWN ROAD IS FLOODED IN SOUTH HEIDELBERG TWP.

1038 PM     FLOOD            TOPTON                  40.50N  75.70W
08/03/2018                   BERKS              PA   SOCIAL MEDIA

            INTERSECTION OF WEST WEIS STREET AND SOUTH CALLOWHILL
            STREET IN TOPTON IS FLOODED.

1047 PM     FLOOD            GRIESEMERSVILLE         40.59N  75.50W
08/03/2018                   LEHIGH             PA   SOCIAL MEDIA

            STREET FLOODING ON HAMILTON STREET NEAR CEDAR CREEK.

1049 PM     FLOOD            SEYFERT                 40.29N  75.88W
08/03/2018                   BERKS              PA   SOCIAL MEDIA

            BASEMENT FLOODING AT A RESIDENCE ON OLD RIVER ROAD IN
            ROBESON TWP.

1055 PM     FLOOD            1 NE OLEY FURNACE       40.42N  75.78W
08/03/2018                   BERKS              PA   SOCIAL MEDIA

            BASEMENT FLOODING AND POTENTIAL FLOOD DAMAGE TO A
            RESIDENCE IN ROCKLAND TWP.

1100 PM     FLOOD            OREFIELD                40.64N  75.58W
08/03/2018                   LEHIGH             PA   NEWSPAPER

            FLOODING AT AND NEAR THE INTERSECTION OF OREFIELD ROAD
            AND COFFEETOWN ROAD.

1200 AM     HEAVY RAIN       NORTH CATASAUQUA        40.66N  75.47W
08/04/2018  M2.31 INCH       NORTHAMPTON        PA   METEOROLOGIST

            DAILY RAINFALL TOTAL FOR AUGUST 3, WITH MOST OCCURRING
            WITHIN A TWO-HOUR PERIOD.

0138 AM     FLASH FLOOD      1 E SOUTH HEIDELBERG TW 40.31N  76.08W
08/04/2018                   BERKS              PA   SOCIAL MEDIA

            A PARTIAL COLLAPSE OF A STRUCTURE OCCURRED AS A RESULT
            OF A BASEMENT WALL COLLAPSE FROM FLOOD WATERS.

0216 AM     FLOOD            CHARLESTOWN HUNT        40.10N  75.53W
08/04/2018                   CHESTER            PA   DEPT OF HIGHWAYS

            HEAVY RAINFALL CONTRIBUTED TO A DOWNED TREE ON STATE
            HIGHWAY 29 BETWEEN CHARLESTOWN HUNT DRIVE AND BUCKWALTER
            ROAD. ALL LANES CLOSED.

0248 AM     FLOOD            1 NE PHILLIPSBURG       40.70N  75.17W
08/04/2018                   WARREN             NJ   SOCIAL MEDIA

            FLOODING ON U.S. HIGHWAY 22 IN LOPATCONG TWP.

0250 AM     FLOOD            1 N CHEROKEE RANCH      40.42N  75.93W
08/04/2018                   BERKS              PA   SOCIAL MEDIA

            REPORT OF A VEHICLE STUCK IN FLOOD WATERS ON LEESPORT
            AVENUE IN READING.

0316 AM     FLOOD            FORKS                   40.70N  75.23W
08/04/2018                   NORTHAMPTON        PA   SOCIAL MEDIA

            STREET FLOODING REPORTED IN FORKS.

0326 AM     FLOOD            PALMER TWP              40.70N  75.26W
08/04/2018                   NORTHAMPTON        PA   SOCIAL MEDIA

            STREET FLOODING REPORTED IN PALMER TWP.

0328 AM     FLOOD            HARDYSTON TWP           41.10N  74.53W
08/04/2018                   SUSSEX             NJ   DEPT OF HIGHWAYS

            HEAVY RAINFALL CONTRIBUTED TO A DOWNED TREE ON STATE
            HIGHWAY 23 NORTH OF HOLLAND MOUNTAIN ROAD IN HARDYSTON
            TWP.

0356 AM     FLOOD            HANOVER                 40.66N  75.41W
08/04/2018                   NORTHAMPTON        PA   SOCIAL MEDIA

            STREET FLOODING REPORTED IN HANOVER.

0357 AM     FLOOD            PAXINOSA                40.71N  75.19W
08/04/2018                   WARREN             NJ   SOCIAL MEDIA

            RIVER ROAD IS FLOODED BETWEEN PHILLIPSBURG AND MARBLE
            HILL.

0442 AM     FLOOD            ZUCKSVILLE              40.72N  75.25W
08/04/2018                   NORTHAMPTON        PA   DEPT OF HIGHWAYS

            FLOODING ON BUSHKILL DRIVE BETWEEN STOCKER MILL ROAD
            AND KESSLERVILLE ROAD. ALL LANES CLOSED.

0442 AM     FLOOD            ZUCKSVILLE              40.72N  75.25W
08/04/2018                   NORTHAMPTON        PA   DEPT OF HIGHWAYS

            FLOODING ON BUSHKILL DR./13TH ST. IN BOTH DIRECTIONS
            BETWEEN STOCKER MILL RD. AND KESSLERVILLE RD. ALL LANES
            CLOSED.

0515 AM     FLOOD            WHITEHALL TWP           40.66N  75.51W
08/04/2018                   LEHIGH             PA   NEWSPAPER

            THREE WATER RESCUES CAUSED BY VEHICLES DRIVING PAST
            BARRICADES IN WHITEHALL TWP. THESE OCCURRED BETWEEN 515
            AM AND 1015 AM.

0519 AM     FLOOD            1 WSW WASHINGTON        40.76N  74.99W
08/04/2018                   WARREN             NJ   SOCIAL MEDIA

            STREET FLOODING ON WEST WASHINGTON AVENUE IN WASHINGTON
            BORO.

0600 AM     FLOOD            1 SW BETHLEHEM          40.62N  75.38W
08/04/2018                   NORTHAMPTON        PA   NEWSPAPER

            INUNDATION OF SEVERAL MUSIC FESTIVAL VENUES IN
            BETHLEHEM AS A RESULT OF FLOODING ON MONOCACY CREEK.
            TIME BASED ON RIVER GAUGE REPORTS.

0600 AM     FLOOD            ALLENTOWN               40.59N  75.48W
08/04/2018                   LEHIGH             PA   NEWSPAPER

            SEVERAL ROADS FLOODED IN LEHIGH COUNTY...ESPECIALLY IN
            ALLENTOWN. THESE INCLUDE THE INTERSECTION OF ROUTE 309
            AND VILLAGE ROAD IN SOUTH WHITEHALL TOWNSHIP...BASIN AND
            UNION STREETS NEAR LITTLE LEHIGH CREEK...BATH PIKE IN
            EAST ALLEN...AND HAMILTON STREET IN ALLENTOWN.
            INUNDATION OF CEDAR CREEK PARK IN ALLENTOWN ALSO
            OCCURRED.

0600 AM     FLOOD            LOWER NAZARETH TWP      40.70N  75.33W
08/04/2018                   NORTHAMPTON        PA   NEWSPAPER

            SEVERAL ROADS CLOSED IN NORTHAMPTON COUNTY...INCLUDING
            STEUBEN ROAD FROM KEYSTONE DRIVE TO GEORGETOWN ROAD IN
            LOWER NAZARETH TOWNSHIP...KESSLERSVILLE ROAD NORTH OF
            KUEBLER ROAD IN FORKS TOWNSHIP...AND THE INTERSECTION OF
            VAN BUREN AND CORRIERE ROADS IN PALMER TOWNSHIP. TIME
            ESTIMATED FROM MEDIA AND LAW ENFORCEMENT REPORTS.

0600 AM     FLOOD            CATASAUQUA              40.65N  75.46W
08/04/2018                   LEHIGH             PA   NEWSPAPER

            FLOODING OF THE CATASAQUA CREEK INUNDATED THE CITY
            POOL, FORCING ITS CLOSURE.

0606 AM     FLOOD            EAST ALLEN TWP          40.71N  75.42W
08/04/2018                   NORTHAMPTON        PA   NEWSPAPER

            WATER RESCUES AS A RESULT OF VEHICLES DRIVING PAST
            BARRICADES IN EAST ALLEN TOWNSHIP.

0607 AM     FLOOD            CHAPMAN                 40.76N  75.40W
08/04/2018                   NORTHAMPTON        PA   DEPT OF HIGHWAYS

            FLOODING ON YOST ROAD BETWEEN MAIN STREET AND ENGLISH
            ROAD. ALL LANES CLOSED.

0609 AM     FLOOD            CHAPMAN                 40.76N  75.41W
08/04/2018                   NORTHAMPTON        PA   DEPT OF HIGHWAYS

            FLOODING ON YOST RD./5TH ST. BETWEEN MAIN ST. AND
            ENGLISH RD. ALL LANES CLOSED.

0700 AM     HEAVY RAIN       BLAIRSTOWN              40.98N  74.98W
08/04/2018  M2.96 INCH       WARREN             NJ   COCORAHS

            11-HOUR TOTAL SINCE 8 PM YESTERDAY.

0700 AM     HEAVY RAIN       MARTINS CREEK           40.78N  75.19W
08/04/2018  M4.57 INCH       NORTHAMPTON        PA   TRAINED SPOTTER

            24-HOUR TOTAL. MARTIN'S CREEK RUNNING HIGH BUT NO
            FLOODING.

0720 AM     HEAVY RAIN       BELVIDERE               40.83N  75.07W
08/04/2018  M3.52 INCH       WARREN             NJ   TRAINED SPOTTER

            RAIN FELL OVER A 24-HOUR PERIOD.

0730 AM     HEAVY RAIN       HIGHLAND LAKES          41.18N  74.47W
08/04/2018  M4.00 INCH       SUSSEX             NJ   TRAINED SPOTTER

            24-HOUR TOTAL.

0800 AM     HEAVY RAIN       NORTHAMPTON             40.68N  75.49W
08/04/2018  M4.75 INCH       NORTHAMPTON        PA   TRAINED SPOTTER

            24-HOUR TOTAL.

0800 AM     FLASH FLOOD      1 ENE PARSIPPANY-TROY H 40.86N  74.39W
08/04/2018                   MORRIS             NJ   LAW ENFORCEMENT

            WATER RESCUE REPORTED ON U.S. HIGHWAY 46 NEAR NORTH
            BEVERWYCK ROAD. ADDITIONALLY...WESTBOUND U.S. HIGHWAY 46
            EXIT TO WATERVIEW BOULEVARD WAS CLOSED FROM A
            CONSTRUCTION SITE DEBRIS FLOW. EDWARDS ROAD WAS CLOSED
            BETWEEN U.S. HIGHWAY 46 AND NEW ROAD. TIME APPROXIMATED
            BASED ON MEDIA AND LAW ENFORCEMENT REPORTS.

0800 AM     FLOOD            1 NNW ANCIENT OAKS      40.54N  75.59W
08/04/2018                   LEHIGH             PA   SOCIAL MEDIA

            FLOODING OF SPRING CREEK ROAD AND RESIDENTIAL STREETS
            NEAR LITTLE LEHIGH CREEK IN LOWER MACUNGIE TWP. VIDEO ON
            SOCIAL MEDIA SHOWS WATER REACHING THE WINDSHIELD OF A
            CAR PARKED ON SPRING CREEK ROAD ADJACENT TO LITTLE
            LEHIGH CREEK.

0838 AM     FLOOD            CLYDE                   40.71N  75.39W
08/04/2018                   NORTHAMPTON        PA   DEPT OF HIGHWAYS

            FLOODING ON PA 512 IN BOTH DIRECTIONS BETWEEN JAINDL
            BLVD. AND SILVER CREST RD. ALL LANES CLOSED.

0840 AM     FLOOD            1 NW PARSIPPANY-TROY HI 40.87N  74.41W
08/04/2018                   MORRIS             NJ   DEPT OF HIGHWAYS

            FLOODING ON US 46 IN BOTH DIRECTIONS EAST OF I-287. ALL
            LANES CLOSED AND DETOURED.

0903 AM     HEAVY RAIN       GERMANSVILLE            40.70N  75.71W
08/04/2018  M3.07 INCH       LEHIGH             PA   TRAINED SPOTTER

            STORM TOTAL RAINFALL.

0930 AM     FLOOD            NORTH PLAINFIELD        40.62N  74.44W
08/04/2018                   SOMERSET           NJ   LAW ENFORCEMENT

            MULTIPLE VEHICLES STUCK IN HIGH WATER.

1008 AM     FLOOD            1 NNE ANCIENT OAKS      40.54N  75.58W
08/04/2018                   LEHIGH             PA   TRAINED SPOTTER

            FLOODING ALONG THE LITTLE LEHIGH CREEK NEAR SPRING
            CREEK AND LOWER MACUNGIE ROADS.

1009 AM     HEAVY RAIN       HIGHLAND LAKES          41.18N  74.47W
08/04/2018  M4.30 INCH       SUSSEX             NJ   PUBLIC

            24-HOUR TOTAL.

1050 AM     FLOOD            MAIDEN CREEK            40.45N  75.90W
08/04/2018                   BERKS              PA   TRAINED SPOTTER

            FLOODING ON ROADWAYS IN AND AROUND BLANDON/MAIDENCREEK
            TOWNSHIP.

1100 AM     FLOOD            1 ENE ALPHANO           40.90N  74.85W
08/04/2018                   WARREN             NJ   TRAINED SPOTTER

            FLOODING FROM A LAKE ON THE PANTHER VALLEY GOLF COURSE.

1130 AM     FLOOD            BETHLEHEM               40.63N  75.38W
08/04/2018                   NORTHAMPTON        PA   SOCIAL MEDIA

            PHOTO SHOWS RIVER FLOODING AT THE MUSIKFEST STREET
            FAIR. THIS IS NOT CONFIRMED AT THIS TIME.

1238 PM     FLOOD            MUTCHLERTOWN            40.67N  75.24W
08/04/2018                   NORTHAMPTON        PA   DEPT OF HIGHWAYS

            FLOODING ON LARRY HOLMES DR./IRON ST./KEYSTONE
            ST./LEHIGH DR./WASHINGTON ST. IN BOTH DIRECTIONS BETWEEN
            LEHIGH DR./HUGH MOORE PARK RD. AND 4TH ST./WASHINGTON
            ST. ALL LANES CLOSED.

0714 PM     FLOOD            2 NNE CEDARVILLE        40.25N  75.66W
08/04/2018                   MONTGOMERY         PA   TRAINED SPOTTER

            FLOODING ON MANATAWNY STREET AND COLLEGE DRIVE AS A
            RESULT OF THE SCHUYLKILL RIVER OVERFLOWING ITS BANKS.

0232 AM     HEAVY RAIN       NORTH CATASAUQUA        40.66N  75.47W
08/05/2018  M5.86 INCH       NORTHAMPTON        PA   METEOROLOGIST

            TWO-DAY RAINFALL TOTAL.


&&

EVENT NUMBER PHI1801178 PHI1801171 PHI1801172 PHI1801173 PHI1801174
PHI1801181 PHI1801175 PHI1801176 PHI1801218 PHI1801177 PHI1801179
PHI1801180 PHI1801183 PHI1801182 PHI1801185 PHI1801186 PHI1801188
PHI1801187 PHI1801184 PHI1801189 PHI1801205 PHI1801213 PHI1801190
PHI1801210 PHI1801212 PHI1801214 PHI1801217 PHI1801211 PHI1801191
PHI1801204 PHI1801194 PHI1801201 PHI1801192 PHI1801193 PHI1801202
PHI1801209 PHI1801216 PHI1801207 PHI1801208 PHI1801203 PHI1801195
PHI1801197 PHI1801196 PHI1801198 PHI1801199 PHI1801200 PHI1801206
PHI1801215 PHI1801219


$$

CMS


 Coastal Flood
 Marine Forecasts
 Text Products
 Climate Information
 Skywarn
 Submit Storm Report
 Weather Event Archives
 Forecast Discussion
 Emergency Managers
 Briefing Page