|
Pittsburgh, PA |
Morgantown, WV |
Zanesville, OH |
Select drop-down menu for other sites and months
6-10 Day Outlook |
8-14 Day Outlook |
||
Temperature |
Precipitation |
Temperature |
Precipitation |
One Month Outlook |
Three Month Outlook |
||
Temperature |
Precipitation |
Temperature |
Precipitation |

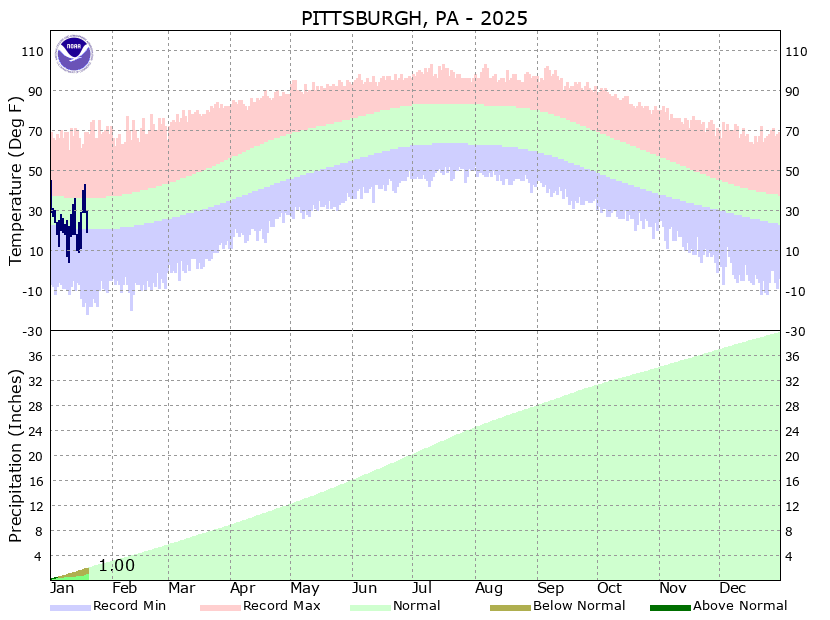
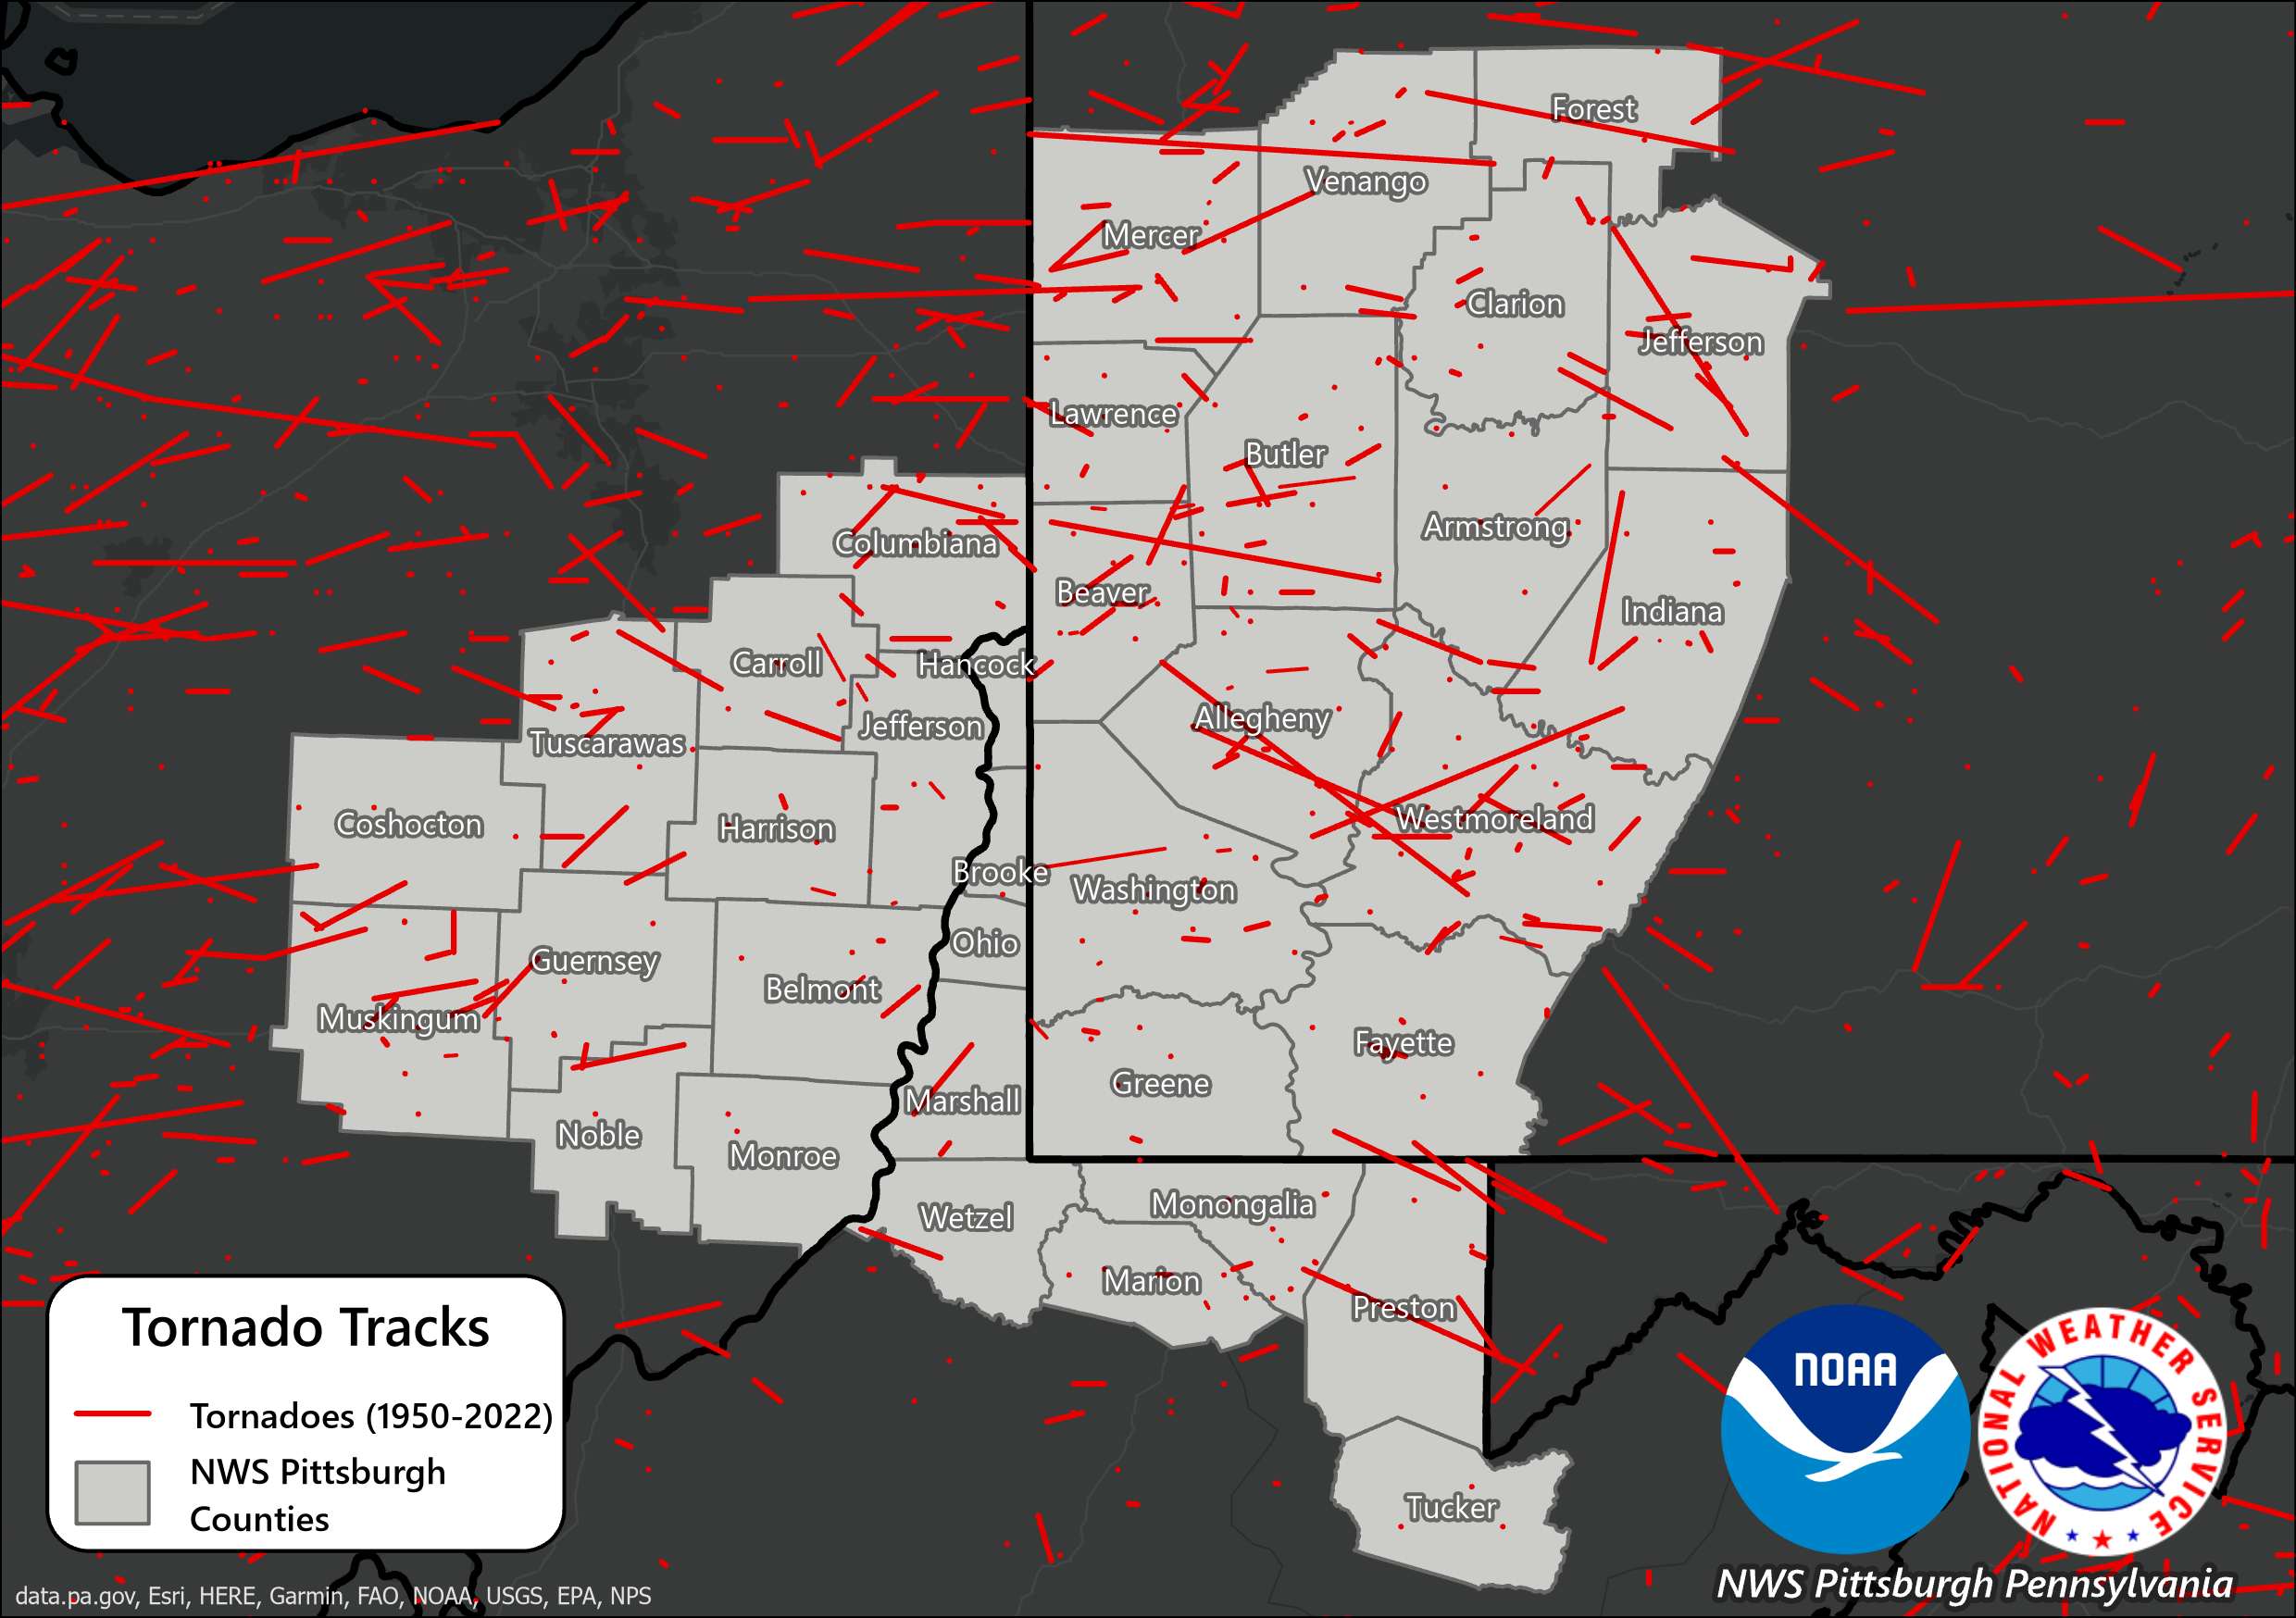
This page provides an overview of tornado climatology for the Pittsburgh, PA (PBZ) CWA since 1950. Visit this severe weather climatology page for a more detailed examination of the NWS Pittsburgh, PA (PBZ) County Warning Area severe climatology.

This page provides an overview of flash flood climatology for the Pittsburgh, PA (PBZ) CWA since 1986.
Flash Floods can be caused by a number of factors, but is most often due to extremely heavy rainfall from thunderstorms. Flash Floods can also occur due to excessive runoff from melting snow, ice jams, or Dam/Levee Breaks. The intensity and location/distribution of rainfall plays a significant factor in flash flooding, but other factors that contribute are land use, soil type, topography, vegetation type/density, and soil water-content. These all determine if and how quickly Flash Flooding may occur.
Urban areas within our forecast area are also prone to flash flooding in short time-spans as the impervious surfaces in the urban areas do not allow water to infiltrate the ground, and the water runs off to the low spots very quickly. Clogged drains and culverts within urban settings can further exacerbate flooding problems.
It is important to view these severe weather reports as just that, reports. We rely heavily on Skywarn Spotters, Broadcast Media, Cooperative Observers, County Officials, and the Public for severe weather reports. While we remain diligent in our efforts to document every occurence of flooding, we understand that a lot of cases go unrecorded.
|
|
| Flash Flood Reports by County |
 |
| Flash Flood Reports by Year |
 |
 |
| Flash Flood Reports by Month | Flash Flood Reports by Month (with PBZ Precipitable Water Climatology) |
Two maximas are noted in the monthly graphs, a warm season spike (May-Aug) and a cool season spike (Jan). This shows that there are multiple factors at play. The warm season maxima is associated with thunderstorm activity over the Spring and Summer months when precipitatable water (the total amount of water in the column of atmosphere overhead) peaks and heavy downpours are common with thunderstorms. The right image contains the precipitable water climatology data derived from the Pittsburgh Upper Air Sounding. The cool season maxima can at least be partially attributed to rain falling on melting snow and/or ice jam issues.
 |
| Flash Flood Reports by Hour |
Two maximas are noted in the hourly graphs, an afternoon/evening spike (2-5pm EST) and a morning spike (6-9am EST). The afternoon/evening spike is a result of what you may expect, heavy downpours associated with thunderstorms that develop during the peak heating hours. The morning spike may actually be attributed more to human nature than environmental factors. This is the time of day when most people are travelling and may encounter a flooded roadway, either from earlier rainfall or from rain falling at that time.