Warning Operations
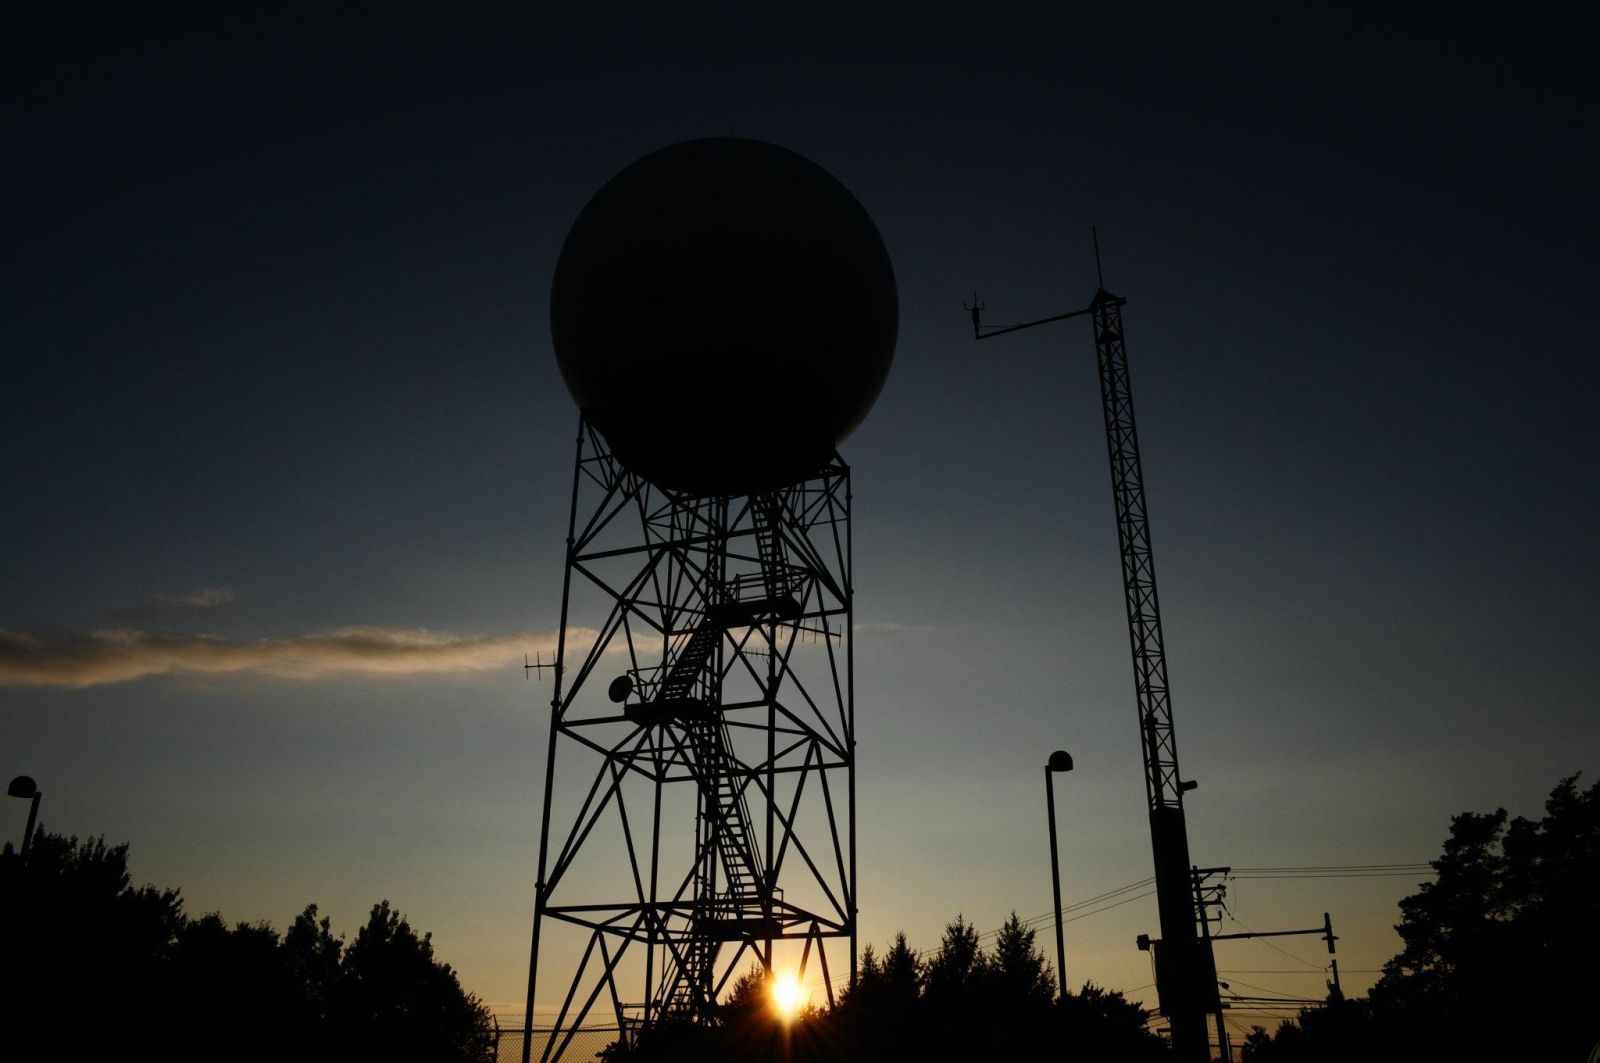
The most important responsibility of any NWS field office is the timely issuance of severe weather warnings. The WSR-88D Doppler radar has dramatically helped in this task. Our radar tower is located next to our parking lot outside our front door. AWIPS has been configured so that radar monitoring and warning issuance are performed at any of our AWIPS workstations.
How we issue a severe storm warning:
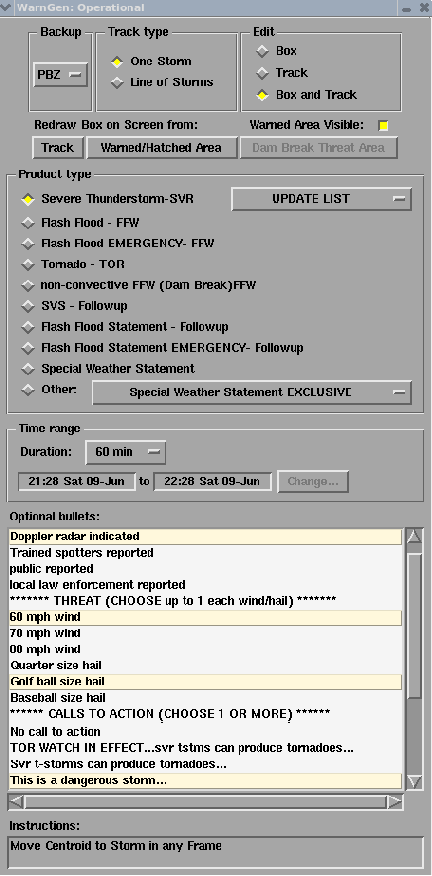
Radar surveillance is always part of the job. On a day-to-day basis, both forecasters are performing this function while completing their other duties. However, in active weather, this is a much more time-consuming process.Therefore, at least one meteorologist is solely assigned this task. After interrogating a storm, if the radar meteorologist determines that a warning is required, he/she clicks on an icon that's in the upper right corner of the AWIPS graphic screen. This activates the warning program. A cursor pops up on the screen, along with a dialog box (seen below). The cursor is moved to the storm of concern on the current radar image, and a radar image from 10 to 15 minutes prior. This is so the computer can calculate storm movement. The meteorologist then makes sure the proper items are clicked in the box, including warning type, valid time, and any appropriate instructions, and then clicks an icon at the bottom of the screen to compose the warning. AWIPS then composes the warning, and includes the names of communities in the path of the storm, and the time they will be first affected. The meteorologist has a chance to make any necessary additions or adjustments on a text workstation before issuing the warning.
The advantage of Doppler radar is its ability to not just detect where the precipitation is falling, but also determine movement of particles within the storm. In the image (below, left), the areas colored green depict movement toward the radar (radar located northwest of the image), and the areas colored red depict movement away from the radar. From this, one can infer rotation at this location since fairly strong winds are depicted in opposite directions side by side. However, this accounts for the wind field at just one level. We have the ability to view radar data at a number of levels. Thus, if a similar scenario is found at the same location at different, adjacent levels, this is a rotating column of air, which is a precursor of tornado development.
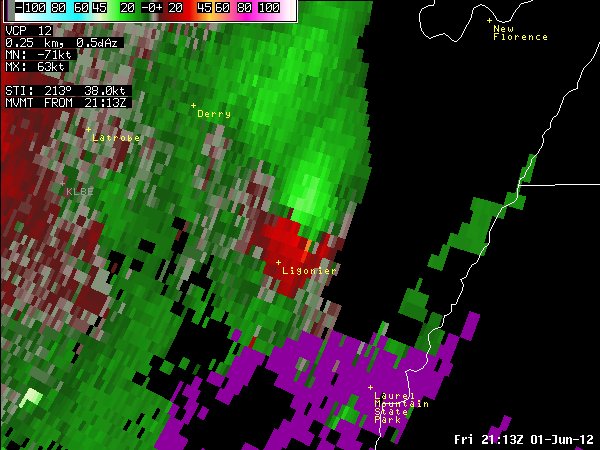

This was the case in these two images, when there was an EF-1 tornado on the ground in Ligonier, PA on June 1, 2012. A reflectivity image from this storm at the same time can be seen (top, right).
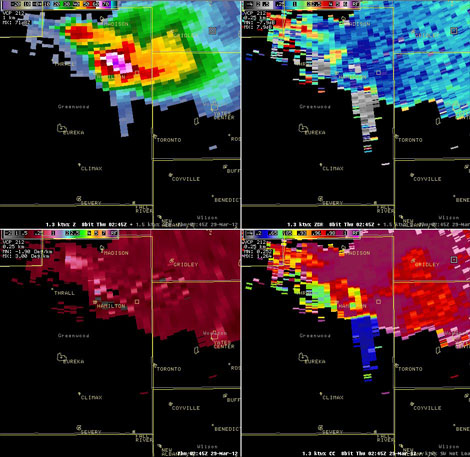
Our radar recently got upgraded to Dual-Pol. What is Dual-Pol? The radar before the upgrade had a single transmitter and receiver. Energy was sent out in a horizontal orientation and energy was received in horizontal orientation. After the upgrade, our radar still has 1 transmitter, but 2 receivers. Energy is sent out at 45° angle (horizontal and vertical orientation) and energy is received in a horizontal and vertical orientation. This gives us better information about the shape, type, and orientation of the storm we are interrogating. The image below is a good example of a Three Body Scatter Spike (TBSS) image taken from our radar. Three out of the four images shows a spike coming out from the bottom of the storm. Usually when a spike like this is seen, it indicates that there is very large hail suspended in the air within the storm.
Sometimes, storms begin to move away from the radar and towards the edge of our county warning area, making it difficult to receive the best signitures from the storm. Every office has the ability to dial to other radars to get a different view of storms. It also serves as good backup coverage. In other words, if the radar were to develop mechanical difficulties, we can always obtain radar data from surrounding sites, and maintain surveillance. AWIPS makes this task much easier since the data gathering is done automatically.
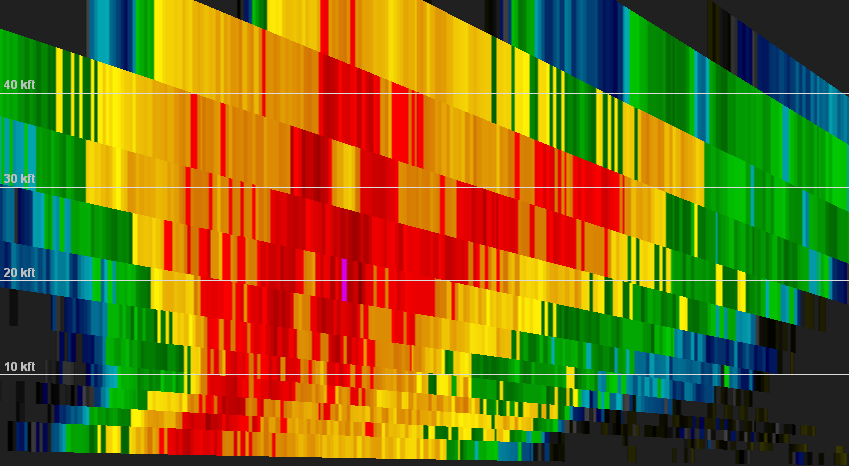
As indicated above, the radar can view storms at multiple levels. Instead of viewing the data in each "slice" along the Earth's surface, it is also possible to view the data with respect to height. The image below is such a cross section. With AWIPS, the starting and ending points of the cross section can be placed anywhere and in any orientation.. We can determine if there is hail inside a thunderstorm as its return is much stronger than that of water particles.