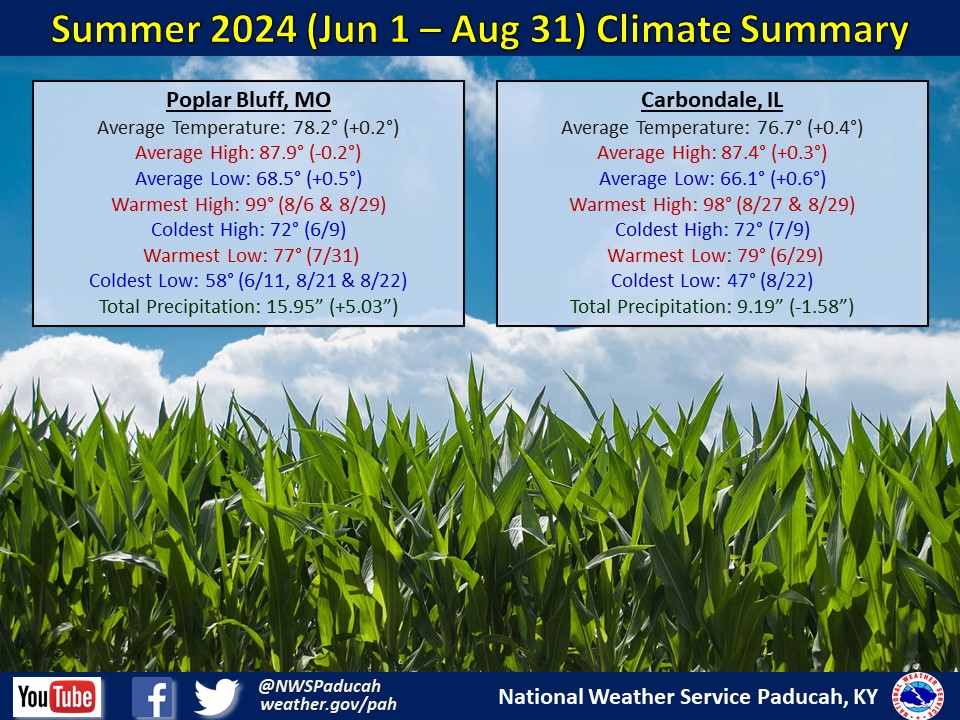
Summer 2024 Climate Summary:
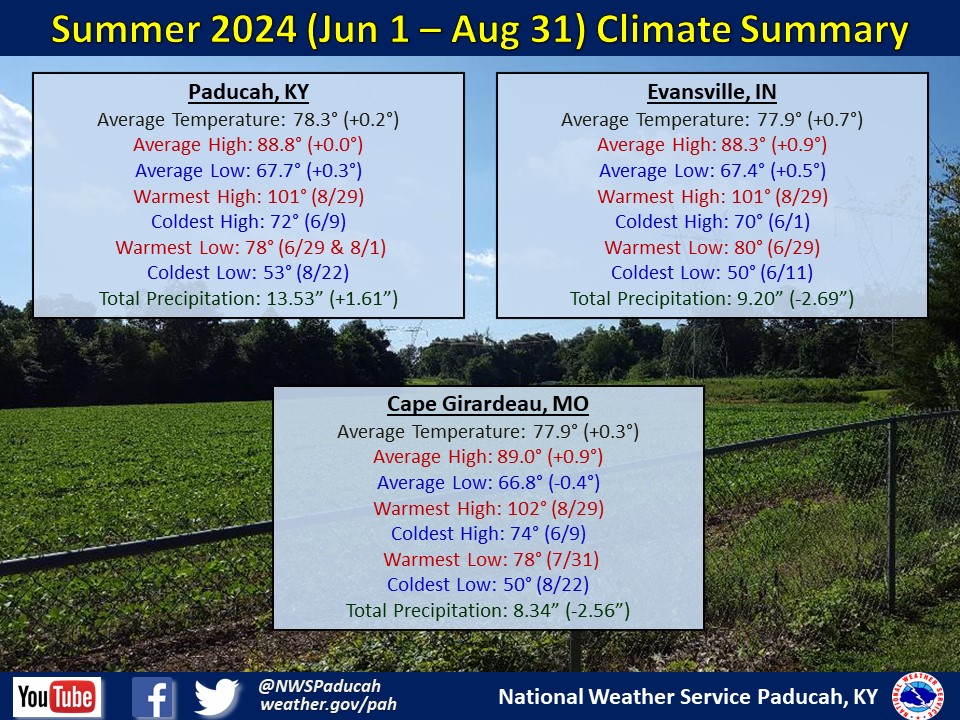
Temperatures finished right near normal for the summer season. June was the warmest month compared to normal, while July was slightly cooler than normal and August was right near normal. We endured several shorter spells of extreme heat and humidity, but the most intense one probably was the 4 day period from July 29 – August 1. Many locations observed heat index readings over 105 each of these 4 days and several readings of 110 to 115 were achieved. There were 44 days this summer that hit 90 degrees in Paducah, which was right near the norm. Many locations hit 100 degrees on August 29th, but lower humidity kept heat index values mainly below 105.
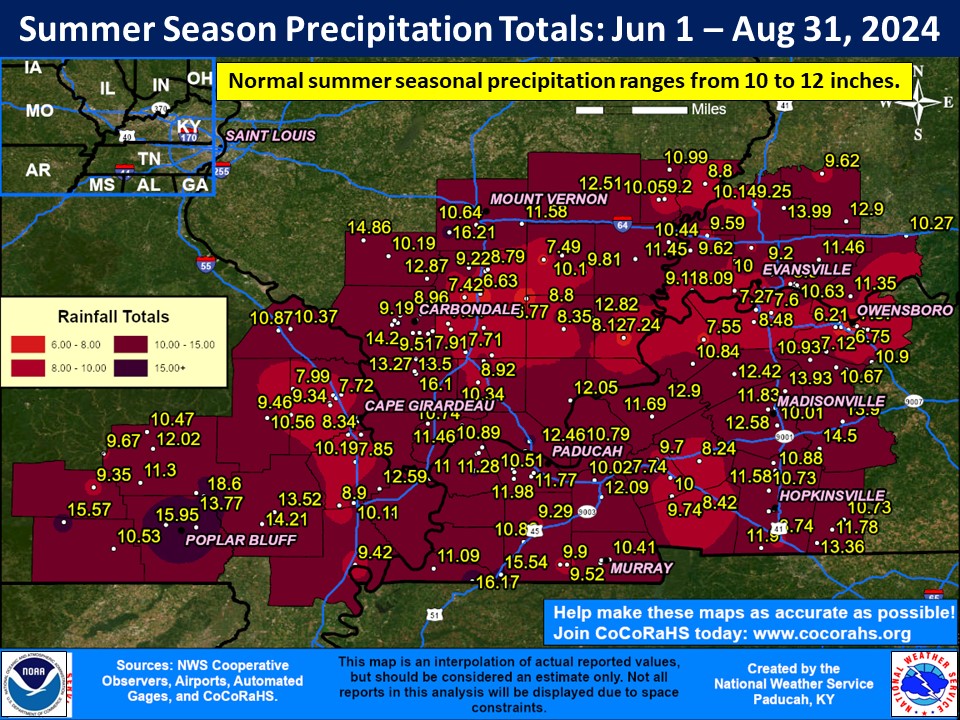
Precipitation finished near normal to drier than normal across much of the Quad State with amounts of 8 to 13 inches, which was roughly 75 to 100 percent of normal. However, there were some pockets of higher amounts which finished wetter than normal. There were 3 separate areas, one centered across McLean and Muhlenberg counties in Kentucky, another from Ripley to Butler and Stoddard counties in Missouri, and a third up in Wayne, Jefferson, and Perry Counties in Illinois. Departures in these areas ranged from 2 to 6 inches wetter than normal, and locally in excess of 8 inches. The highest observed amount in our forecast area was 18.85” at a CoCoRaHS station in Butler County, Missouri (Poplar Bluff 3.7 WNW).
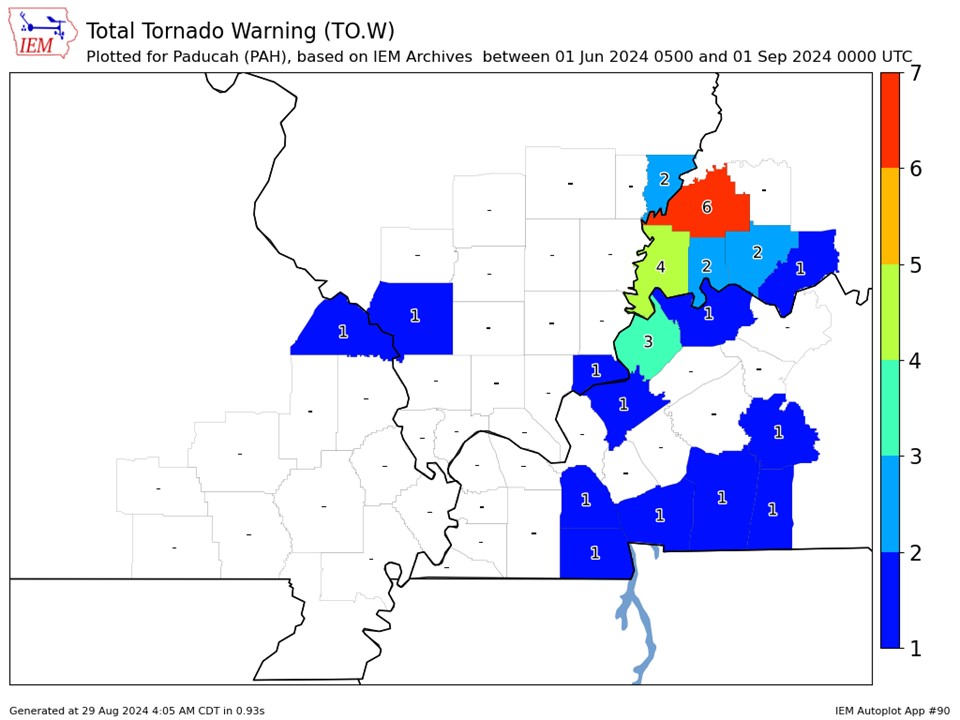
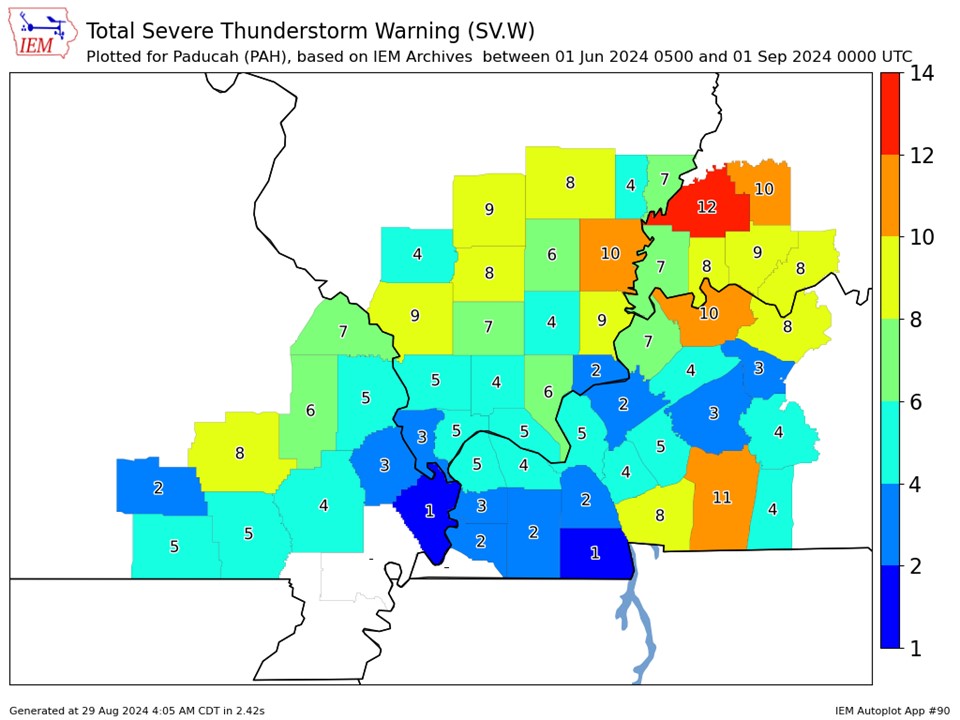
There were two notable severe thunderstorm events that occurred, both during the month of July. The first was on July 9th associated with the remnants of Hurricane Beryl. 7 tornadoes occurred with this event including an EF-3 striking the Mount Vernon, IN area. This was the strongest tornado on record for the month of July in our region. The second event occurred on July 30th with an EF-1 tornado touching down in the Evansville, IN area. Our office issued 161 combined warnings (Severe Thunderstorm, Tornado, and Flash Flood) which was above our summer average of 118 warnings. Gibson County, Indiana was under 21 of these warnings, the most of any of our 58 counties.
The graphic below is an interpolated rainfall map using actual observations. Please note that there are likely discrepancies in between observations, since the values are estimated based on nearest reports.
|
Summer 2024 Review: Precipitation and Temperature Maps (Click on image to enlarge) |
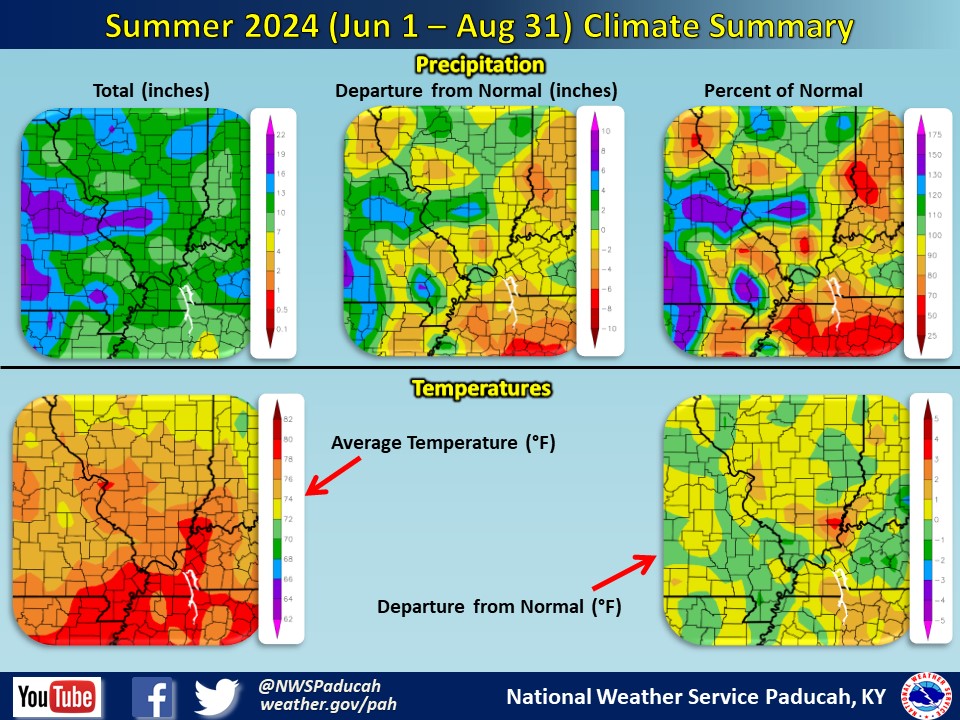 |
| Climate Maps are from the Northeast Regional Climate Center |
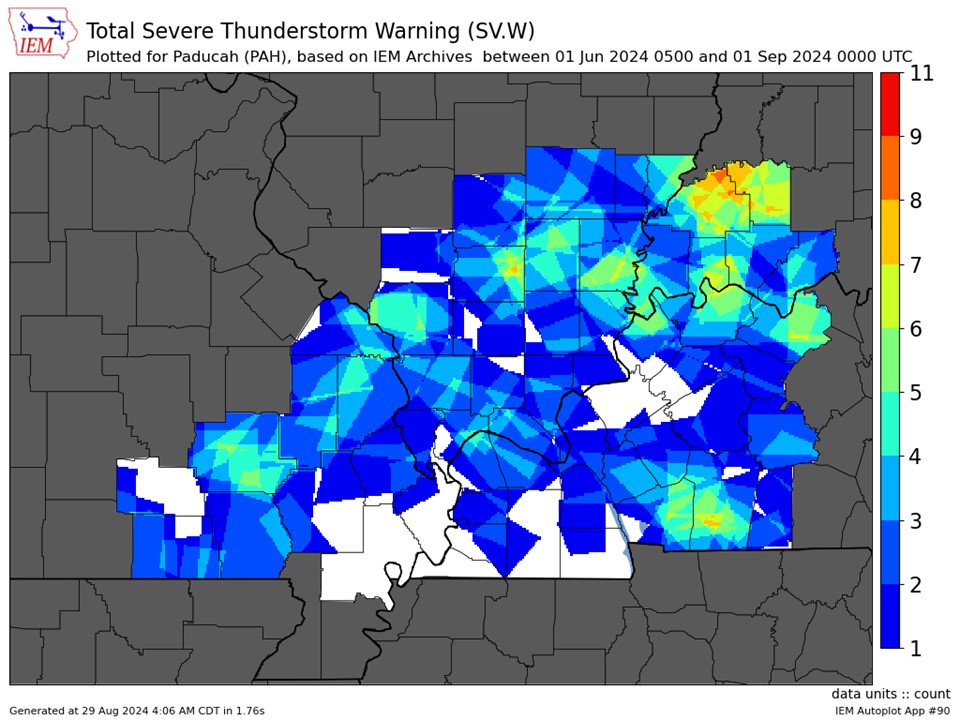
| Severe Thunderstorm Warnings - County Based | Severe Thunderstorm Warnings - Polygon Based |
 |
 |
| Tornado Warnings - County Based | Tornado Warnings - Polygon Based |
|
|
|