Spring Frost/Freeze Climatology
(34 and 36 degrees used as possible frost formation thresholds given other conditions such as high RH and calm winds)
| Average last Freeze (32°F) | April 6 |
| Earliest last Freeze | March 7, 2010 & 1977 |
| Latest last Freeze | May 7, 1944 |
| Average last Hard Freeze (28°F) | March 25 |
| Earliest last Hard Freeze | February 28, 1977 |
| Latest last Hard Freeze | April 20, 1983 |
| Average last 34°F | April 11 |
| Earliest last 34°F | March 19, 2017 |
| Latest last 34°F | May 27, 1961 |
| Average last 36°F | April 18 |
| Earliest last 36°F | March 19, 2017 |
| Latest last 36°F | May 27, 1961 |
Period of Record: December 3, 1937 to June 1, 2018
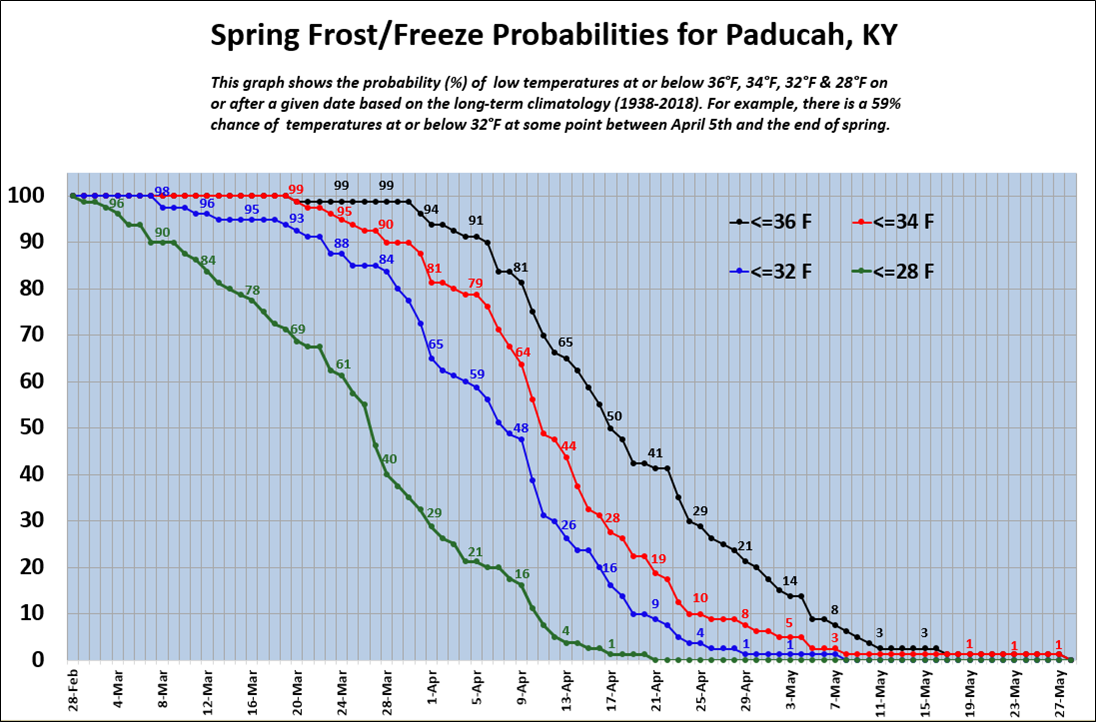
The graphic below shows the probability of experiencing temperatures at or below 36, 34, 32, and 28 degrees on or after a given date based on long term climatology. (CLICK ON GRAPH TO ENLARGE)
 |
The graphic below shows the historical probability of the last spring freeze in Paducah. The average is around April 6th, but it has occurred as early as March 7th and as late as May 7th.
 |
Spring Frost/Freeze Climatology
(34 and 36 degrees used as possible frost formation thresholds given other conditions such as high RH and calm winds)
| Average last Freeze (32°F) | April 6 |
| Earliest last Freeze | March 4, 1927 |
| Latest last Freeze | May 10, 1966 |
| Average last Hard Freeze (28°F) | March 26 |
| Earliest last Hard Freeze | February 28, 1935 & 1908 |
| Latest last Hard Freeze | May 1, 1963 |
| Average last 34°F | April 12 |
| Earliest last 34°F | March 8, 1922 |
| Latest last 34°F | May 23, 1963 |
| Average last 36°F | April 19 |
| Earliest last 36°F | March 25, 1912 |
| Latest last 36°F | May 27, 1961 |
Period of Record: January 1, 1897 to June 1, 2018
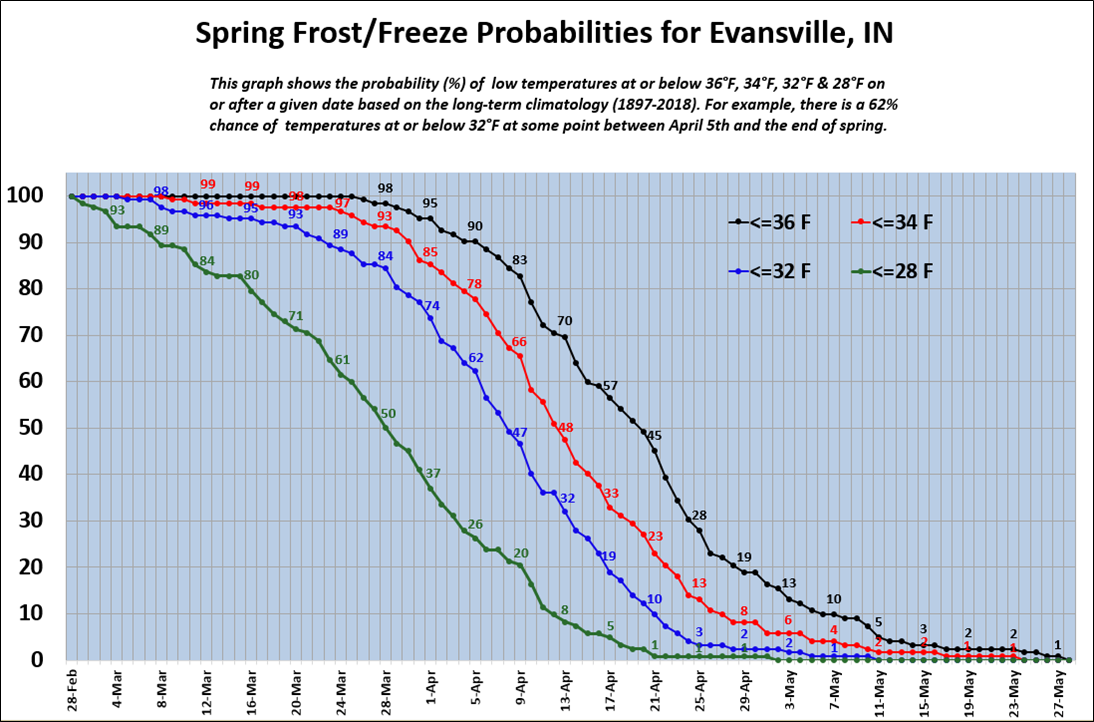
The graphic below shows the probability of experiencing temperatures at or below 36, 34, 32, and 28 degrees on or after a given date based on long term climatology. (CLICK ON GRAPH TO ENLARGE)
 |
The graphic below shows the historical probability of the last spring freeze in Evansville. The average is around April 6th, but it has occurred as early as March 4th and as late as May 10th.
.PNG) |
Spring Frost/Freeze Climatology
(34 and 36 degrees used as possible frost formation thresholds given other conditions such as high RH and calm winds)
| Average last Freeze (32°F) | April 6 |
| Earliest last Freeze | March 7, 2010 & 1977 |
| Latest last Freeze | May 17, 1968 |
| Average last Hard Freeze (28°F) | March 25 |
| Earliest last Hard Freeze | February 28, 1985 & 1977 |
| Latest last Hard Freeze | April 18, 2001 |
| Average last 34°F | April 13 |
| Earliest last 34°F | March 19, 2017 |
| Latest last 34°F | May 17, 1968 |
| Average last 36°F | April 18 |
| Earliest last 36°F | March 22, 1967 |
| Latest last 36°F | May 27, 1961 |
Period of Record: June 1, 1960 to June 1, 2018
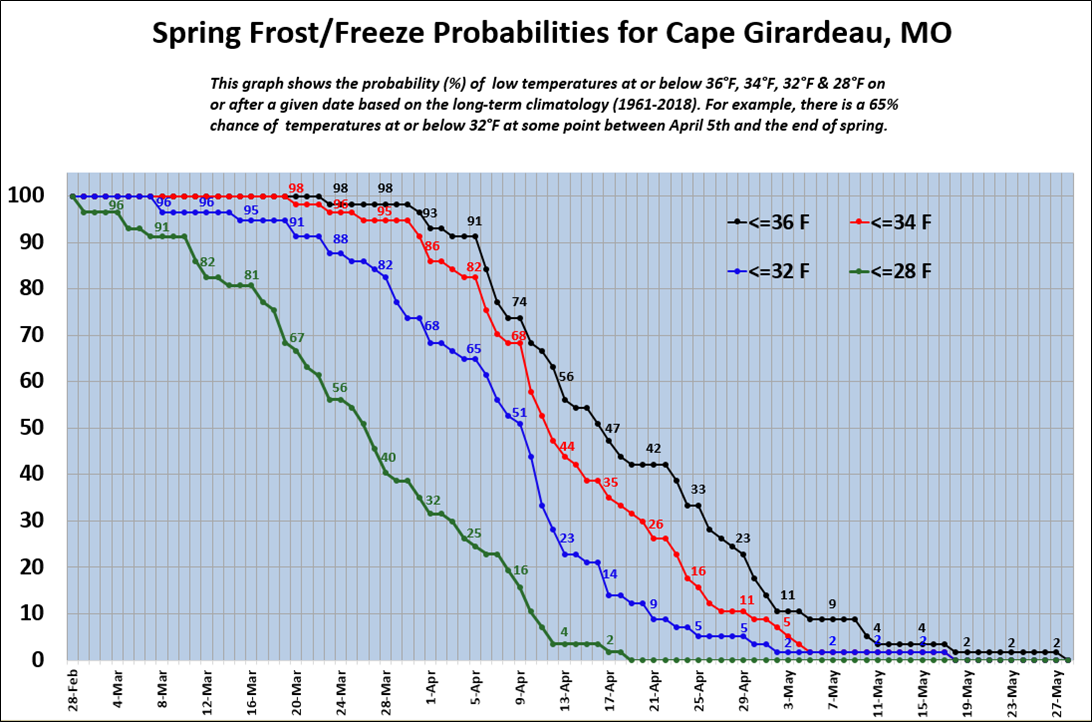
The graphic below shows the probability of experiencing temperatures at or below 36, 34, 32, and 28 degrees on or after a given date based on long term climatology. (CLICK ON GRAPH TO ENLARGE)
 |
The graphic below shows the historical probability of the last spring freeze in Cape Girardeau. The average is around April 7th, but it has occurred as early as March 7th and as late as May 17th.
 |
Spring Frost/Freeze Climatology
(34 and 36 degrees used as possible frost formation thresholds given other conditions such as high RH and calm winds)
| Average last Freeze (32°F) | April 5 |
| Earliest last Freeze | March 4, 2012 |
| Latest last Freeze | May 7, 1944 |
| Average last Hard Freeze (28°F) | March 24 |
| Earliest last Hard Freeze | February 20, 2012 |
| Latest last Hard Freeze | April 22, 1927 |
| Average last 34°F | April 12 |
| Earliest last 34°F | March 6, 2010 |
| Latest last 34°F | May 7, 1944 |
| Average last 36°F | April 17 |
| Earliest last 36°F | March 19, 2017 |
| Latest last 36°F | May 24, 1925 |
Period of Record: January 1, 1893 to August 1, 2021
 |
Spring Frost/Freeze Climatology
(34 and 36 degrees used as possible frost formation thresholds given other conditions such as high RH and calm winds)
| Average last Freeze (32°F) | April 14 |
| Earliest last Freeze | March 20, 2017 & 1929 |
| Latest last Freeze | May 14, 1895 |
| Average last Hard Freeze (28°F) | April 3 |
| Earliest last Hard Freeze | March 8, 1977 & 1922 |
| Latest last Hard Freeze | April 25, 2010 |
| Average last 34°F | April 20 |
| Earliest last 34°F | March 23, 2017 |
| Latest last 34°F | May 16, 1997 |
| Average last 36°F | April 28 |
| Earliest last 36°F | April 2, 1965 |
| Latest last 36°F | May 31, 1930 |
Period of Record: May 1, 1895 to June 1, 2018
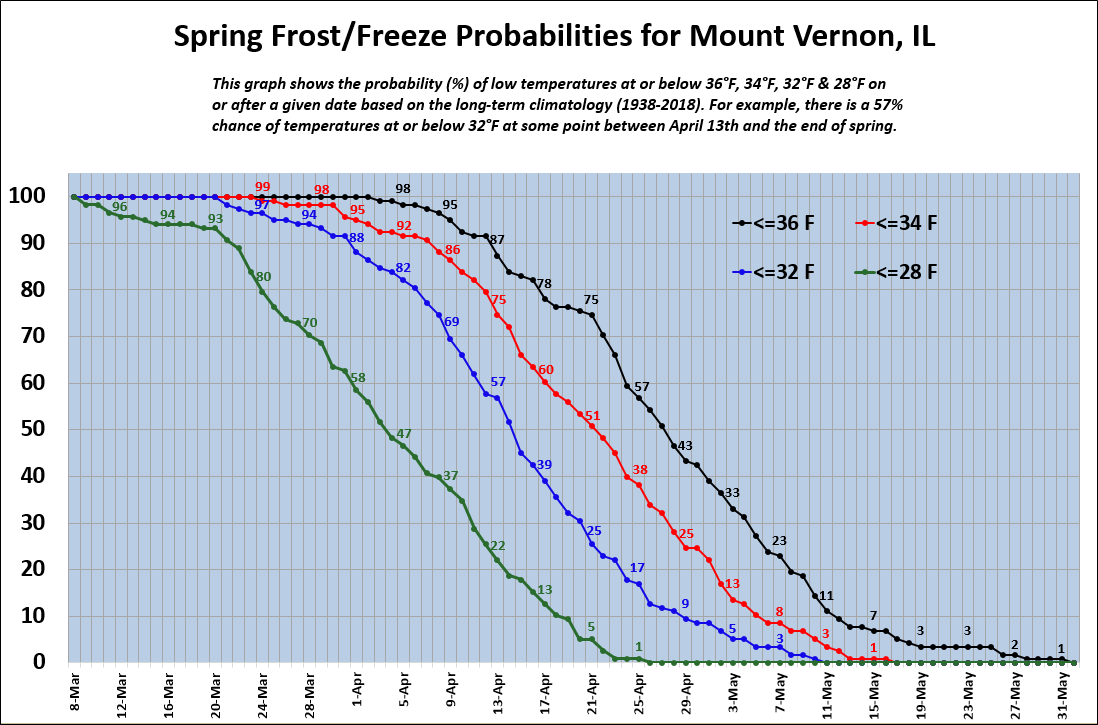
The graphic below shows the probability of experiencing temperatures at or below 36, 34, 32, and 28 degrees on or after a given date based on long term climatology. (CLICK ON GRAPH TO ENLARGE)
 |
The graphic below shows the historical probability of the last spring freeze in Mount Vernon, IL. The average is around April 14th, but it has occurred as early as March 20th and as late as May 14th.
 |
!--CODE FOR EXPANDING IMAGES. DO NOT MODIFY.-->