September 2024 Climate Review:
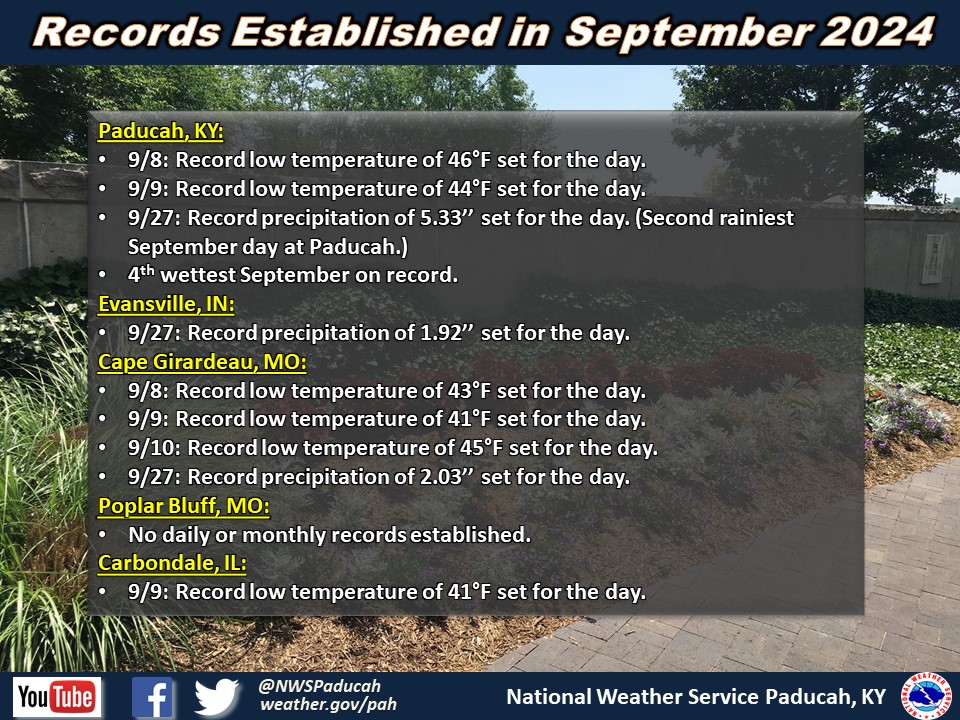
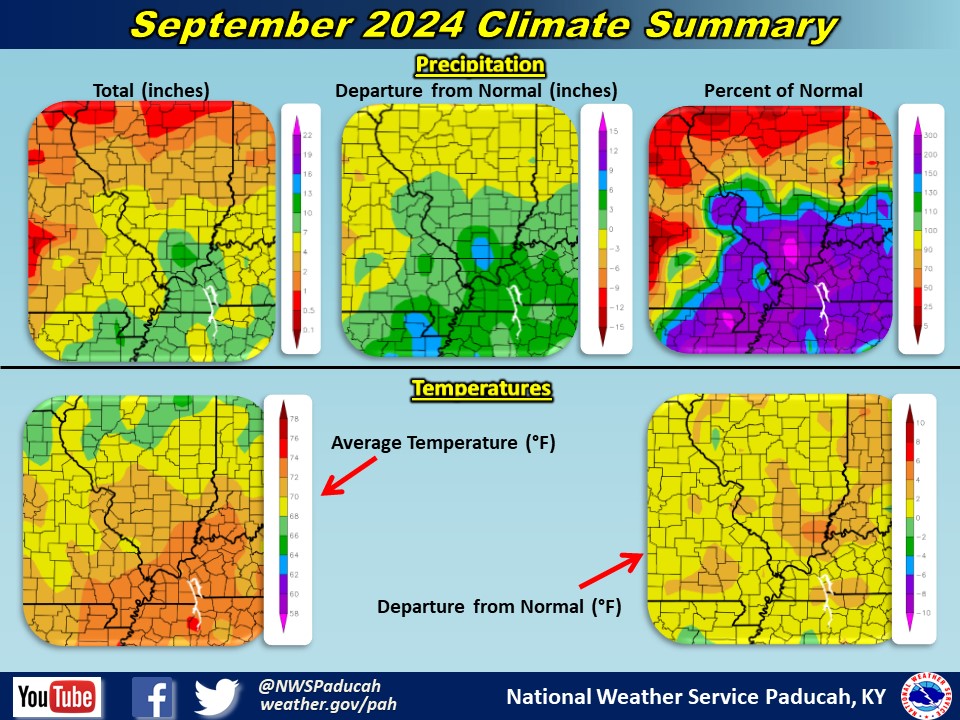
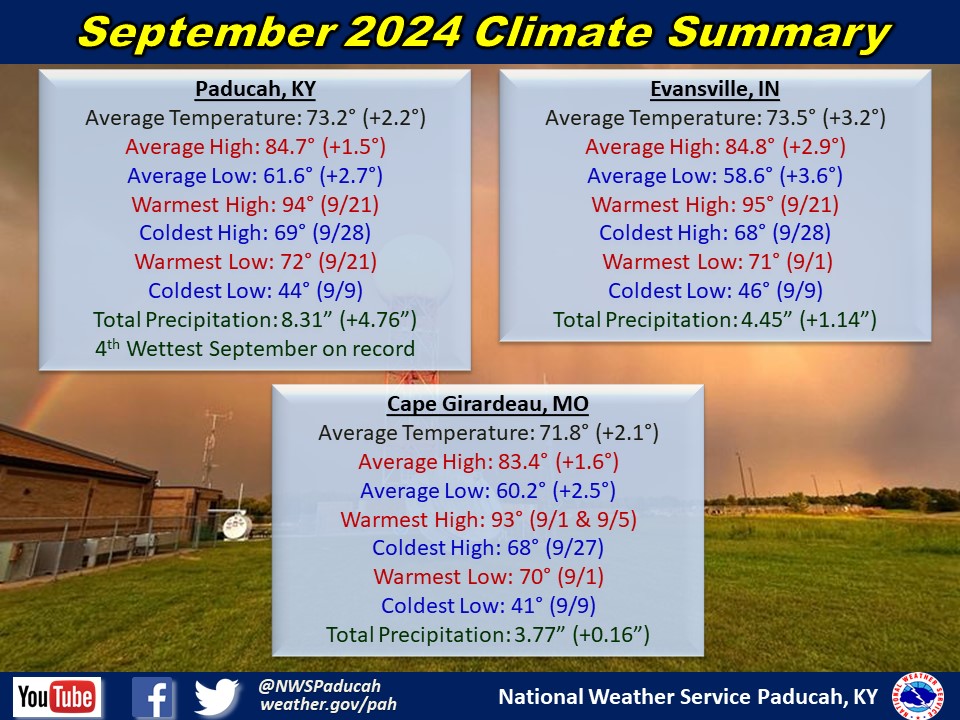
Temperatures averaged 2 to 3 degrees above normal for September. Temperatures began the month near normal. A well below normal stretch followed from the 7th to 9th with temperatures 9-13 degrees below normal. Multiple record lows were set including 3 consecutive days at Cape Girardeau and 2 at Paducah. Despite being a month that typically gets cooler later in the month, all 5 climate sites had their coldest low this September on the 9th. Near normal temperatures returned with the remnants of Hurricane Francine. An extended period of days 5-10 degrees above normal spanned the 15th to 23rd. Evansville and Paducah picked up their warmest day of the month during this stretch with highs in the mid-90s on the 21st. The arrival of Hurricane Helene’s remnants brought cooler high temperatures but much warmer than normal low temperatures for the end of the month.
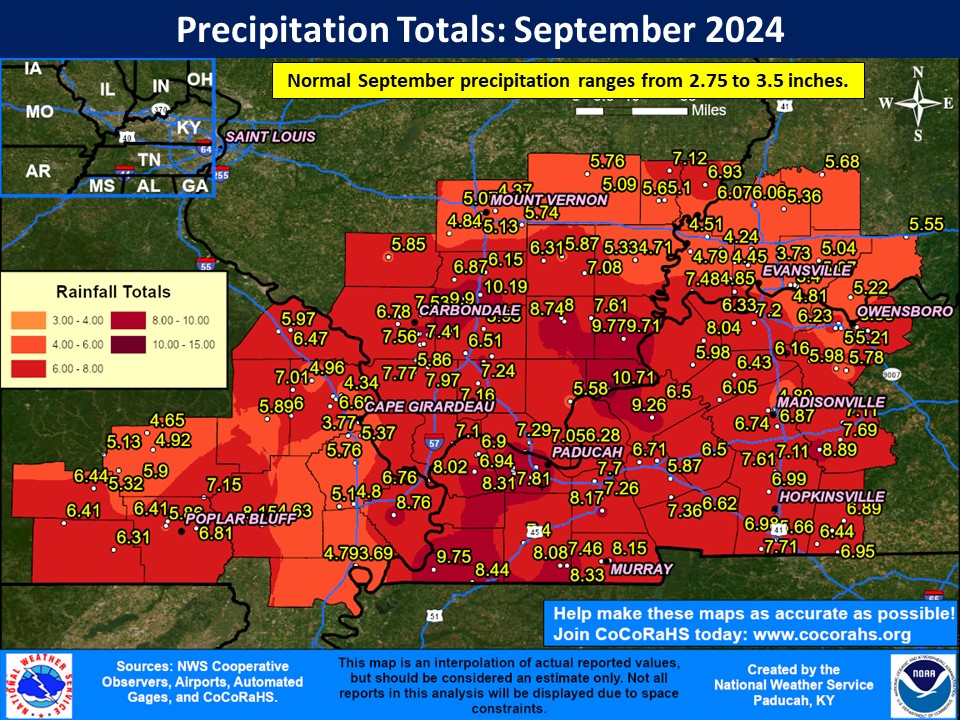
Precipitation averaged wetter than normal across the region with amounts generally between 5 to 8’’. This was roughly double the normal precipitation for September. Southwest Indiana, the I-64 corridor, and portions of Southeast Missouri were on the lower side at 4 to 6’’. A line from near Carbondale to West Frankfort, Illinois received the highest amounts, with a COOP site in Plumfield, Illinois recording the highest observed amount at 11.49’’. Far Southeastern Illinois and far Southwestern Kentucky also had locations exceed 9’’. D2 (Severe Drought) drought had expanded into the forecast area through the first 3 weeks of September as conditions were fairly dry aside from a few localized rainfall events. The remnants of Hurricane Francine mid-month brought limited relief. Heavy rainfall late evening on the 23rd extended from Carbondale to West Frankfort. Remnants of Hurricane Helene brought steady rainfall towards the end of the month, mainly on the 27th, including the 2nd wettest September day on record at Paducah. Rainfall totals from Helene were 2 to 6’’ with the higher totals generally in Western Kentucky and nearby portions of Southeast Illinois and Southwest Indiana. Flooding impacts were limited as rain was spread throughout the day; however, softening soils coupled with gusty winds resulted in several trees being downed across the Quad State. Drought conditions improved to only having D0 (Abnormally Dry) remaining in the southeastern half of the Quad State for the start of October.
The graphic below is an interpolated monthly rainfall map using actual observations. Please note that there are likely discrepancies in between observations, since the values are estimated based on nearest reports.
| August 2024 Review: Precipitation and Temperature Maps (Click on image to enlarge) |
 |
| Climate Maps are from the Northeast Regional Climate Center |
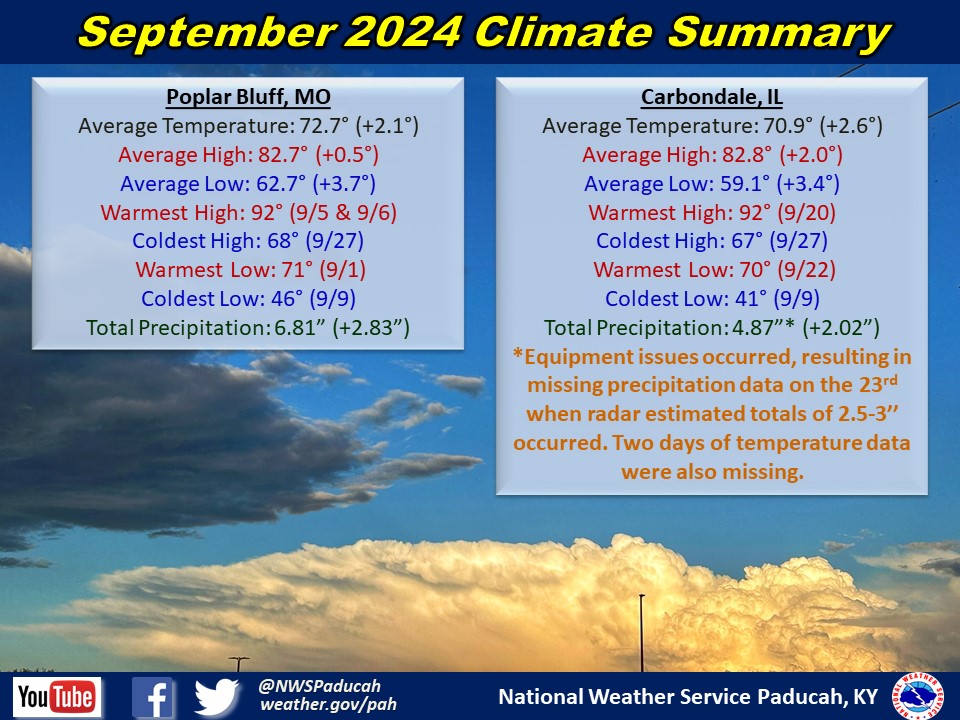
Monthly Climate Report: Paducah | Evansville | Cape Girardeau | Poplar Bluff | Carbondale