Paducah, KY
Weather Forecast Office
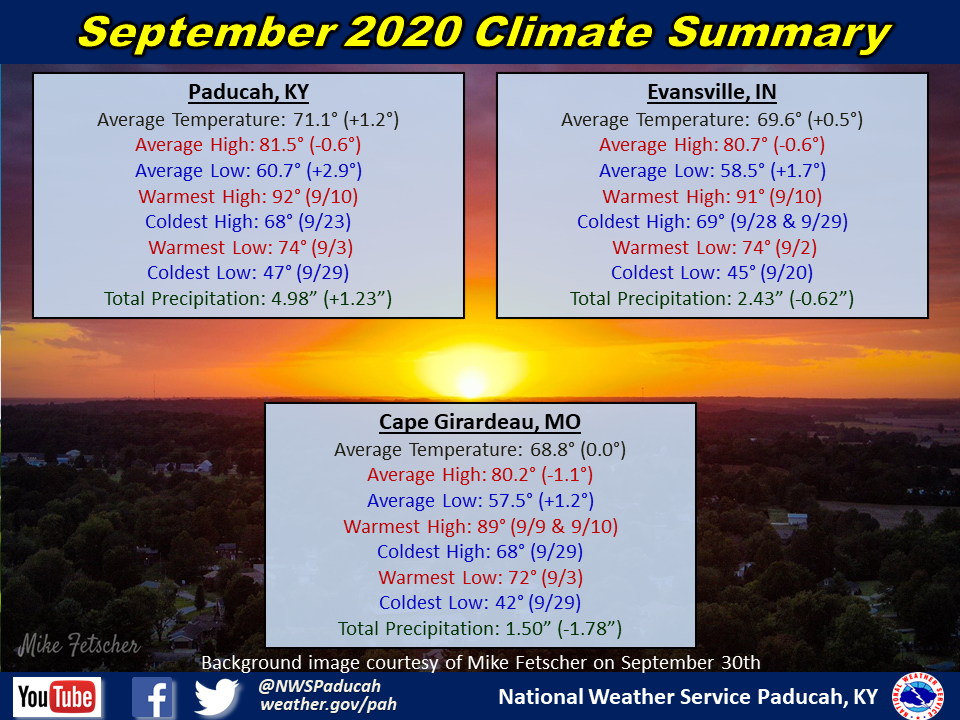
September 2020 Climate Review: Temperatures finished near to slightly above normal. The first 2 weeks averaged warmer than normal while the last 2 weeks of the month flipped to cooler than normal. Paducah observed 4 straight days in the 90s from September 8-11 and exceeded 80 degrees every day for the first 17 days of the month. The pattern flipped on September 18, with upper 60s and 70s for highs occurring much of the rest of the month. Lows dipped into the mid 40s to low 50s on many nights over the final 2 weeks as well.
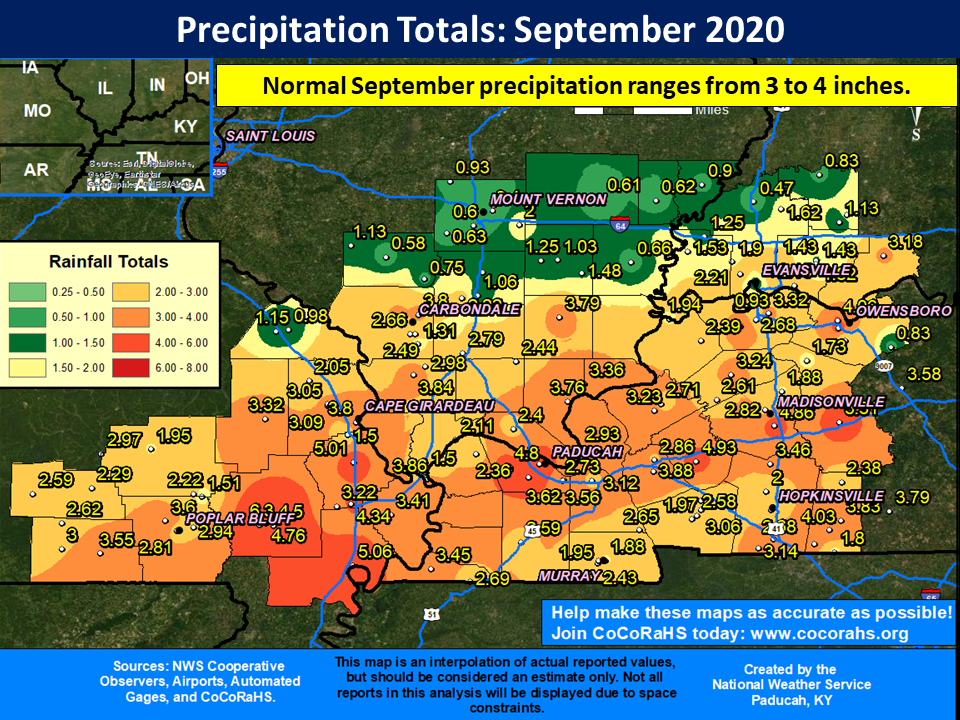
September was drier than normal across the majority of the region. This was most pronounced across northern portions of southern Illinois and southwest Indiana, where many locations only picked up 0.5” to 1” for the entire month. By the October 1 drought monitor update, abnormally dry conditions (D-0) had developed along the I-64 corridor. There were exceptions to the dry conditions though, with southern portions of southeast Missouri into parts of western Kentucky registering a wetter than normal September. This included Paducah, which recorded nearly 5 inches.
The graphic below is an interpolated rainfall map using actual observations. Please note that there are likely discrepancies in between observations, since the values are estimated based on nearest reports.
| September 2020 Review: Precipitation and Temperature Maps (Click on image to enlarge) |
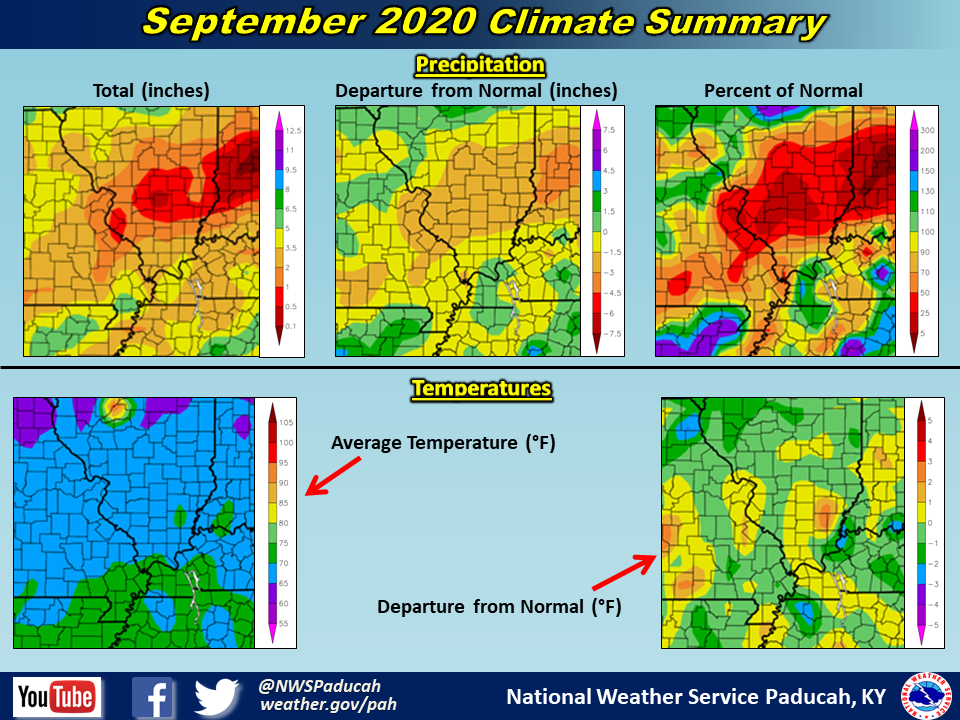 |
| Climate Maps are from the Northeast Regional Climate Center |
FORECASTS
Forecast Discussion
User Defined Area Forecast
Hourly Forecasts
Fire Weather
Activity Planner
LOCAL INFORMATION
Aviation Weather
Our Office
SKYWARN
Items of Interest
Hazardous Weather Support
Local Observations
Weather History
NWS Paducah KY Weekly Partner Briefing
US Dept of Commerce
National Oceanic and Atmospheric Administration
National Weather Service
Paducah, KY
8250 Kentucky Highway 3520
West Paducah, KY 42086-9762
270-744-6440
Comments? Questions? Please Contact Us.