Overview
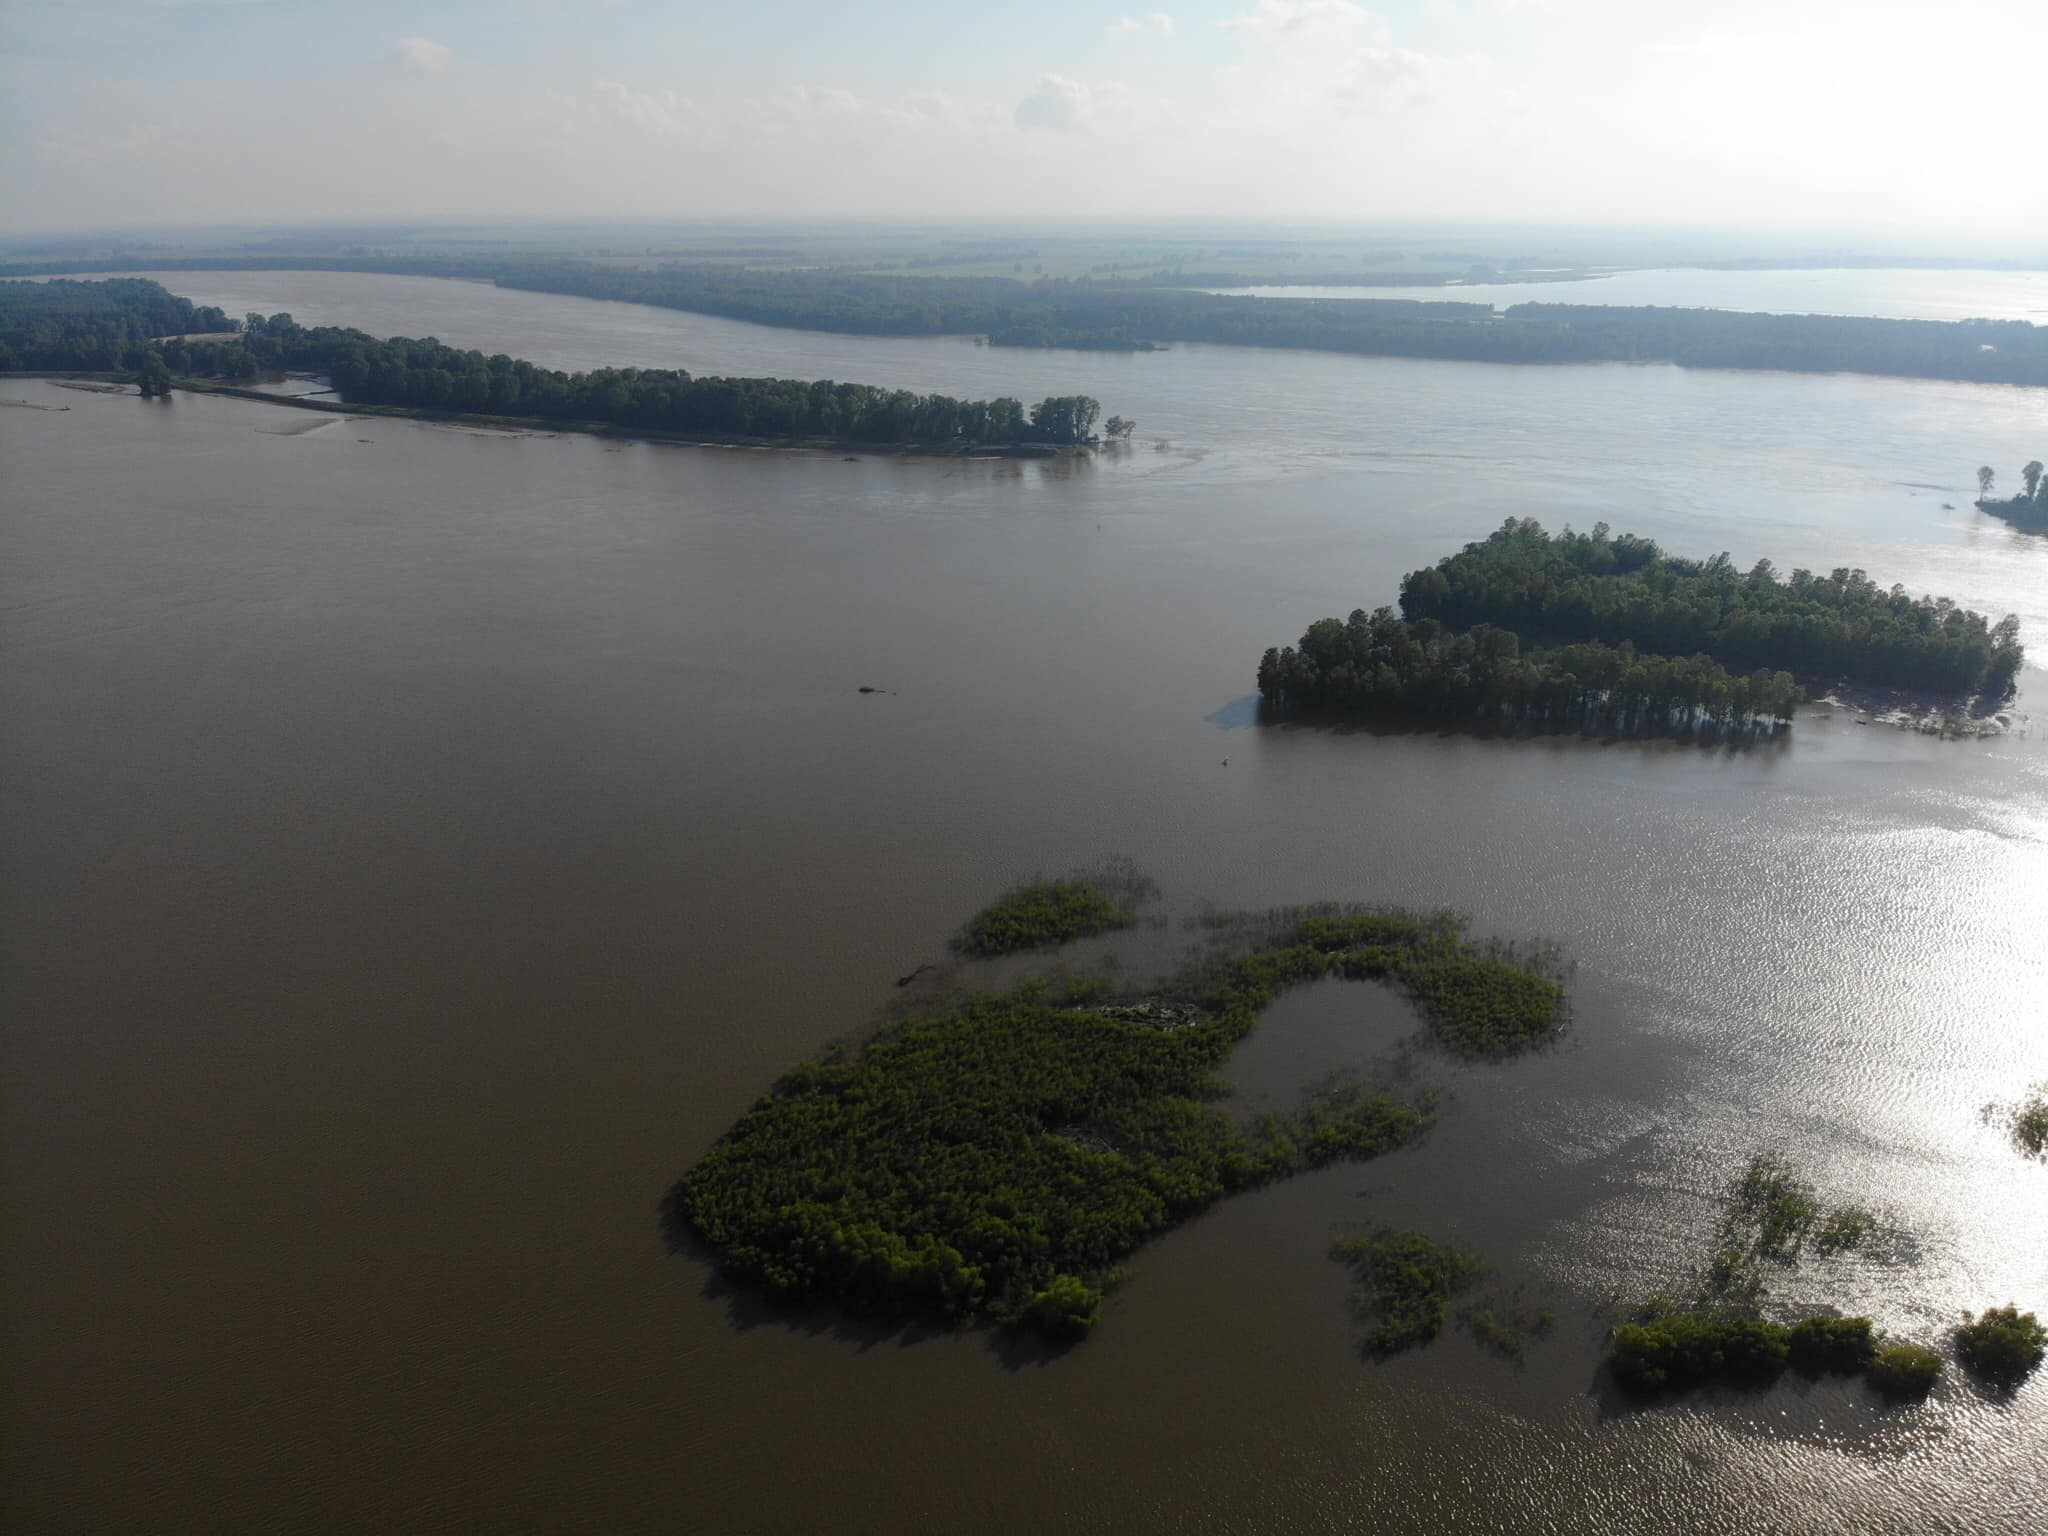
Major flooding occurred along the Mississippi River in June 2019. However, river levels were above flood stage from March through early August due to relentless heavy rain that occurred over our region and locations upstream to our north and west. Cape Girardeau, MO spent 145 days above flood stage and the majority of this time was spent above the moderate flood stage level. Cape Girardeau experienced their 5th highest crest on record, only two and a half feet below the record set back in January 2016.Flooding
Major flooding occurred along the Mississippi River in June. Due to relentless heavy rain over the basin and points upstream during the spring and into the summer months, river levels remained above flood stage for a very long period of time. Crests at Cape Girardeau, MO and Thebes, IL occurred in early June.
 |
 |
| Major flooding at Cape Girardeau in June 2019 | Major flooding at Thebes, IL in June 2019 |
 |
Photos
 |
 |
 |
 |
| Mississippi River at Cape Girardeau, MO in early June | East Cape Girardeau, IL along Hwy 146 | Mississippi River at Thebes, IL on June 30 | Miller City, IL flooding in Alexander County on July 18 |
 |
 |
 |
 |
| Miller City Road washed out and surrounded by sand-covered farm fields | Len Small Levee break causes flooding in Alexander County | Two beached barges remain on farmland in Alexander County on August 11 | Confluence of Ohio and Mississippi Rivers at Fort Defiance State Park in June |
All images above are courtesy of drone footage from Michael Schulz.
Rainfall
The year started off wet with excessive rainfall amounts observed over the Tennessee and Ohio River Valleys in February. The heavy rain zone seemed to gradually move northward through the spring months. A very wet May was the icing on the cake that caused river levels to rise further along an already swollen Mississippi River.
During May, the heaviest swath of rain was observed northwest of our region across Kansas and the mid Missouri River valley area. However, our region still experienced a very wet May, and some locations observed their wettest May on record, including in Paducah. The graphic below shows the monthly precipitation departure from normal for every month from January through July. Notice how the green, blue, and purple shades, representing above normal precipitation, remained over nearly our entire forecast area each of the 7 months.
 |
| Monthly Precipitation Departure from Normal January - July 2019 |
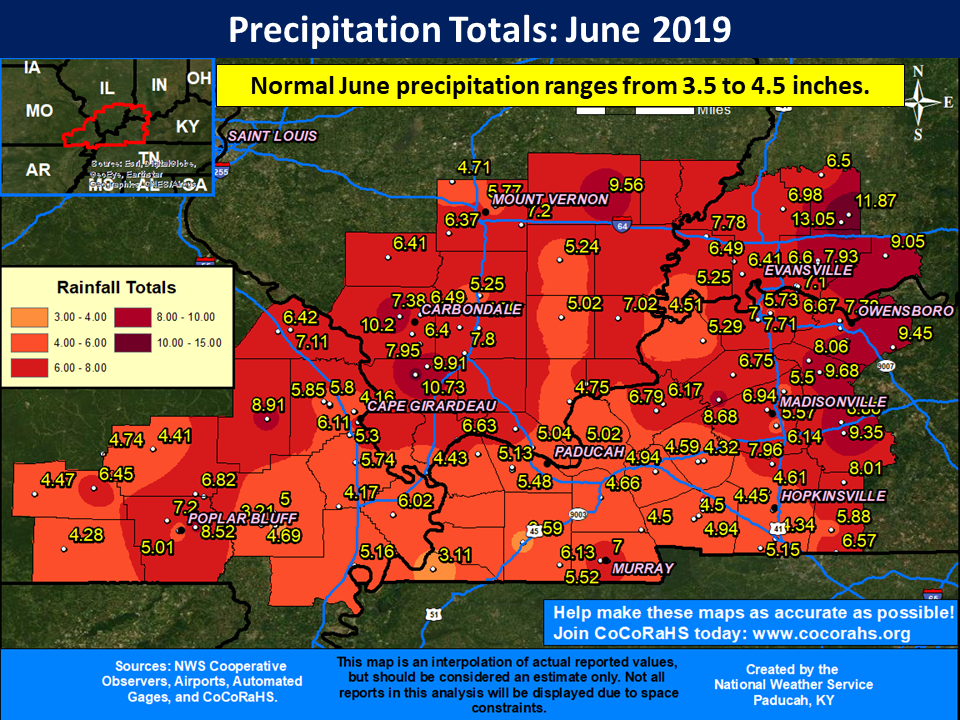
Here are the observed rainfall amounts during May and June across our area. Heaviest amounts in May were concentrated over southeast Missouri, southern Illinois, and far west Kentucky. They tended to migrate northeastward towards the Evansville Tri-state region and the northern Pennyrile of western Kentucky in June.
 |
 |
| Rainfall Totals May 2019 | Rainfall Totals June 2019 |
 |
Media use of NWS Web News Stories is encouraged! Please acknowledge the NWS as the source of any news information accessed from this site. |
 |