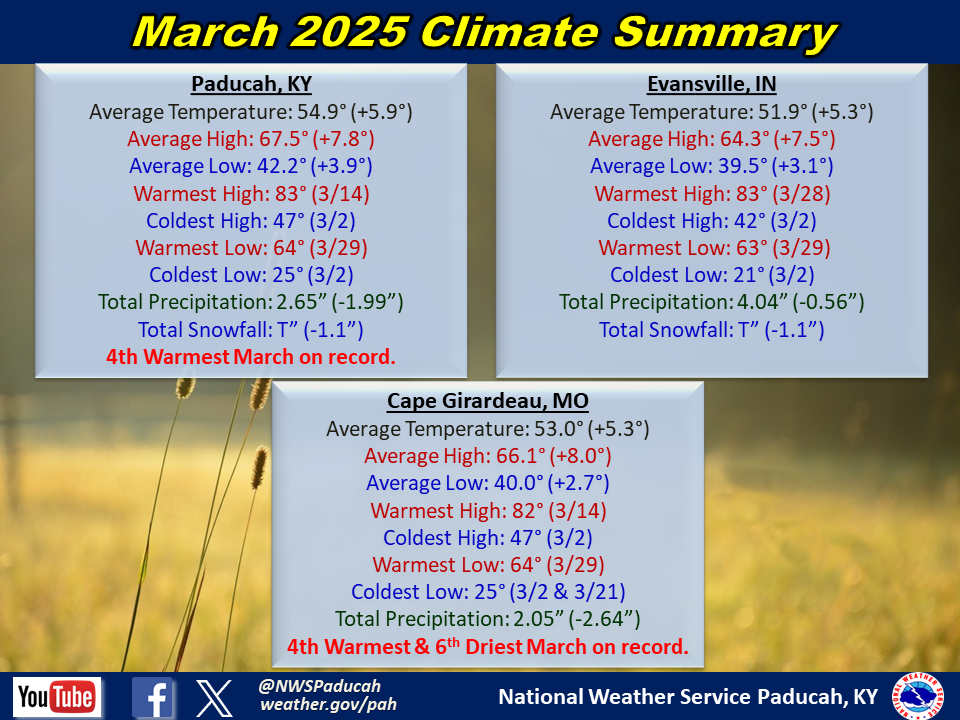
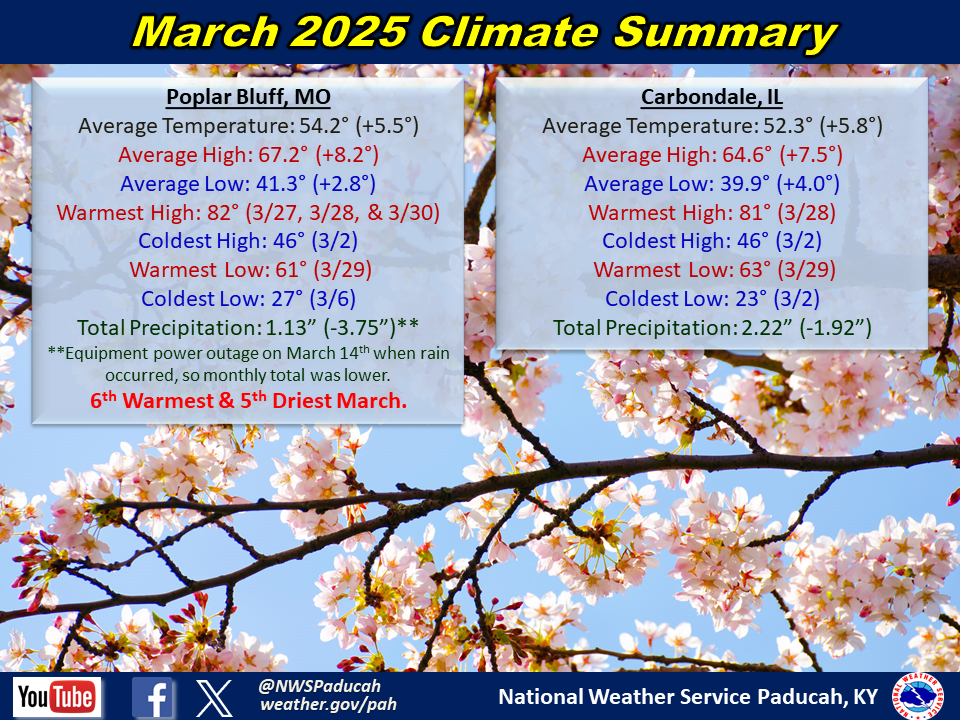
March 2025 Climate Review:
Temperatures finished above normal by 5 to 6 degrees. There were brief cool periods on March 2, 6, 16-17, and 20-21. Lows dipped into the 20s or low 30s on these days. Otherwise temperatures were largely above normal most days. The warmest periods were focused around the 11-15, 18-19, and 28-30. High temperatures were primarily in the 70s to low 80s on these days, including a few record highs being broken. It was the 4th warmest March on record in Paducah and Cape Girardeau and 6th warmest March in Poplar Bluff.
Precipitation averaged drier than normal across southeast Missouri, southern Illinois, and a large portion of western Kentucky (especially areas along and west of the Lakes). These areas only received rainfall amounts 1.5 to 3.5 inches, which was roughly 1 to 3 inches drier than normal. It was the 6th driest March on record in Cape Girardeau. Meanwhile, it was slightly wetter than normal across southwest Indiana and into the Pennyrile region of West Kentucky where amounts were largely in the 4 to 6 inch range. This was right near normal to about 2 inches wetter than normal.
There were 2 significant severe thunderstorm events that impacted the region during the month. The first was a tornado outbreak from the evening of the 14th into early morning on the 15th. There were a total of 14 tornadoes with this event including 6 EF-3’s, which was the most in any one event in our office history. Another severe thunderstorm event impacted the region March 30th with very large hail, damaging winds, and 2 EF-1 tornadoes.
The graphic below is an estimated multi-radar, multi-sensor (MRMS) monthly rainfall map using a combination of radar estimates and actual observations. Please note that actual rainfall observed at any location may vary slightly due to potential error in radar estimation and observation interpolation.
| March 2025 Review: Precipitation and Temperature Maps (Click on image to enlarge) |
 |
| Climate Maps are from the Northeast Regional Climate Center |


Monthly Climate Report: Paducah | Evansville | Cape Girardeau | Poplar Bluff | Carbondale