June 2024 Climate Review:
Temperatures were slightly above normal by around 1 to 1.5 degrees. Most of the region experienced a rain-cooled day on the 1st with highs only in the upper 60s and 70s east of the Mississippi River. A warmer period followed from the 2nd through the 8th with highs in the 80s and a few locations even reached 90 on the 3rd. Below normal temperatures were experienced from the 9th through 13th with lows falling into the 50s most nights (even a few upper 40s). A couple of days were only in the 70s for highs but then largely diurnal swings were observed by the 12th and 13th as dry air allowed afternoon temperatures to reach the mid to upper 80s. The vast majority of the period from the 14th through 30th was above normal with highs in the 90s many of these days and overnight readings in the upper 60s to mid 70s. The warmest day of the month was the 26th when highs soared into the mid to upper 90s (even hit 100 in Perryville, MO and Mount Vernon, IL), which combined with oppressive humidity to create heat index readings of 105 to 110 and localized readings to 115.
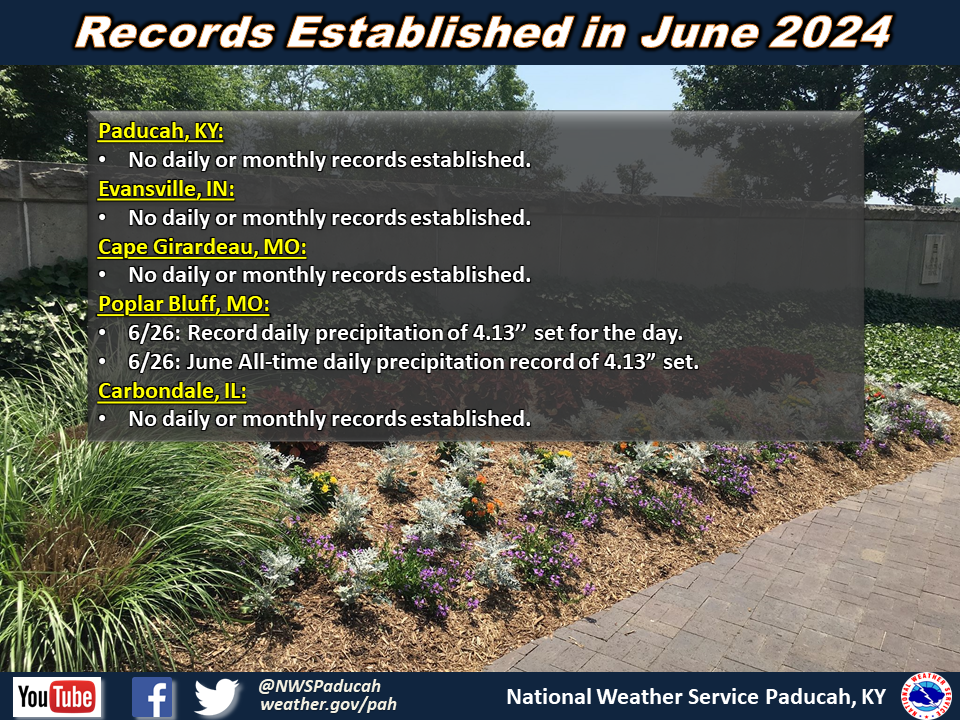
Precipitation was wetter than normal across much of southeast Missouri, the Jackson Purchase area of west Kentucky, and far southern Illinois. Amounts largely ranged from 4 to 7 inches in these areas, but some higher amounts over 8 inches were observed. The highest reported total was 8.85” at a CoCoRaHS station 2.3 miles west of Dexter, MO. Poplar Bluff recorded 4.13” of rain on the 26th alone. This broke their all-time wettest June day on record which was previously 4.00” set on June 4, 1928. Meanwhile it was a drier than normal month for southwest Indiana, northwest Kentucky, and areas of southern Illinois north of Route 13 with most of this region only observing between 1.5 to 3 inches.
The graphic below is an interpolated monthly rainfall map using actual observations. Please note that there are likely discrepancies in between observations, since the values are estimated based on nearest reports.
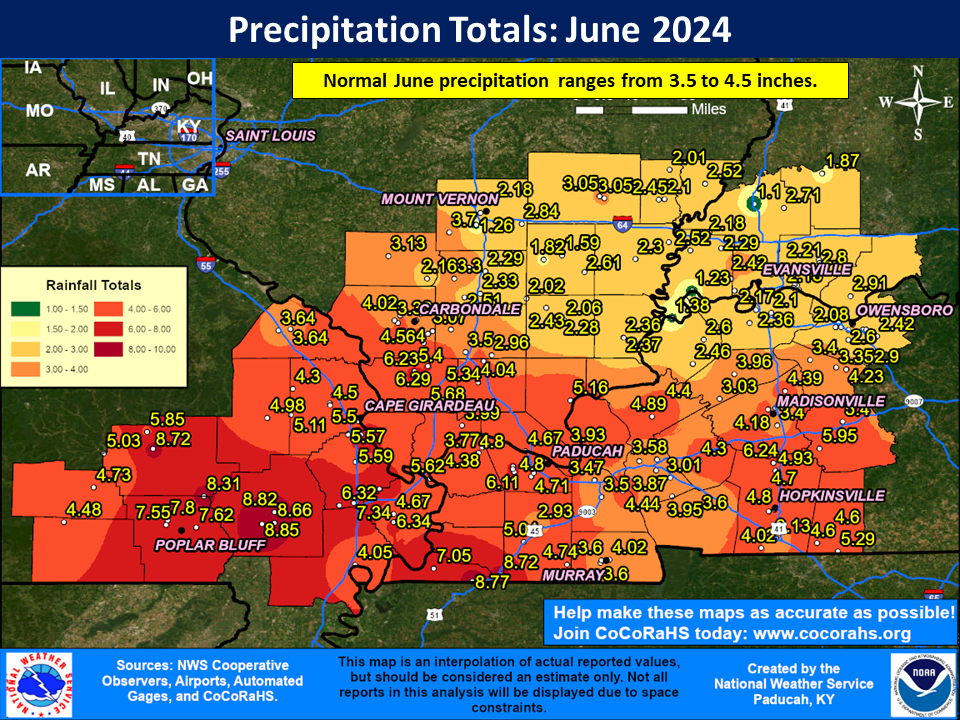
| June 2024 Review: Precipitation and Temperature Maps (Click on image to enlarge) |
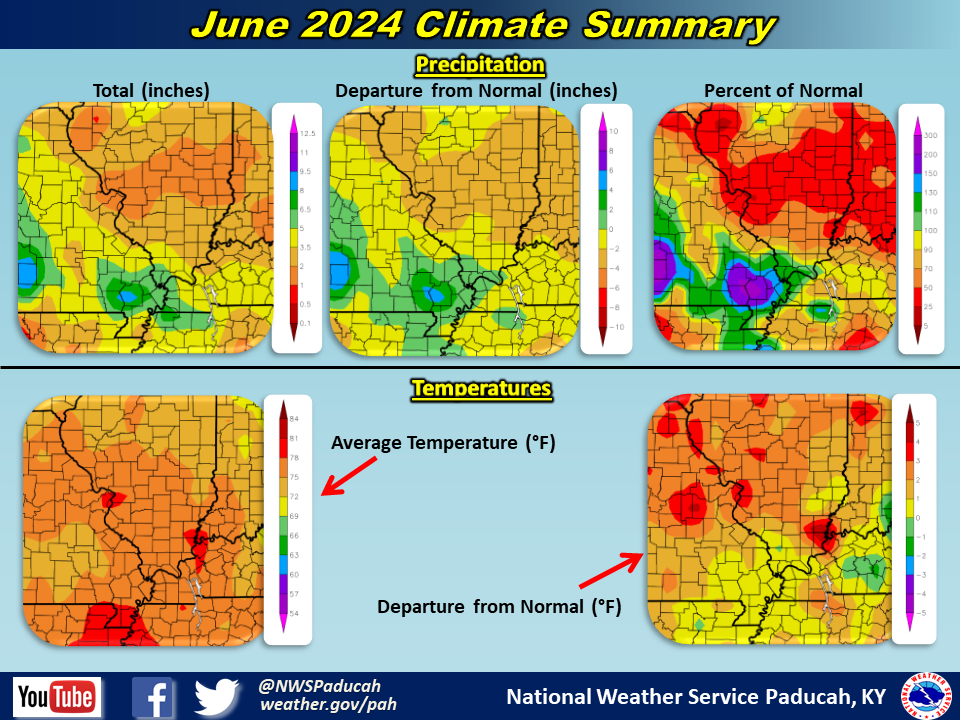 |
| Climate Maps are from the Northeast Regional Climate Center |
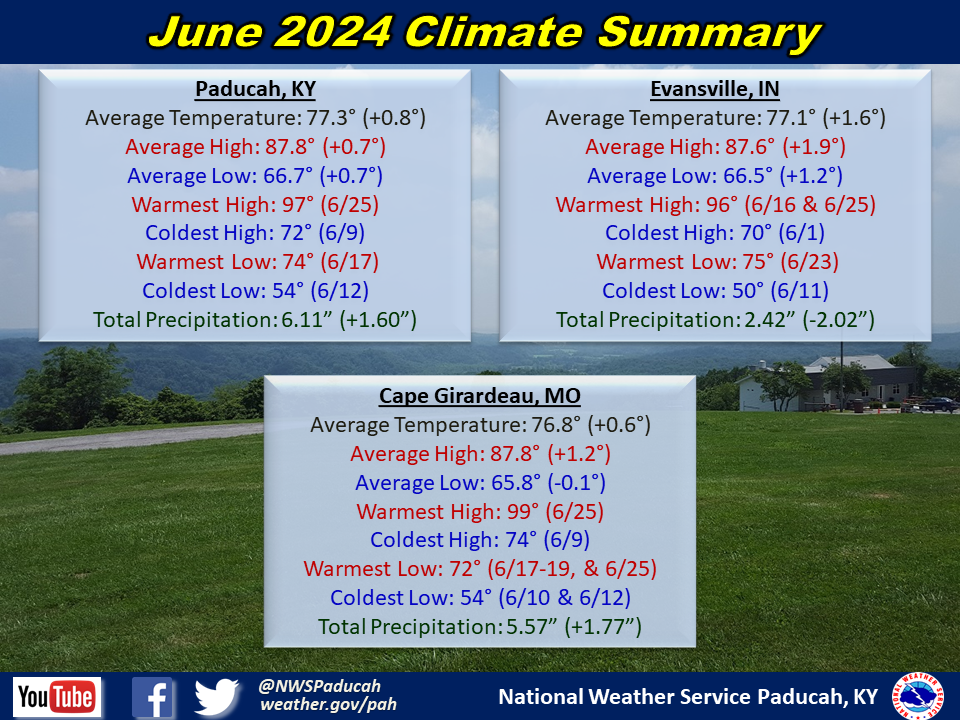
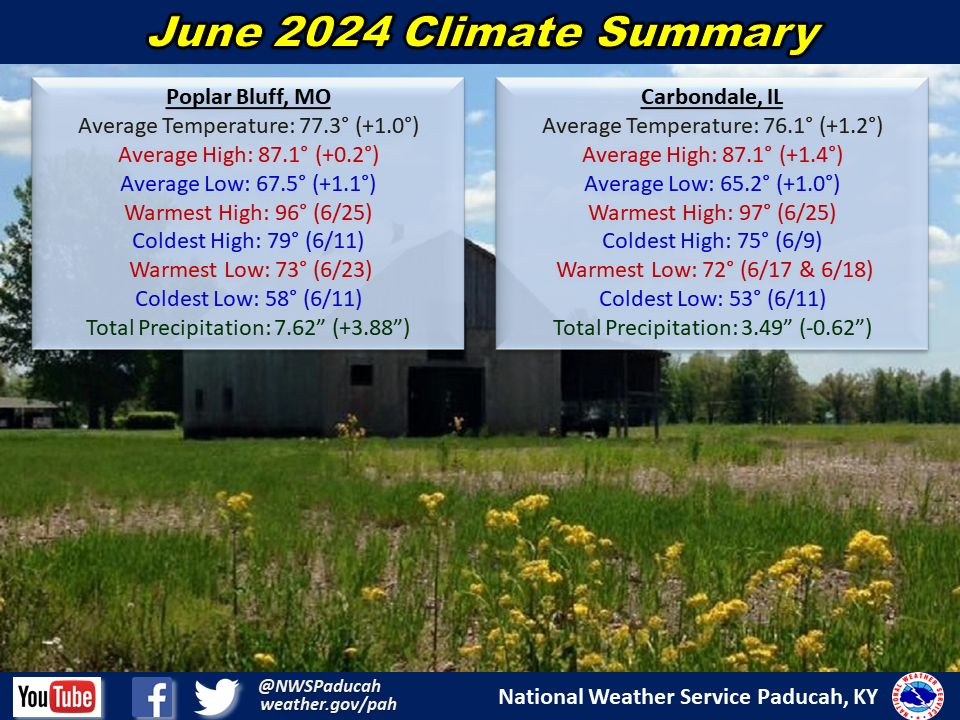
Monthly Climate Report: Paducah | Evansville | Cape Girardeau | Poplar Bluff | Carbondale