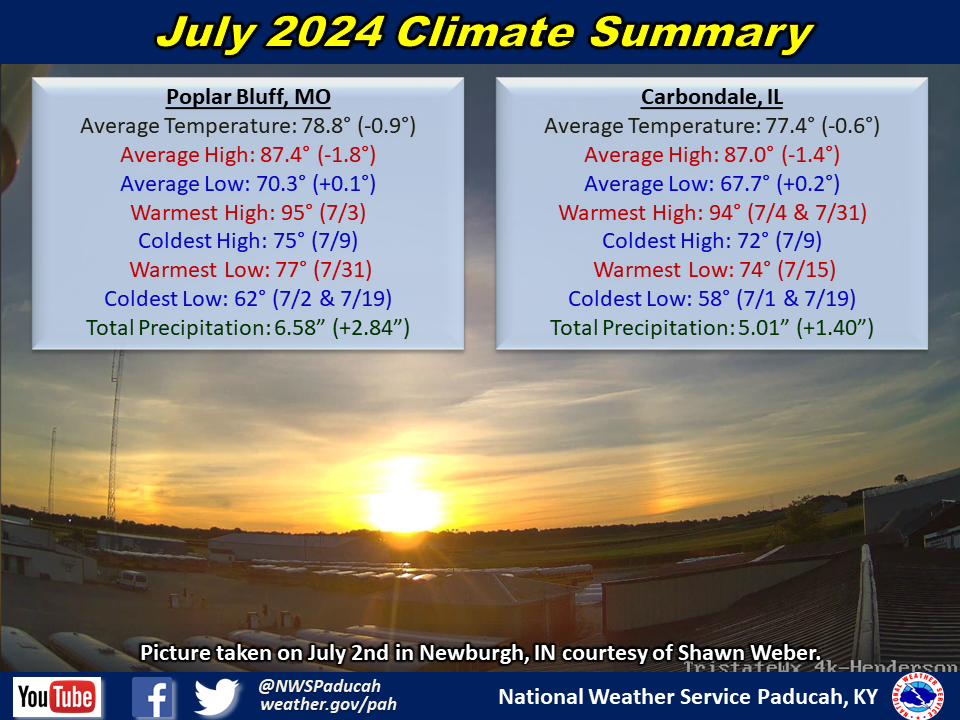
July 2024 Climate Review:
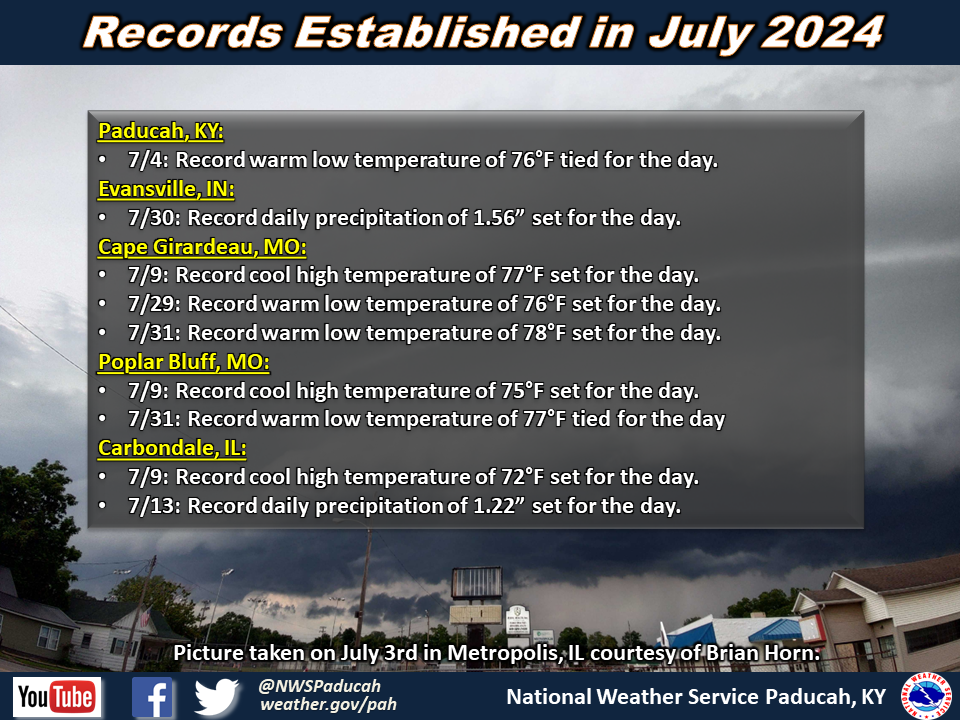
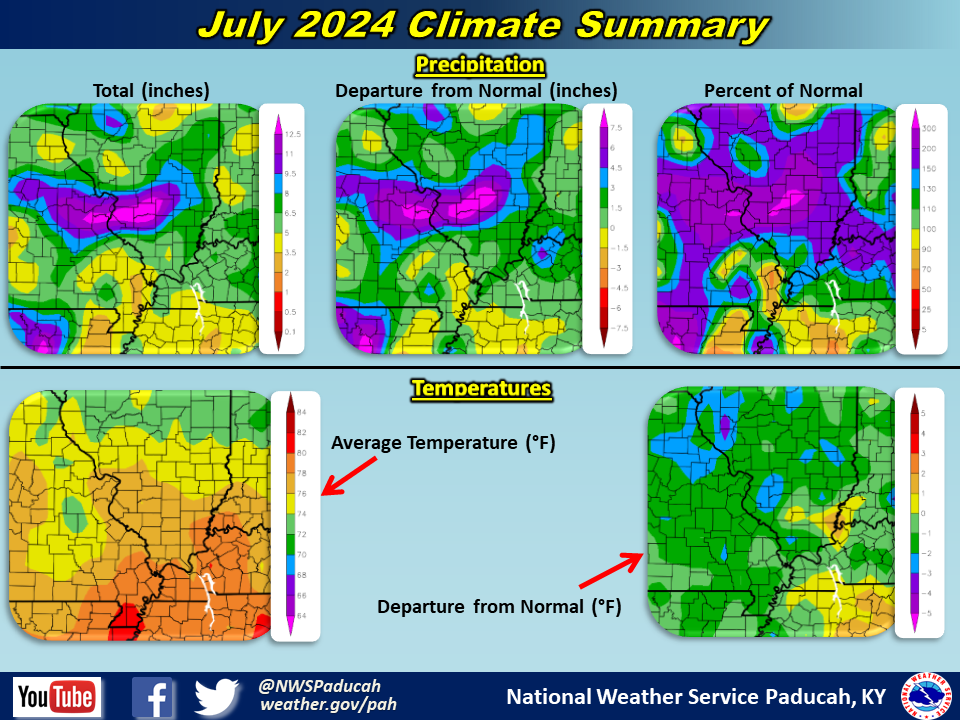
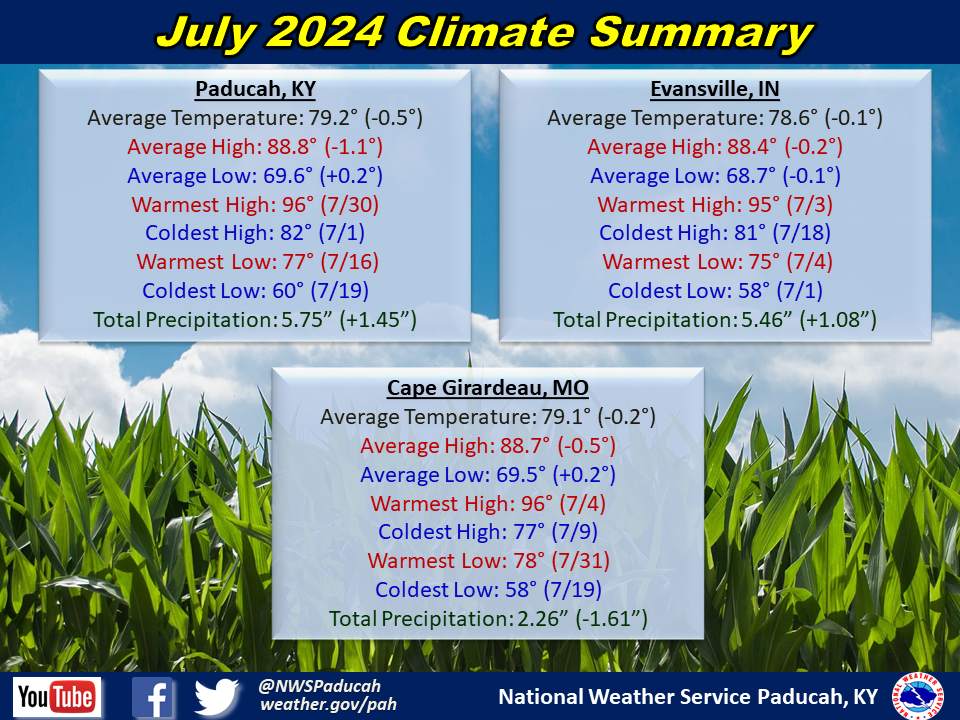
Temperatures averaged slightly below normal by around 0.5 to 1 degree. It was the first month since January in which temperatures finished below normal. There were several days that many areas observed highs only in the low 80s or even cooler, including the 1st, 9th, and 18-19th. Several locations in Missouri and Illinois observed record cool high temperatures on the 9th, only reaching the low to mid 70s due to rain-cooled air. Despite being slightly cooler than a typical July, we still endured several days of oppressive heat and humidity. One of the worst days was actually on the 4th of July when highs in the low to mid 90s combined with dewpoints in the upper 70s to around 80 to produce heat index readings of 105 to 115! Another brutal stretch was observed on the 14th-15th with heat index readings between 100 and 110. The month ended on a toasty note as well, with heat index readings back above 100 from the 29th through 31st. The worst of this stretch was observed on the 30th when widespread readings of 110 to 115 were observed.
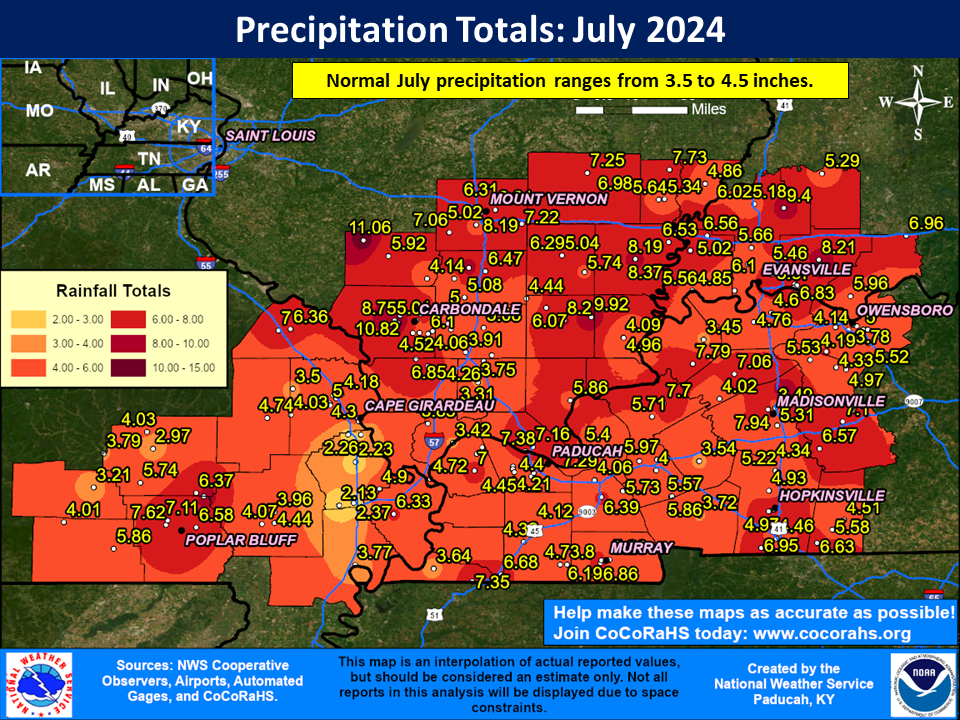
Precipitation averaged near to wetter than normal across much of the region. Amounts generally ranged from 4 to 8 inches in many areas, although some locally higher amounts in excess of 10 inches were observed. The highest amounts tended to be more focused across the north half of the Quad State with lesser amounts to the south. Jackson County, Illinois observed quite the gradient in amounts ranging from 5.01” at the Carbondale Airport to 11.94” at a CoCoRaHS station 0.2 miles NE of Murphysboro (which was the highest total in our area for July). Meanwhile, portions of southeast Missouri observed a drier than normal month. The dryness bullseye was centered over Scott County, stretching from the south side of Cape Girardeau into the Sikeston area, with much of this area only receiving 2 to 2.5 inches. The drier corridor extended south and east into parts of New Madrid and Mississippi counties and also across the river into Carlisle County KY.
Tornadoes are typically rather rare in the month of July in our area, especially strong ones (EF2+). Well, the remnants of Hurricane Beryl ended up producing 7 tornadoes on July 9th, which that number alone was more tornadoes than any other July on record. One of those was an EF-3 (Mount Vernon, Indiana), which became the strongest tornado in documented history for our area in the month of July (1950 - present).
The graphic below is an interpolated monthly rainfall map using actual observations. Please note that there are likely discrepancies in between observations, since the values are estimated based on nearest reports.
| July 2024 Review: Precipitation and Temperature Maps (Click on image to enlarge) |
 |
| Climate Maps are from the Northeast Regional Climate Center |
Monthly Climate Report: Paducah | Evansville | Cape Girardeau | Poplar Bluff | Carbondale