January 2025 Climate Review:
Temperatures finished below normal by 3 to 5 degrees. Most of the first 15 days of the month were below normal with highs in the 20s and 30s commonplace. A brief warmup into the 50s occurred on the 16th and 17th. This was followed by the coldest air of the month during the 19th through 22nd. Lows fell into the single digits during this time with highs only in the teens or low 20s a couple of these days. Wind chills were below 0 each morning during this period, with coldest readings down to -10. Much warmer weather greeted the region from the 25th through 31st with highs back into the 40s and 50s most days. The warmest day of the month occurred on the 29th or 31st with highs in the 60s in many areas.
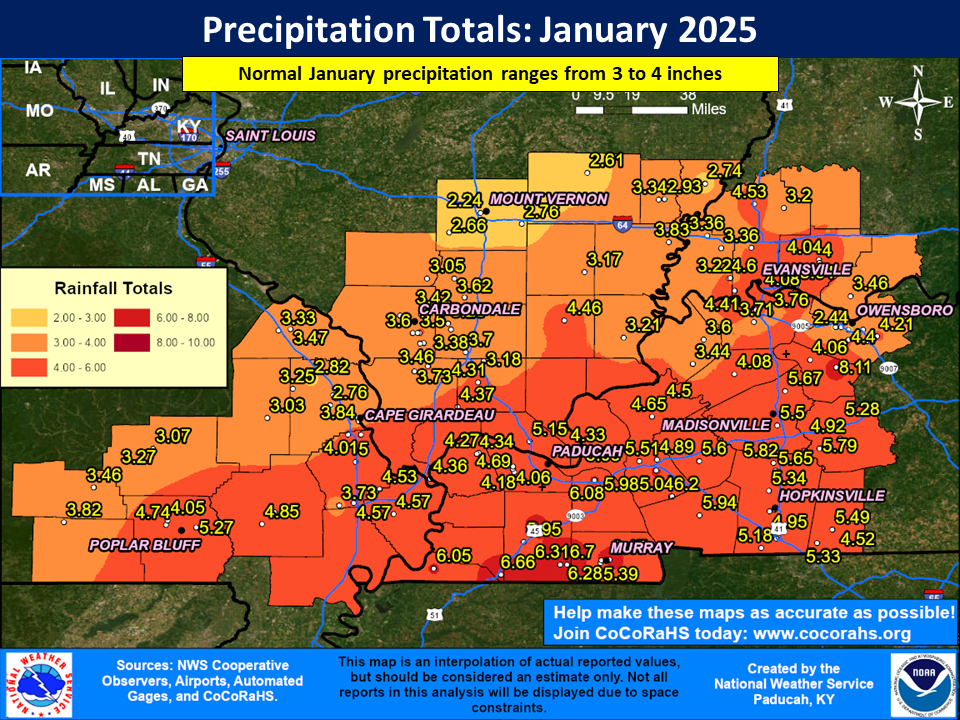
Precipitation averaged wetter than normal across much of southeast Missouri, western Kentucky, and far southern Illinois. These areas received anywhere from 4 to 7 inches, which was 0.5 to 3 inches wetter than normal. Meanwhile, the driest areas were located across southern Illinois and southwest Indiana along and north of I-64 where amounts were only 2 to 3 inches, which was up to an inch below normal.
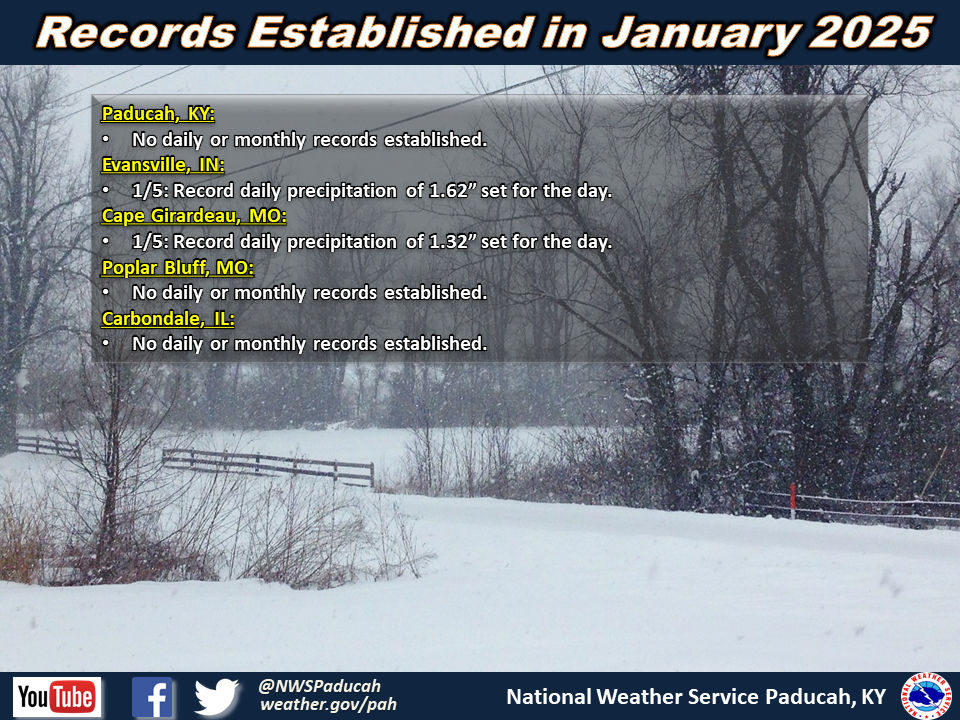
There were two wintry precipitation events that impacted the region. The first was a wintry mix of freezing rain, sleet, and snow on the 5th. Ice amounts ranged from 0.25 to 0.75” across much of the area and up to 100,000 customers were without power at the height of the event. Snow was primarily confined to portions of southern Illinois, southwest Indiana, and far northwest Kentucky. Amounts up to 6 to 7 inches were reported north of I-64. Another wintry event occurred on the 10th. This event produced widespread snowfall totals of 3 to 7 inches. Between them, snow averaged well above normal for the month, especially across northern portions of the region where some locations received over 10”. It was the 7th snowiest January on record in Evansville with 10.3”.
The graphic below is an estimated multi-radar, multi-sensor (MRMS) monthly rainfall map using a combination of radar estimates and actual observations. Please note that actual rainfall observed at any location may vary slightly due to potential error in radar estimation and observation interpolation.
| January 2025 Review: Precipitation and Temperature Maps (Click on image to enlarge) |
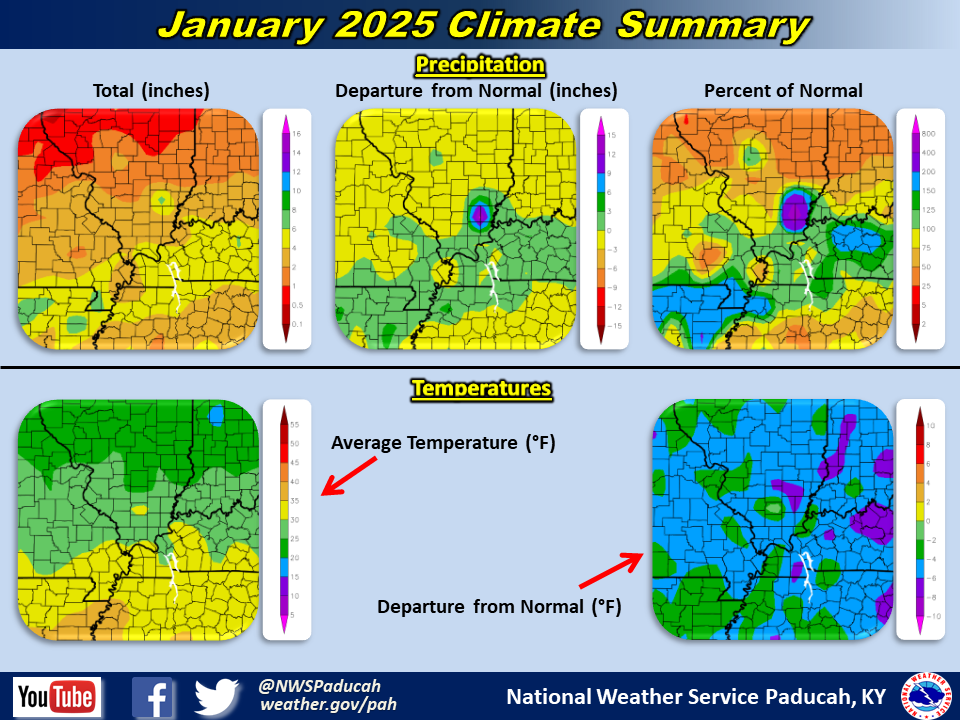 |
| Climate Maps are from the Northeast Regional Climate Center |
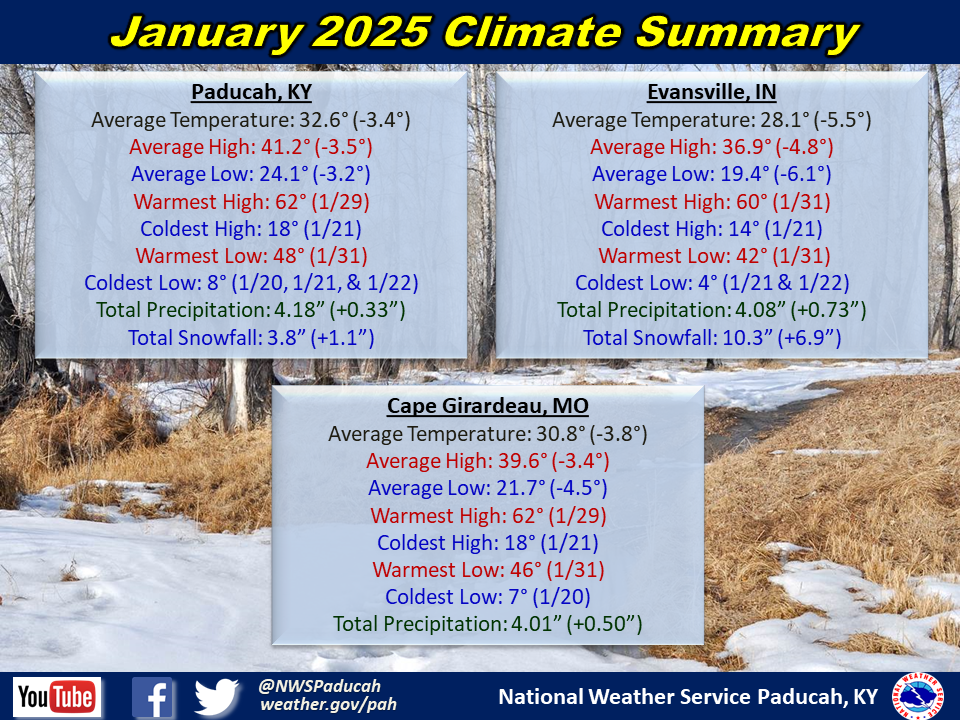
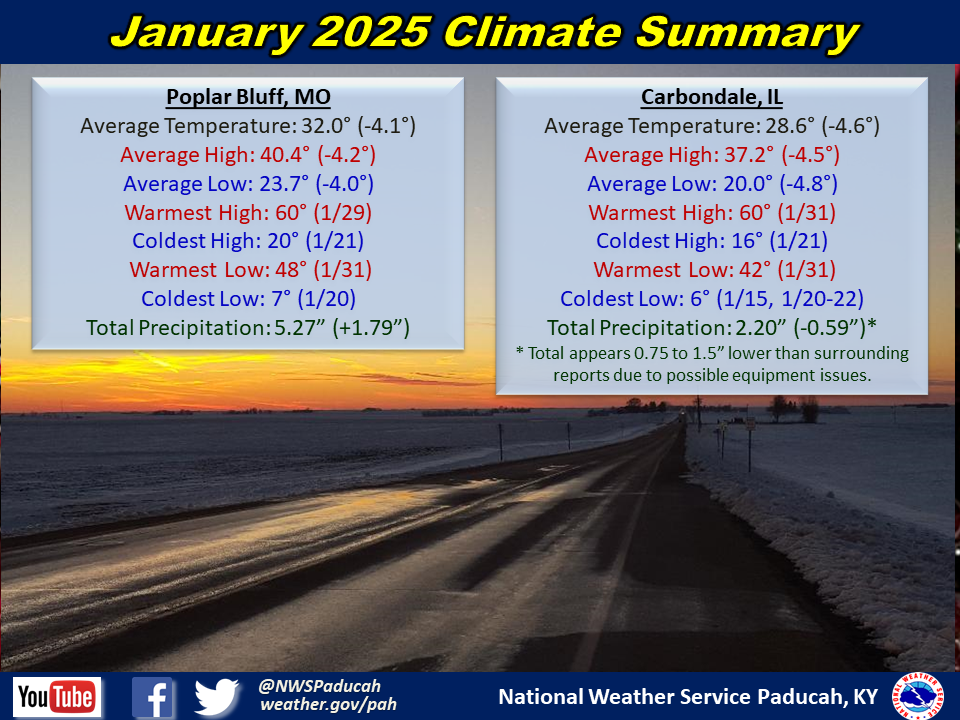
Monthly Climate Report: Paducah | Evansville | Cape Girardeau | Poplar Bluff | Carbondale