August 2024 Climate Review:
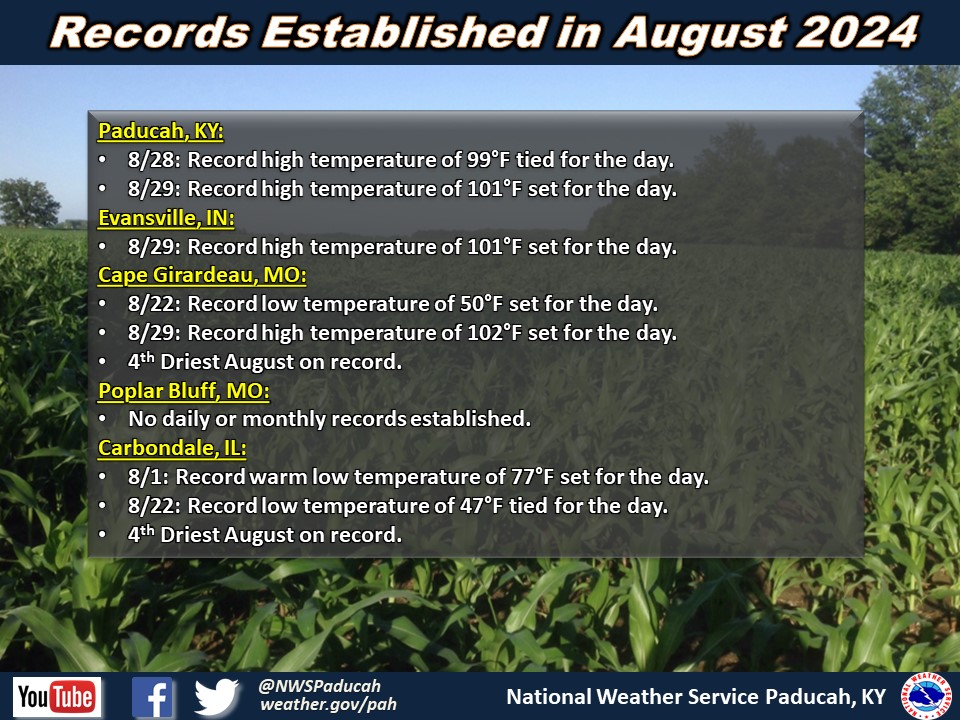
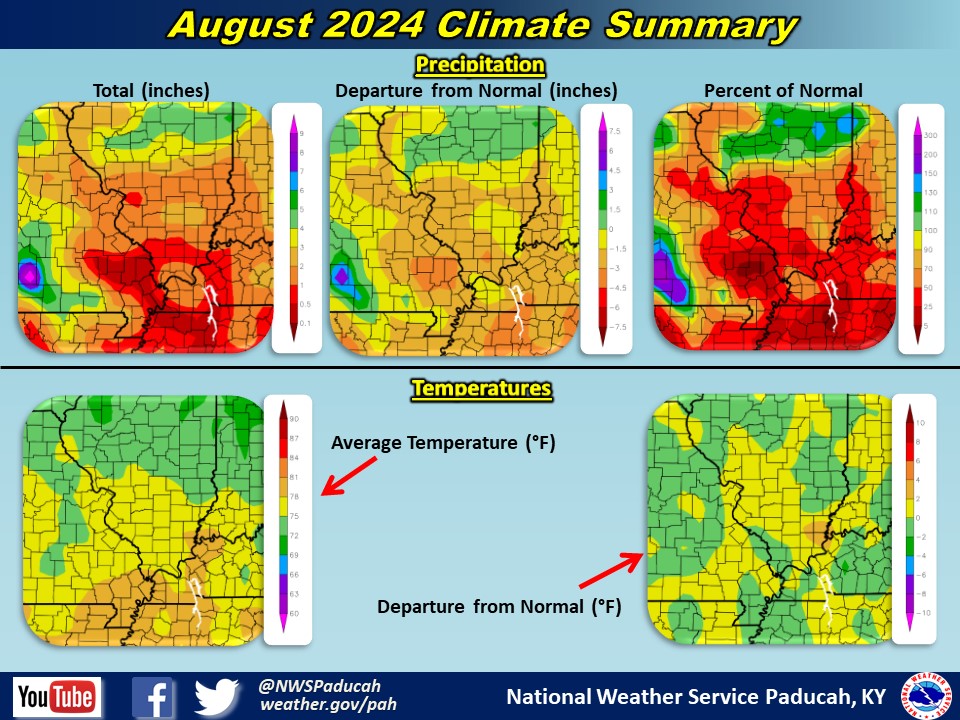
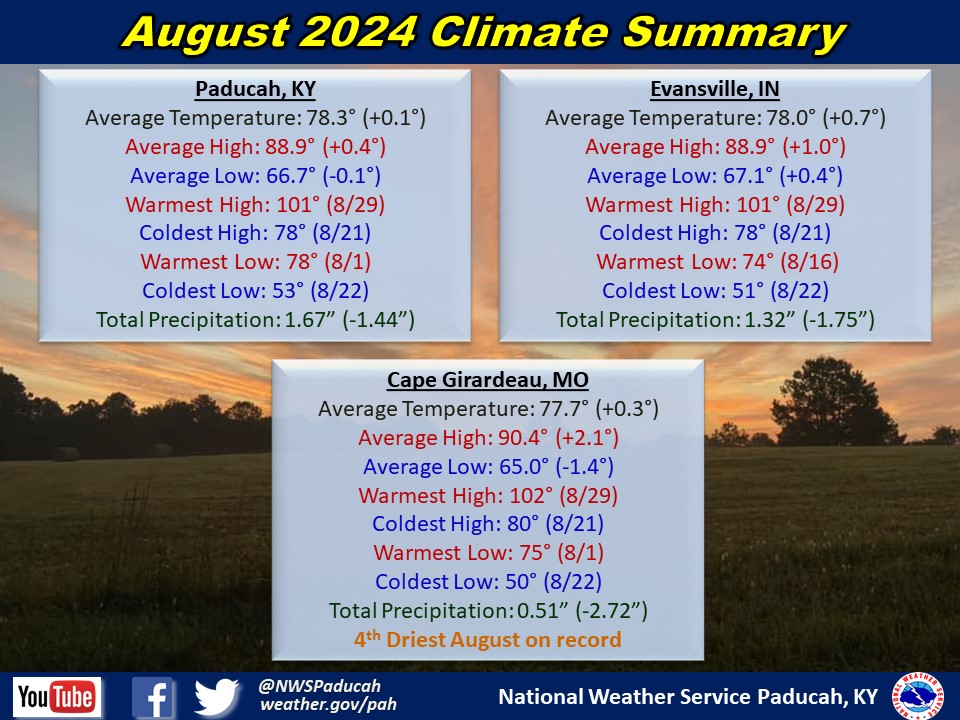
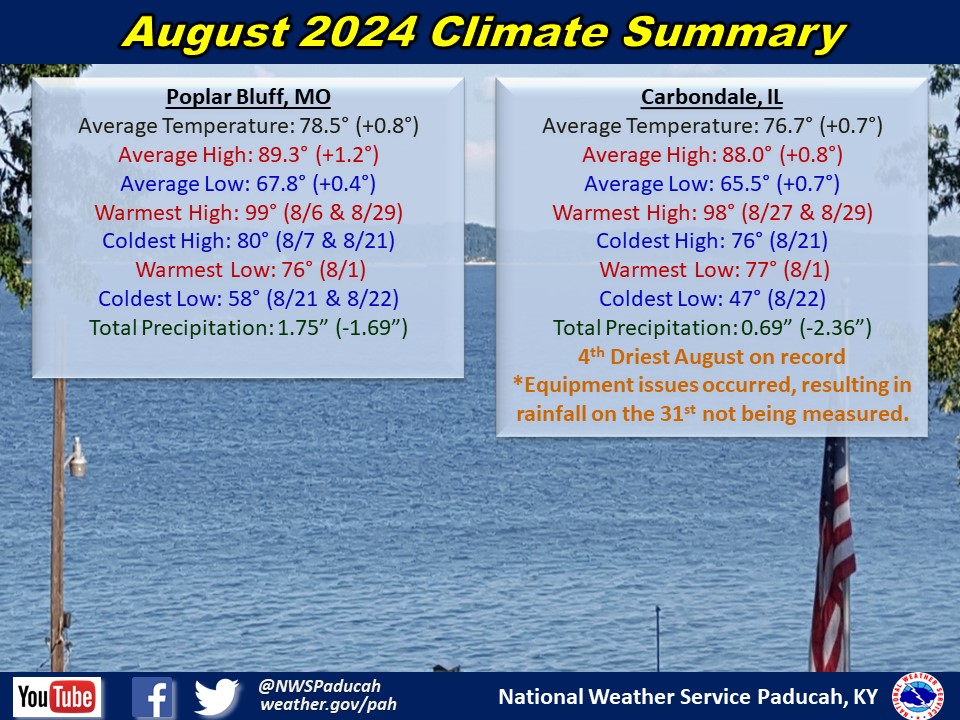
Temperatures averaged right near normal for August. We started the month with highs mostly in the 90s from the 1st through the 6th. A cooler stretch followed from the 7th through 14th with highs in the low to mid 80s most days, A brief heat wave bumped us back into the 90s from the 15th through 17th before another extended cool down greeted us from the 18th through 22nd. The coolest high temperatures of the month occurred on the 21st when readings were only in the mid to upper 70s! Lows fell down into the 50s during much of this time, and several locations even reached the upper 40s on the morning of the 22nd. This included Carbondale which tied a record low of 47. Temperatures then returned to the 90s from the 23rd through 30th, with the stretch from the 26th through 29th particularly hot with readings in the mid 90s to low 100s. Cape Girardeau reached 102 degrees on the 29th, which was their warmest temperature since July 2012. Fortunately humidity levels were lower so heat index readings largely remained under 105. The low humidity also lead to large diurnal temperature swings of 30 to 35 degrees during this time. The last day of the month featured cooler temperatures in the lower half of the 80s due to plenty of clouds and scattered showers and storms.
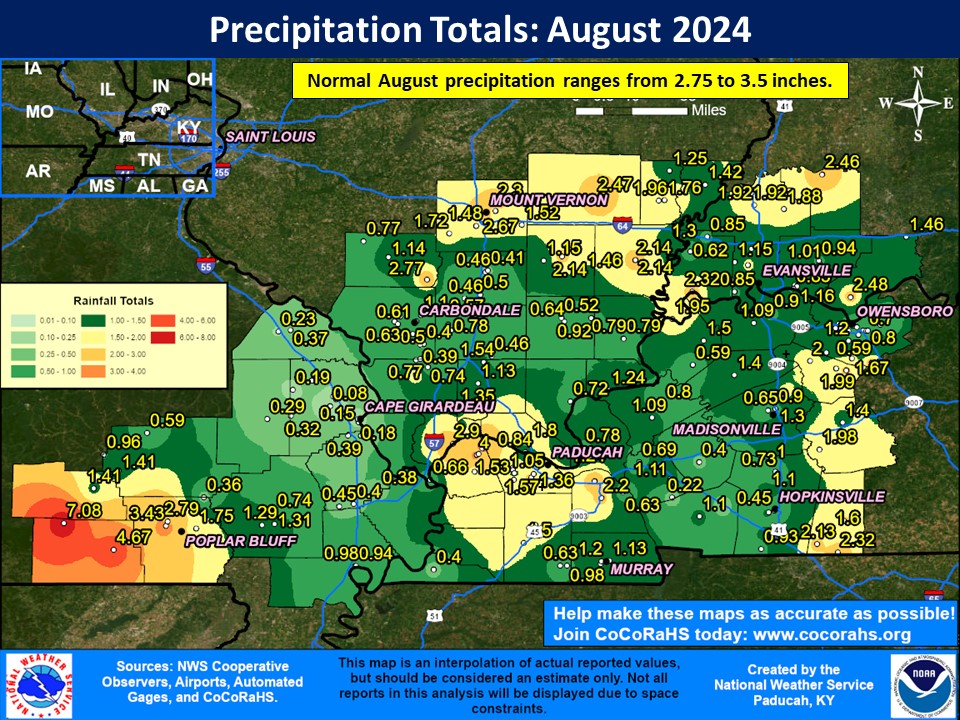
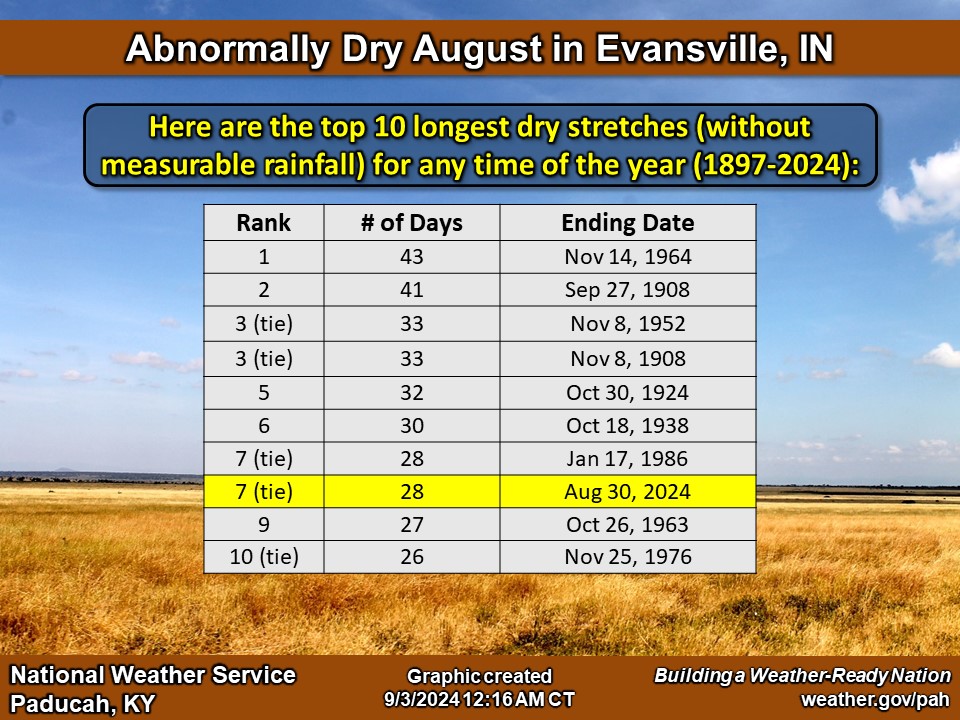
Precipitation averaged drier than normal across most of the region with amounts generally ranging between 0.5” to 2.5”. This was roughly 1 to 2.5” below normal for August. The one exception was across western portions of southeast Missouri from Ripley into parts of Carter and Butler counties. This area received amounts of 3 to 7 inches. The highest observed amount was 7.08” at a CoCoRaHS station in Ripley County Missouri (Doniphan 14.5 NW). Nearly 70% of the region was considered abnormally dry (D0 on Drought Monitor) by the end of the month and a small part of southeast Missouri was in moderate drought (D1). Evansville, Indiana went 28 consecutive days without measurable rain from the 3rd through the 30th before finally recording 0.04’’ on the 31st. This was their longest dry stretch since 1986 which was also 28 days!
The graphic below is an interpolated monthly rainfall map using actual observations. Please note that there are likely discrepancies in between observations, since the values are estimated based on nearest reports.
| August 2024 Review: Precipitation and Temperature Maps (Click on image to enlarge) |
 |
| Climate Maps are from the Northeast Regional Climate Center |
Monthly Climate Report: Paducah | Evansville | Cape Girardeau | Poplar Bluff | Carbondale