Temperatures averaged near to slightly below normal. The month started off hot and humid with highs in the 90s observed 8 of the first 10 days of the month in Paducah and lows only falling in the low to mid 70s. Between August 12th and 23rd, high temperatures held in the mid to upper 80s most days, and never reached 90 at any of our 5 official climate stations. Several locations experienced multiple nights with lows falling into the 50s, including on August 13th when they were widespread across the region. Temperatures heated up again from the 24th through 30th with highs routinely in the 90s across the area. We ended the month with a refreshing airmass that provided much lower humidity and lows falling into the 50s on the 31st.
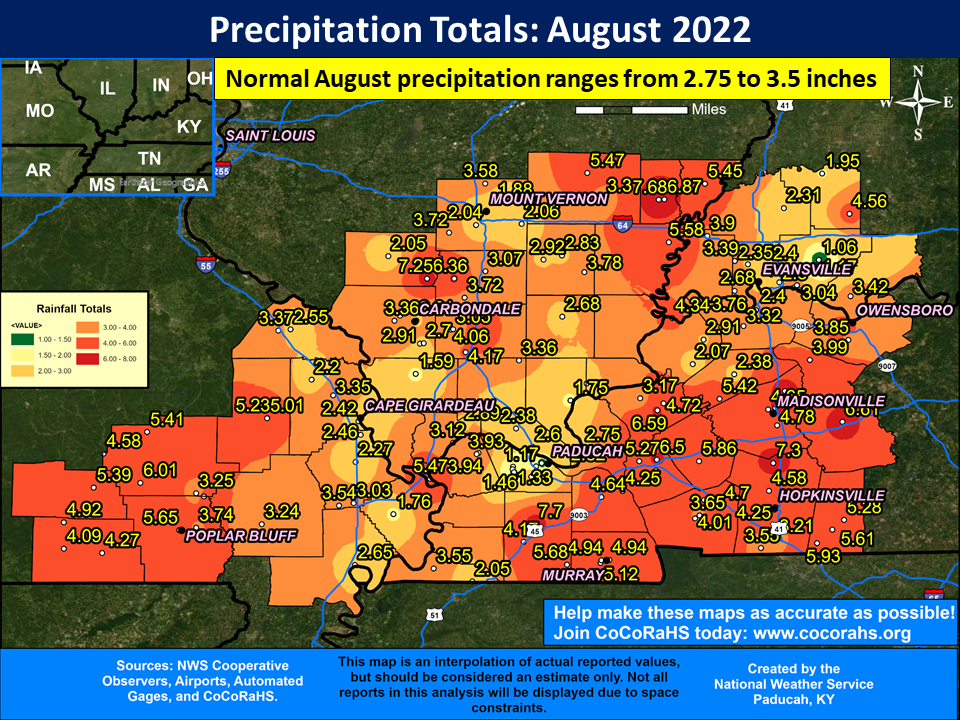
Rainfall varied across the region and was basically an even split between drier and wetter than normal. Much of western Kentucky, the western half of southeast Missouri and along the Illinois/Indiana border experienced a wetter than normal month. Many of these locations received amounts ranging from 3.5 to 7”, which was 1 to 3” above normal. Some areas weren’t so fortunate though and finished drier than normal, including much of far southern Illinois, potions of southeast Missouri near the Mississippi River, part of southwest Indiana, and the city of Paducah, particularly the western half of McCracken County. Paducah officially only picked up 1.46” at the airport in West Paducah. Evansville picked up 2.4" for the month, but only 0.15" after August 5th! The period from Aug 5-31 was the 3rd driest on record in Evansville, only behind 1953 (0.04") and 1943 (0.01"). The highest total for the area was 7.70” at the COOP station 2 miles north of Mayfield, KY.
| August 2022 Review: Precipitation and Temperature Maps (Click on image to enlarge) |
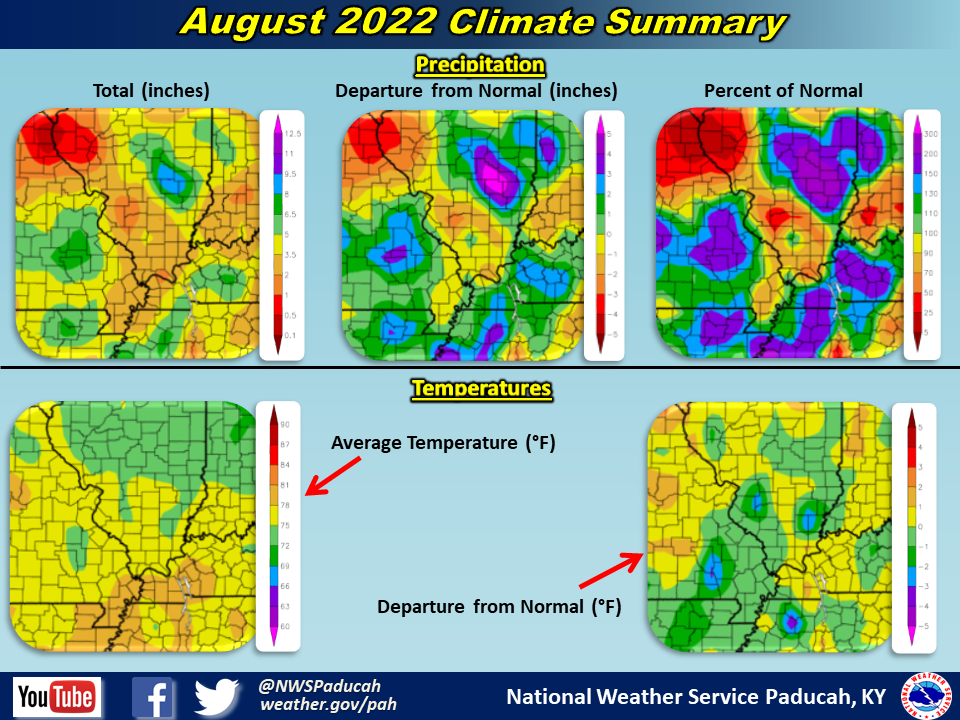 |
| Climate Maps are from the Northeast Regional Climate Center |
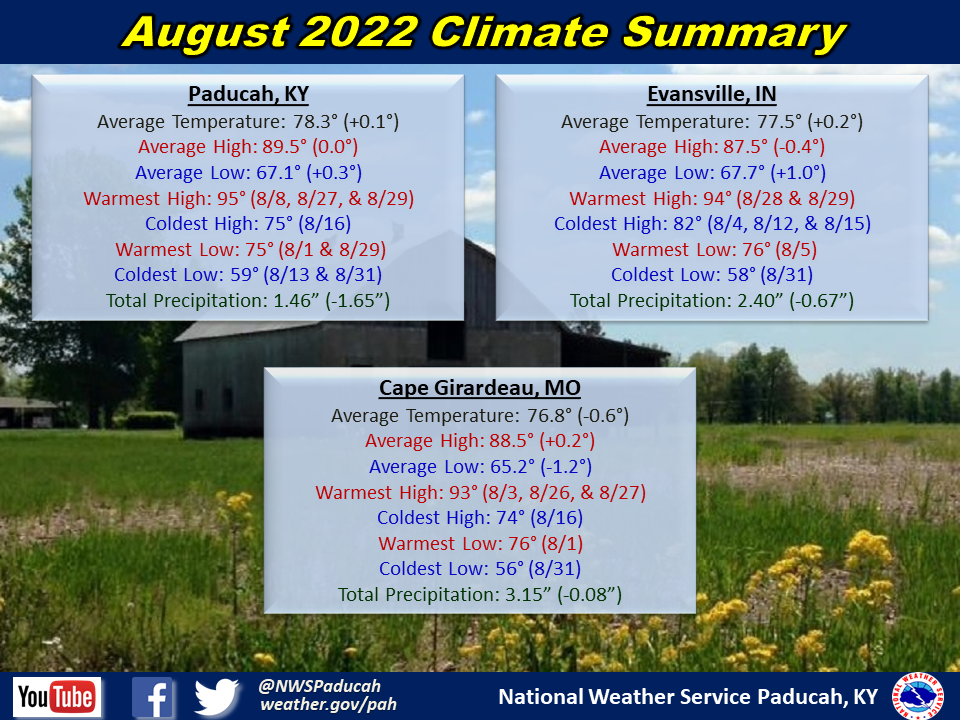
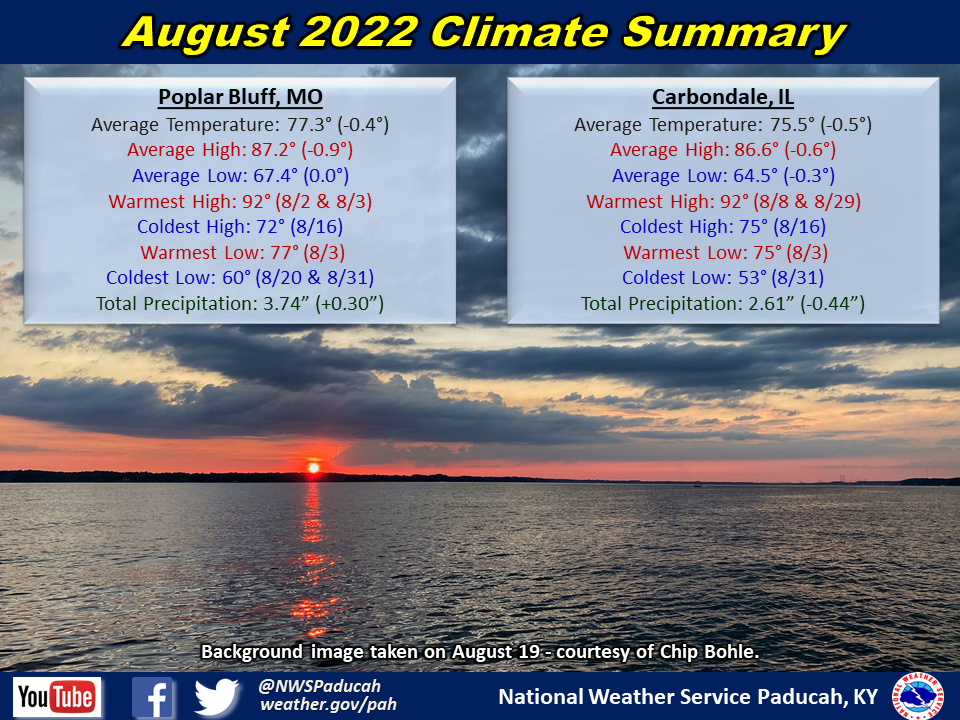
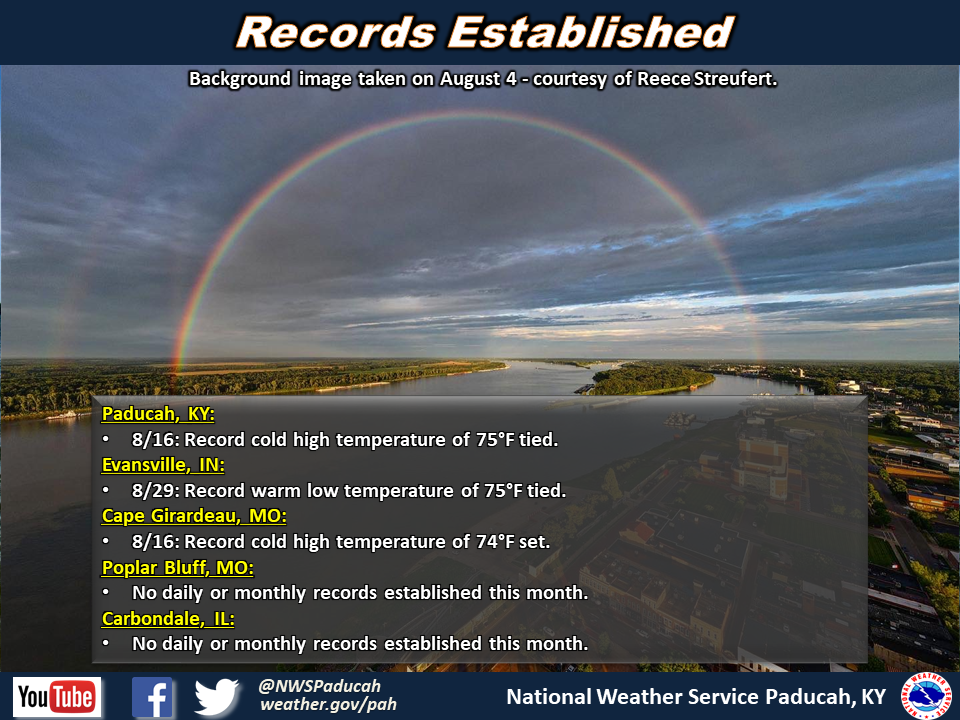
Monthly Climate Report: Paducah | Evansville | Cape Girardeau | Poplar Bluff | Carbondale