Overview
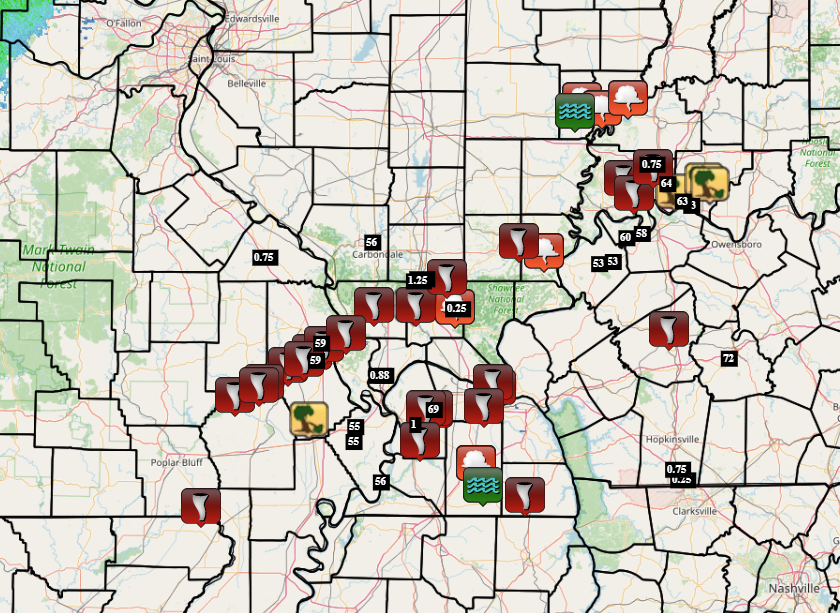
A tornado outbreak occurred across our region during the late afternoon and evening on April 2, 2025. The Storm Prediction Center issued a rare high risk for our region, which was the first time since November 17, 2013 that any part of our forecast area was in this level of risk. There were 23 tornadoes that touched down across our region, which broke the record for most tornadoes in a single event in our office history. The previous record was 21 tornadoes on May 6, 2003.
Tornadoes
Select a tornado from the table to zoom into the track and view more information. The default table view is limited to 8 tracks, but can be scrolled by a mouse wheel or dynamically expanded. Additionally, the table can fill the entire window by clicking the small circular expanding arrow icon at the very top right of the table and returned to its original size by clicking the button again. The side information panel that opens over the map can be closed using the "X" on the upper right corner of the pop-up. Zoom into the map and click damage points to see detailed information and pictures from the surveys.
|
NOTE: times shown below are local to your device's time zone. |

The Enhanced Fujita (EF) Scale classifies tornadoes into the following categories:
| EF0 Weak 65-85 mph |
EF1 Moderate 86-110 mph |
EF2 Significant 111-135 mph |
EF3 Severe 136-165 mph |
EF4 Extreme 166-200 mph |
EF5 Catastrophic 200+ mph |
 |
|||||
| Tornadoes that fail to impact any ratable structures on the EF-Scale are rated EF-Unknown (EF-U) | |||||
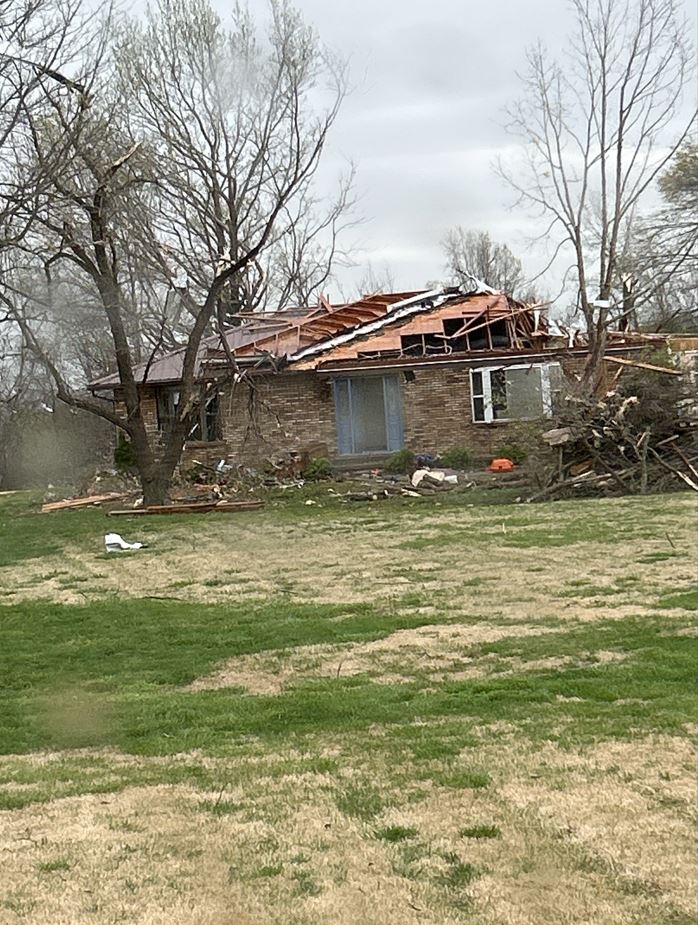
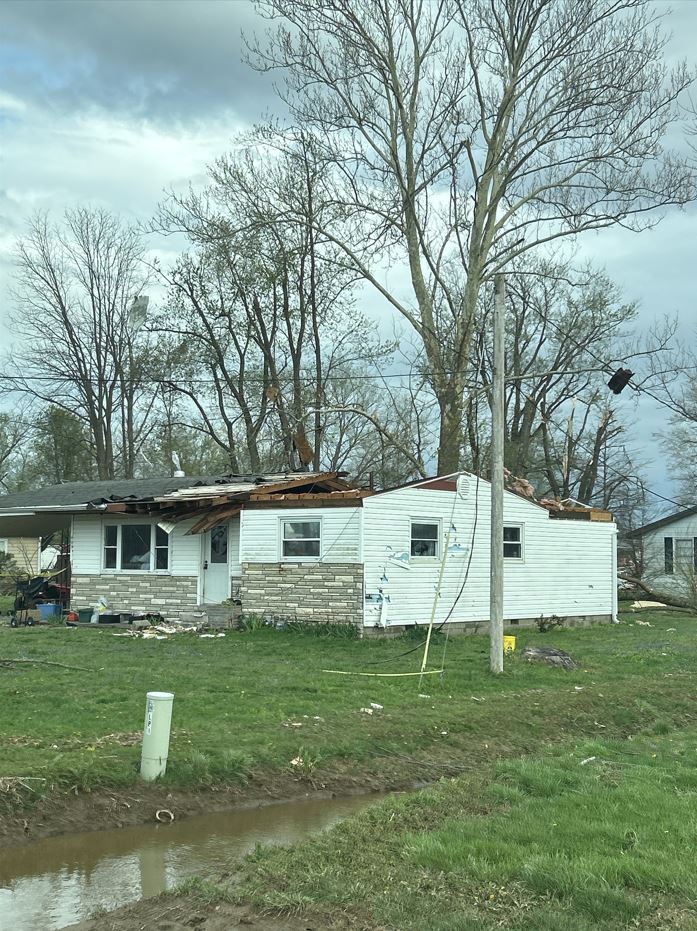
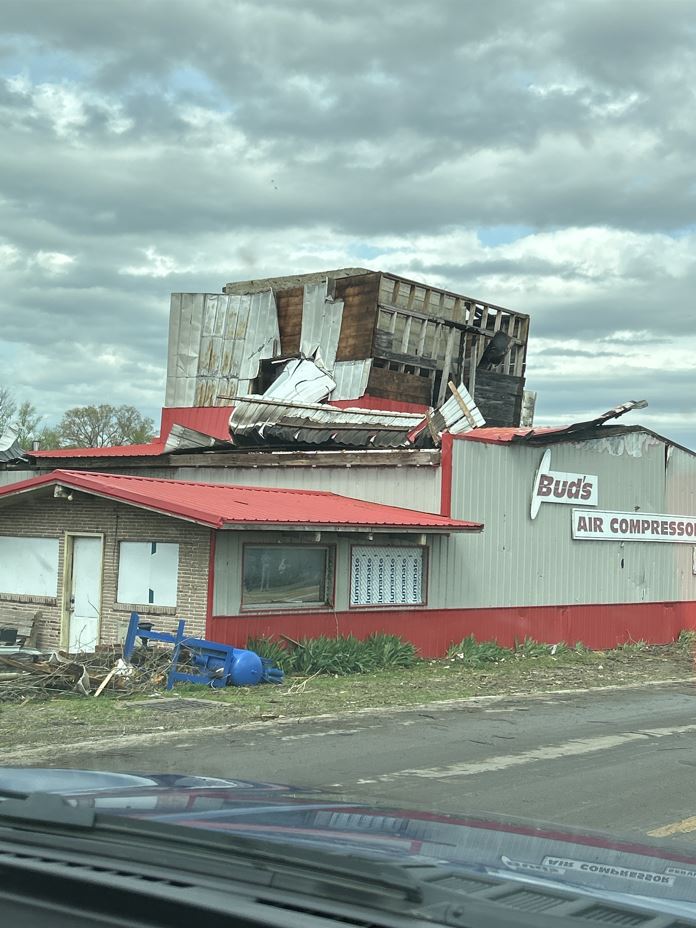
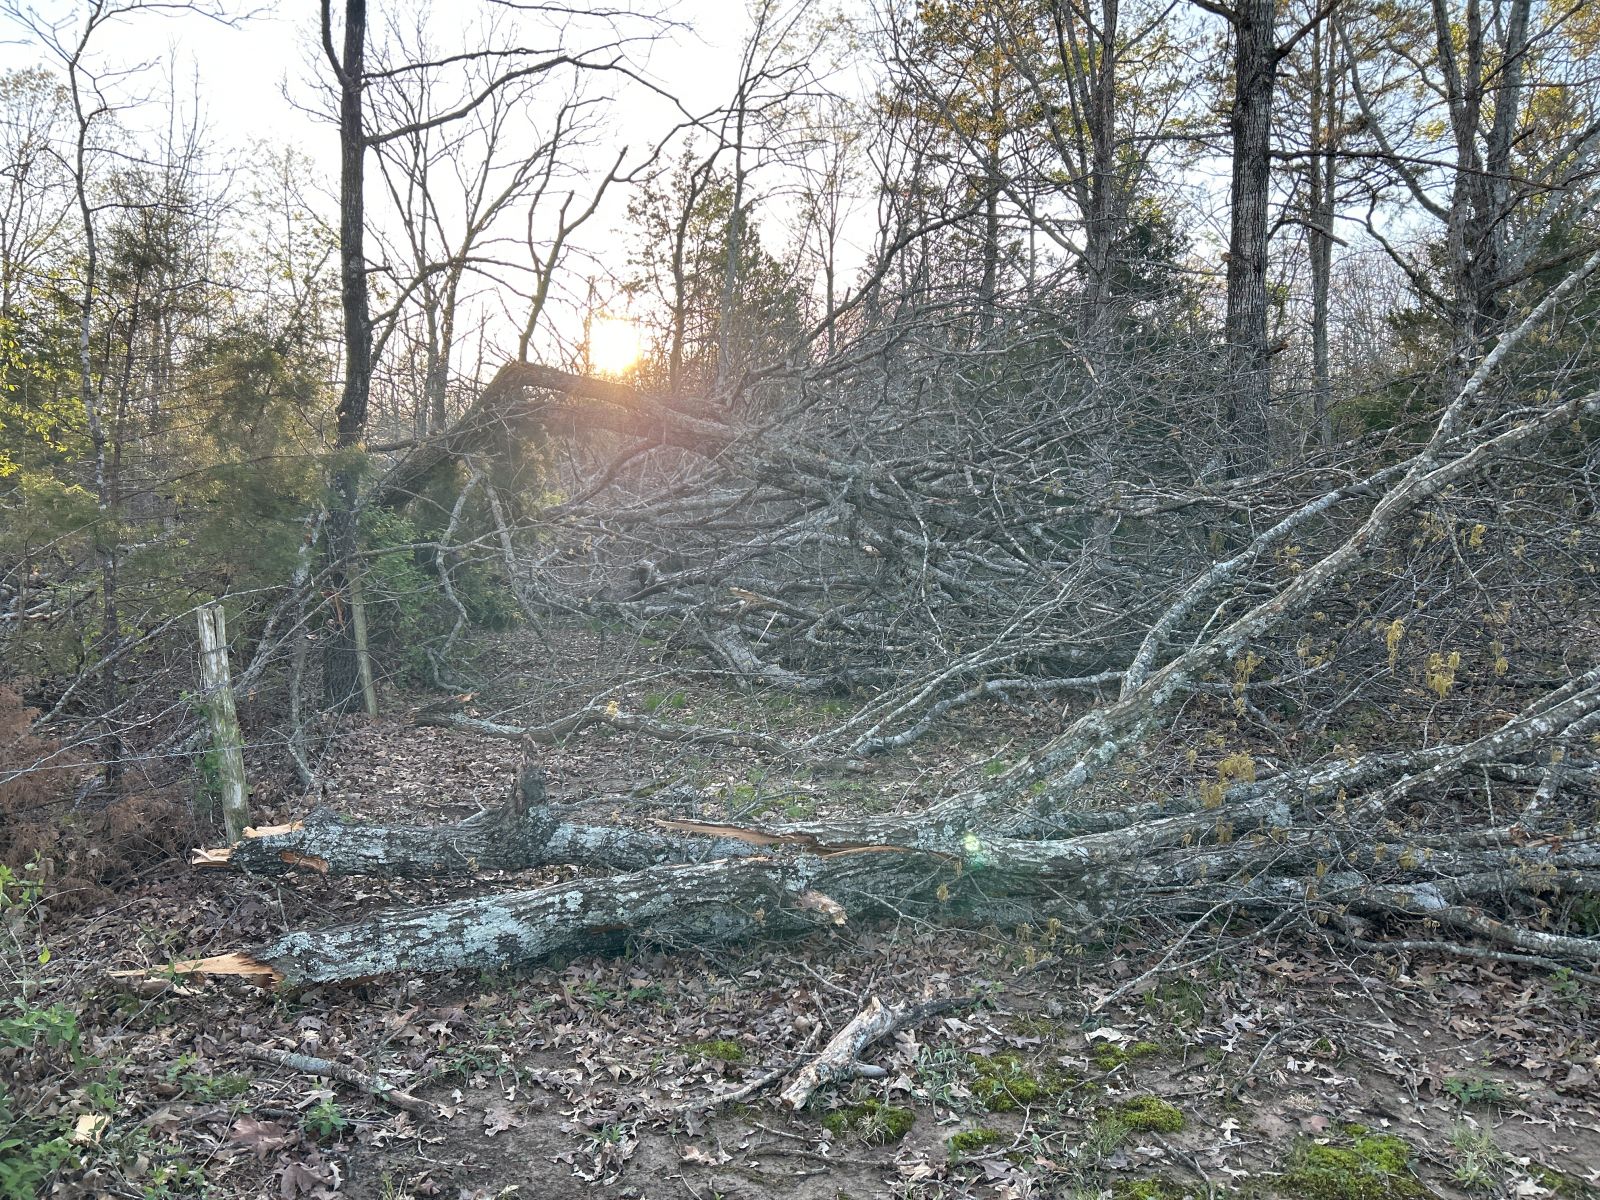
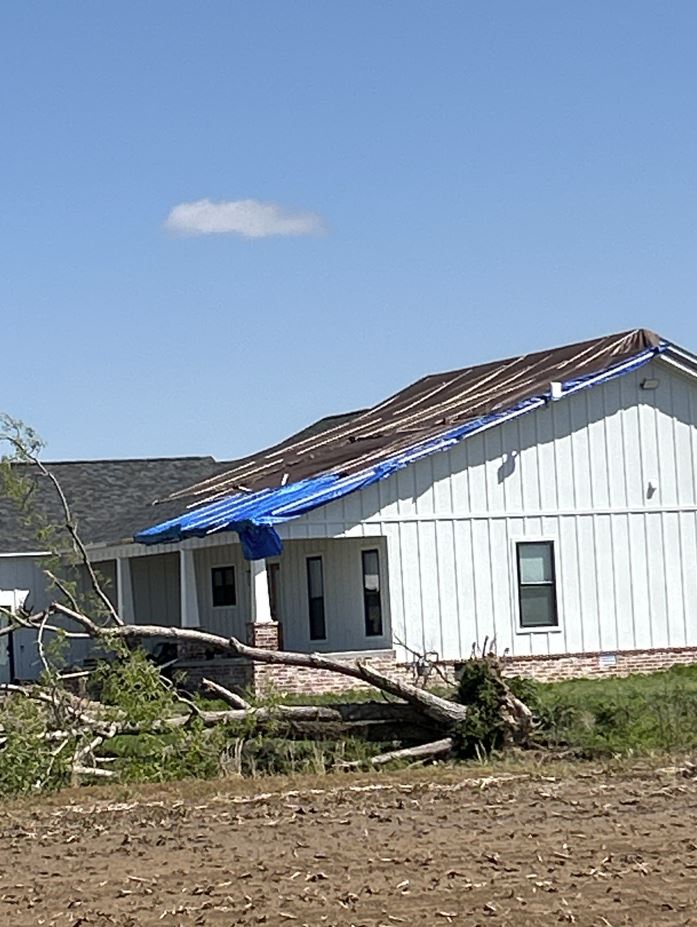
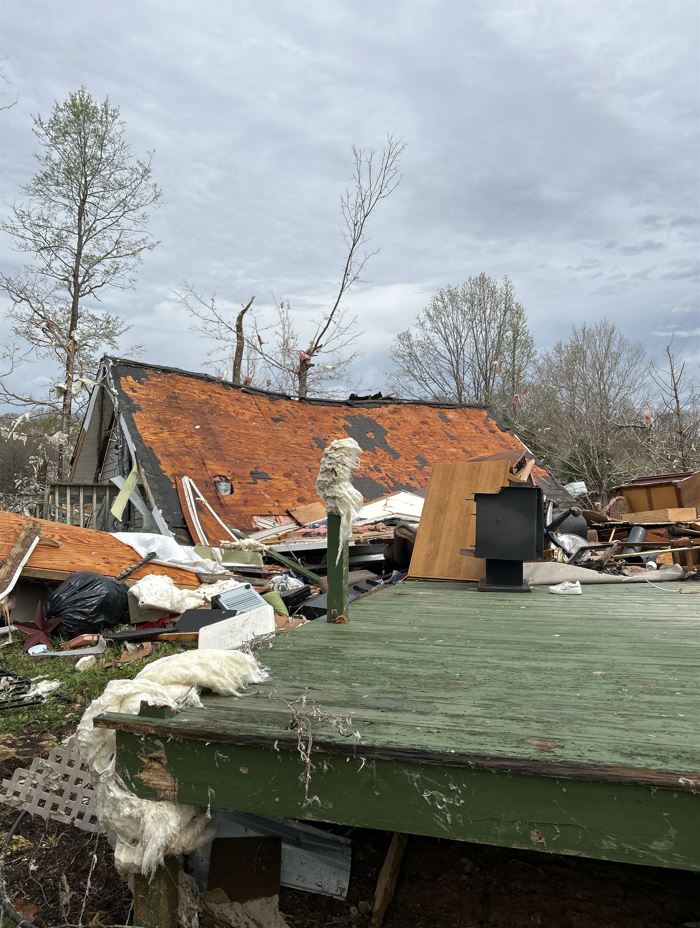
Photos
 |
 |
 |
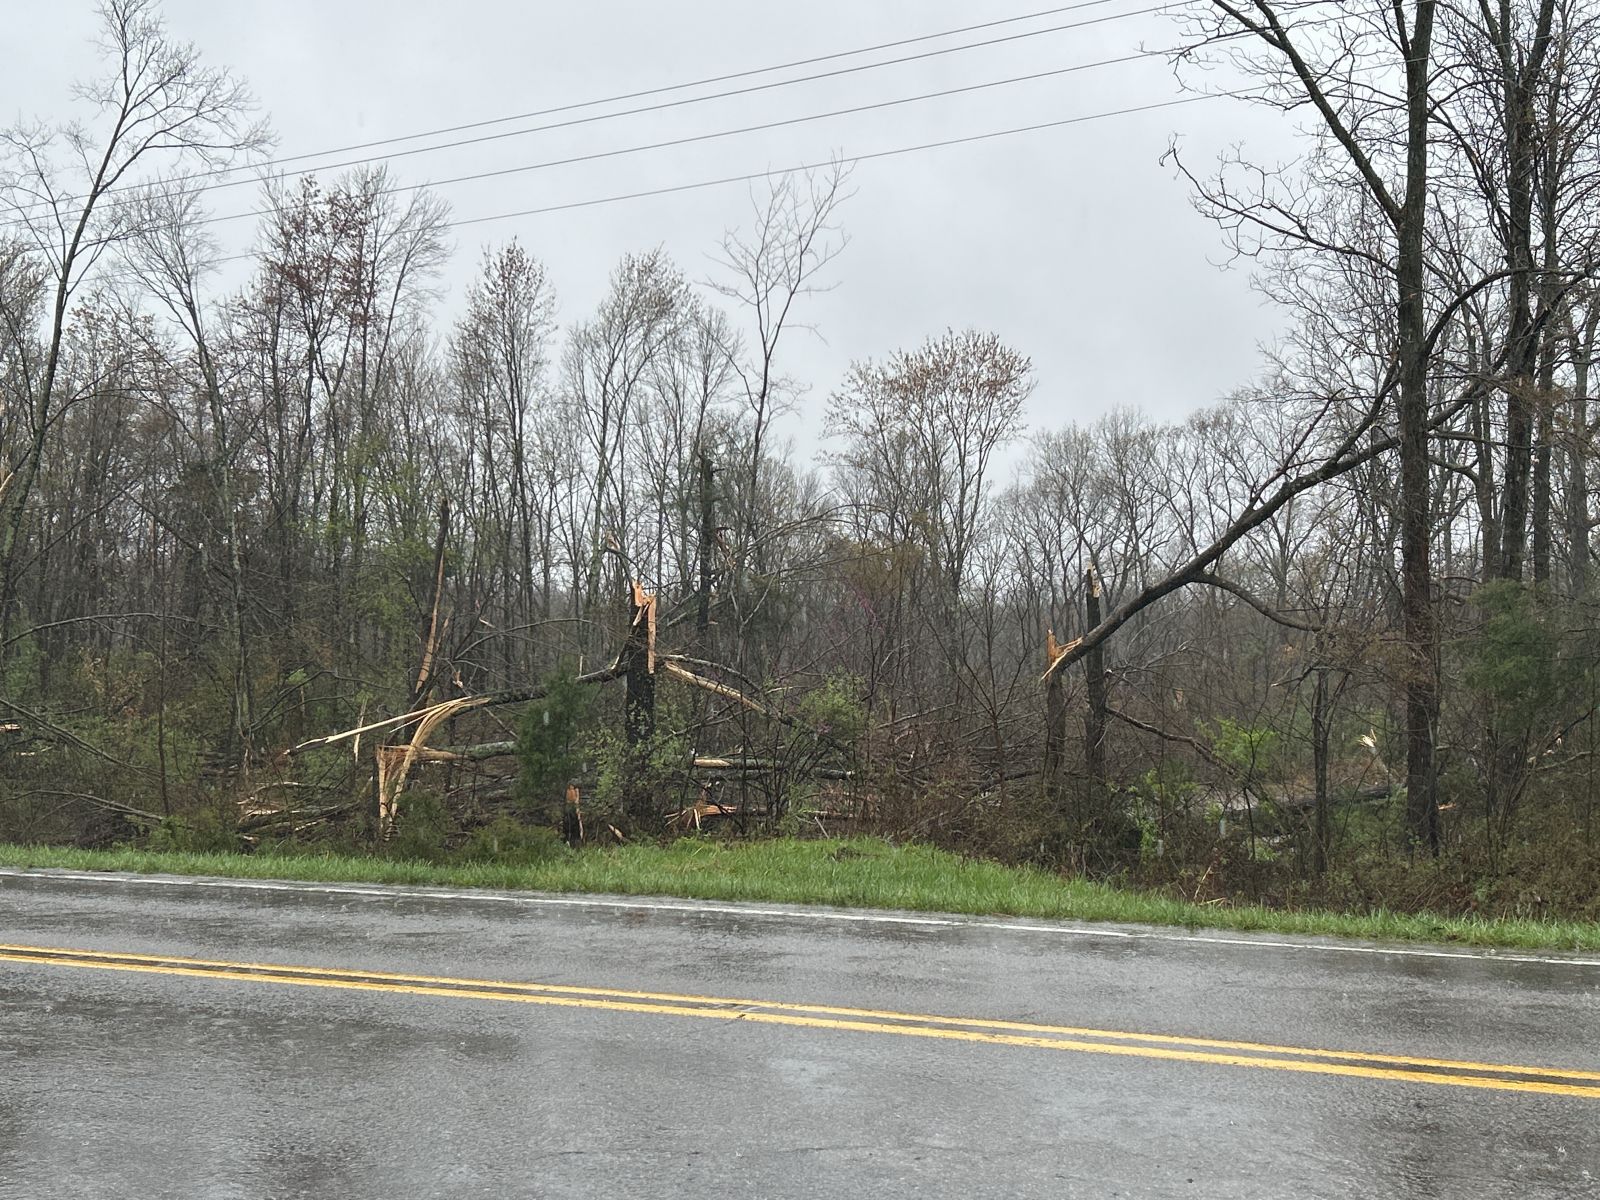 |
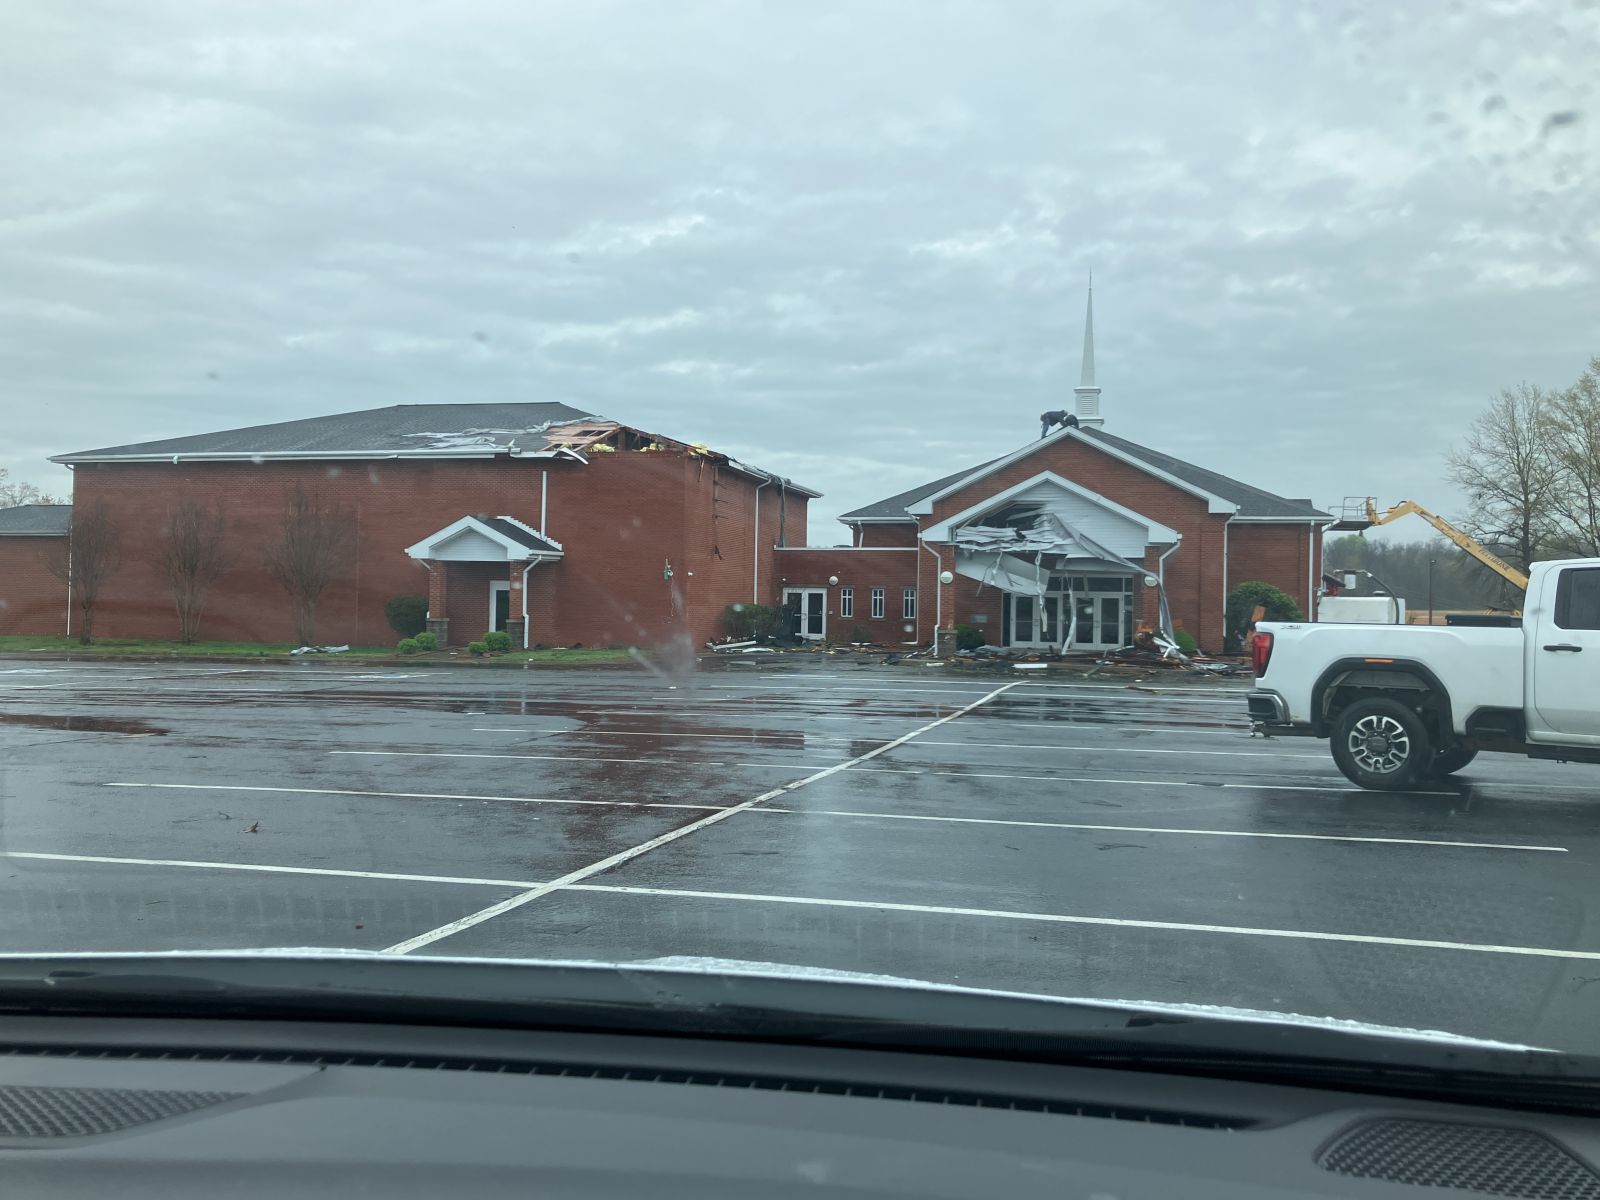
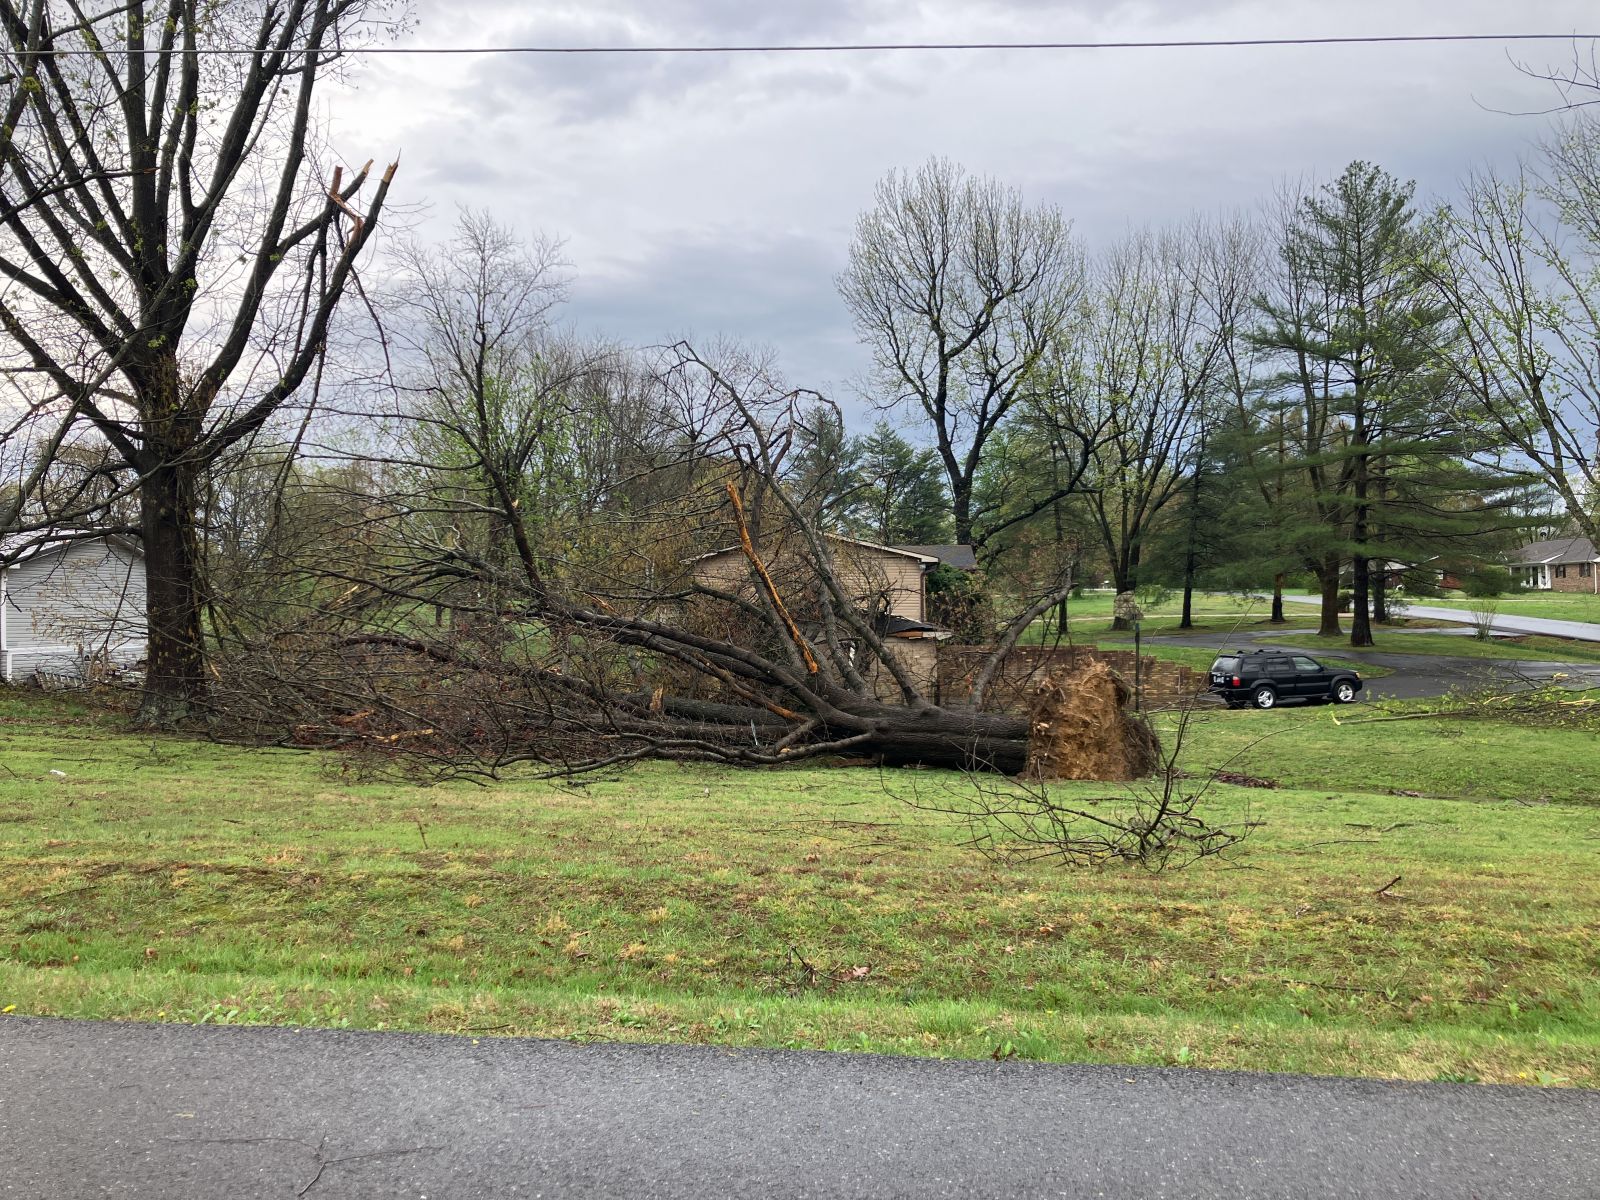
| NWS Storm Survey - Ballard County KY EF-2 | NWS Storm Survey - McCracken County KY EF-2 | NWS Storm Survey - McCracken County KY EF-2 | NWS Storm Survey - Johnson County IL EF-2 |
 |
 |
 |
 |
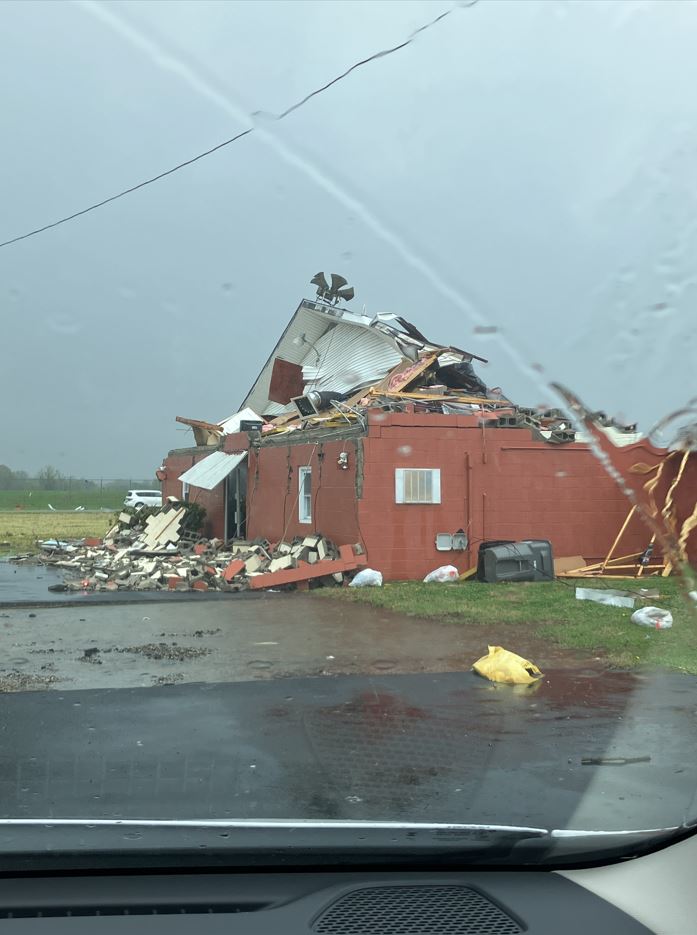
| NWS Storm Survey - Delta, MO EF-2 | NWS Storm Survey - Delta, MO EF-2 | NWS Storm Survey - Delta, MO EF-2 | NWS Storm Survey - Delta, MO EF-2 |
 |
 |
 |
| NWS Storm Survey - Ripley County MO EF-1 | NWS Storm Survey - Butler County MO EF-1 | NWS Storm Survey - Bollinger County MO EF-2 |
Environment
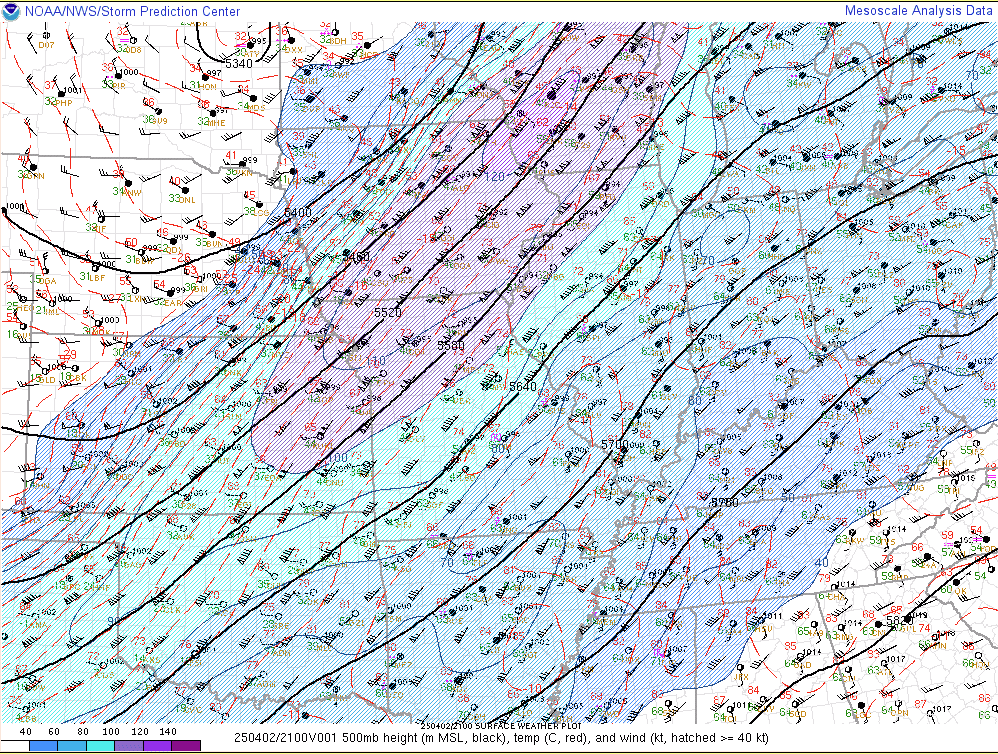
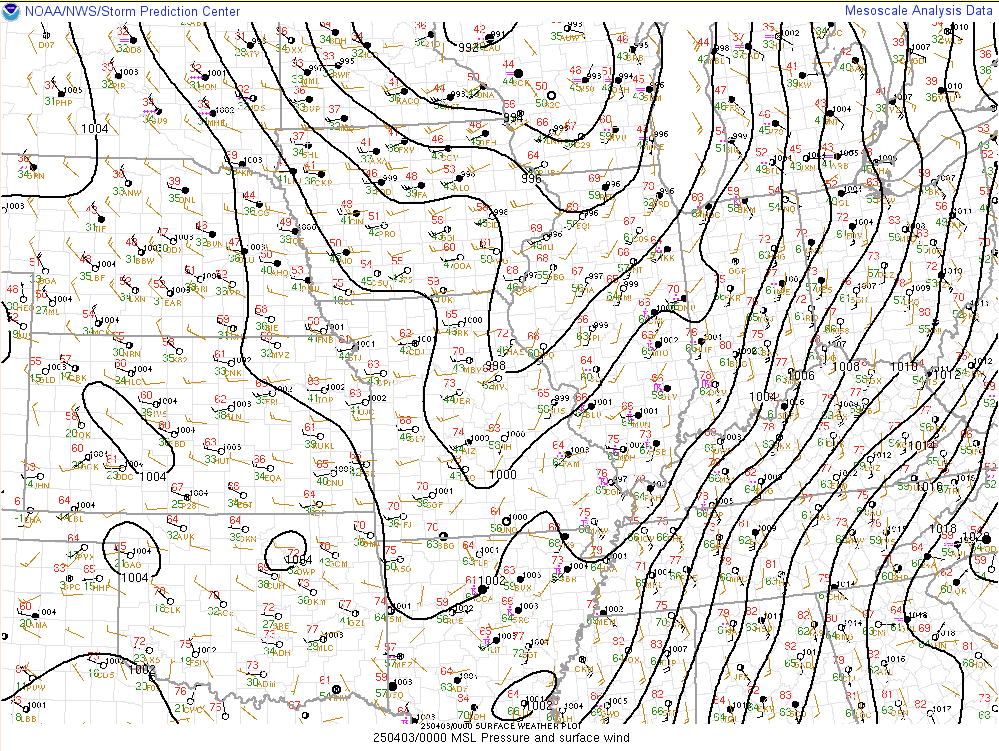
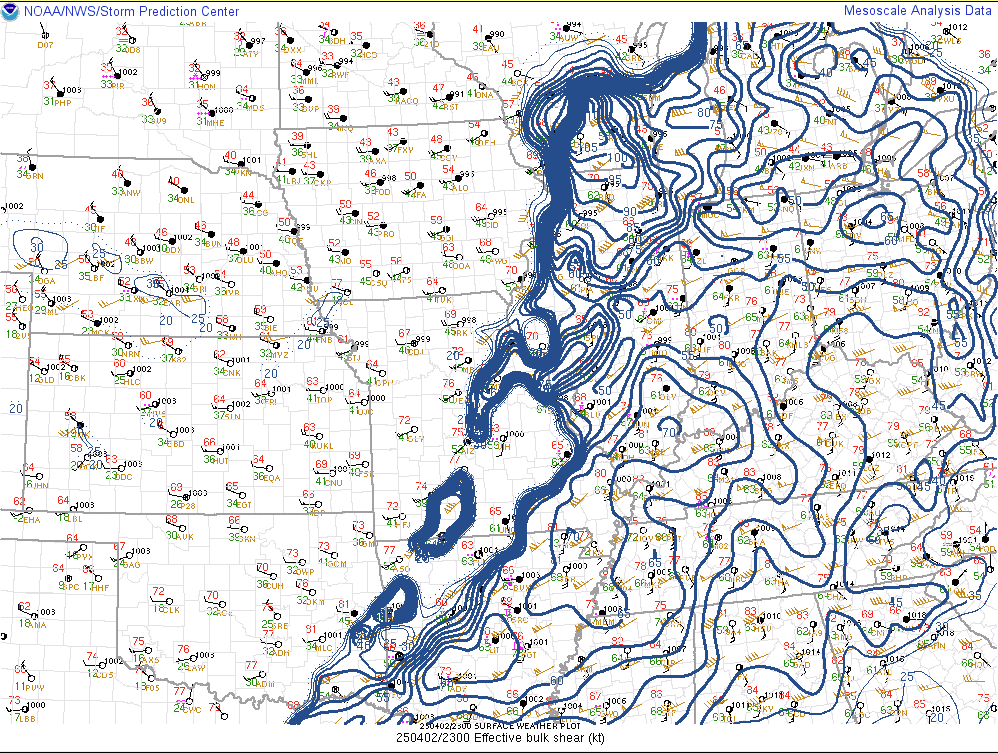
A 500mb trough was ejecting across the Central U.S. with a 110-120 knot jet max located across Iowa into Wisconsin during the late afternoon on April 2nd. At the surface, low pressure was located up in northwest Wisconsin, with a cold front draped southward down into Missouri and Arkansas. A secondary weak surface low was trying to develop across northeast Arkansas, which was promoting further backing of the winds across our region from southerly to southeasterly. Deep layer shear was quite impressive. A strong low level jet around 70 kts developed by evening, enhancing the low level winds.
 |
 |
 |
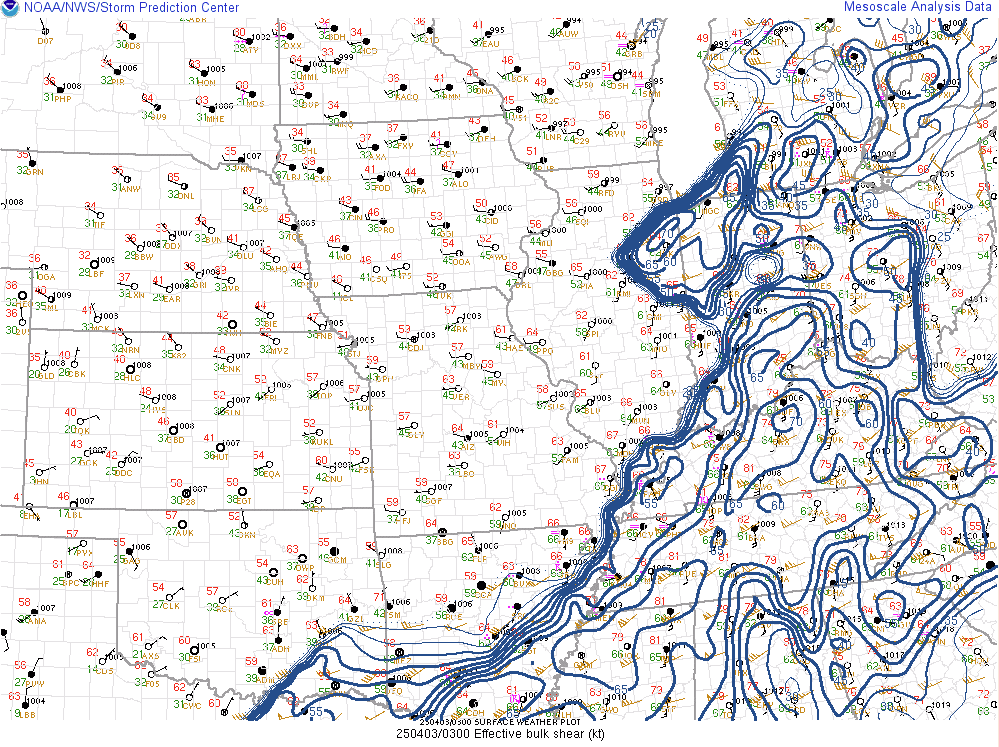 |
| 500mb chart at 4 PM April 2 | Surface Analysis at 7 PM April 2 | 0-6km Bulk Shear at 6 PM April 2 | 0-6km Bulk Shear at 10 PM April 2 |
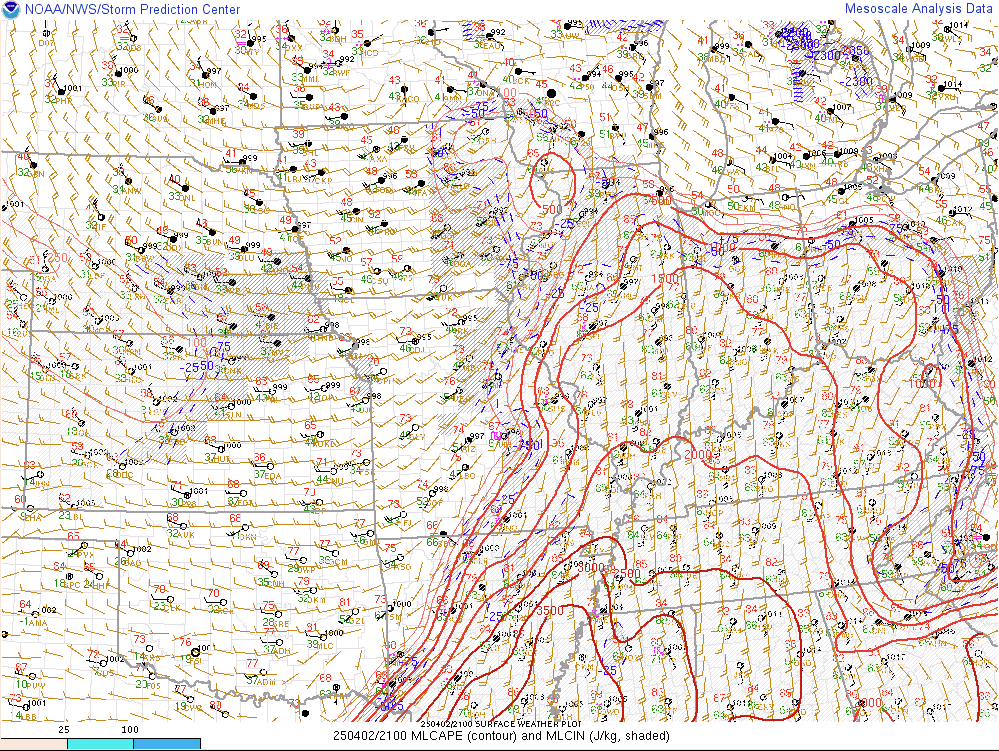
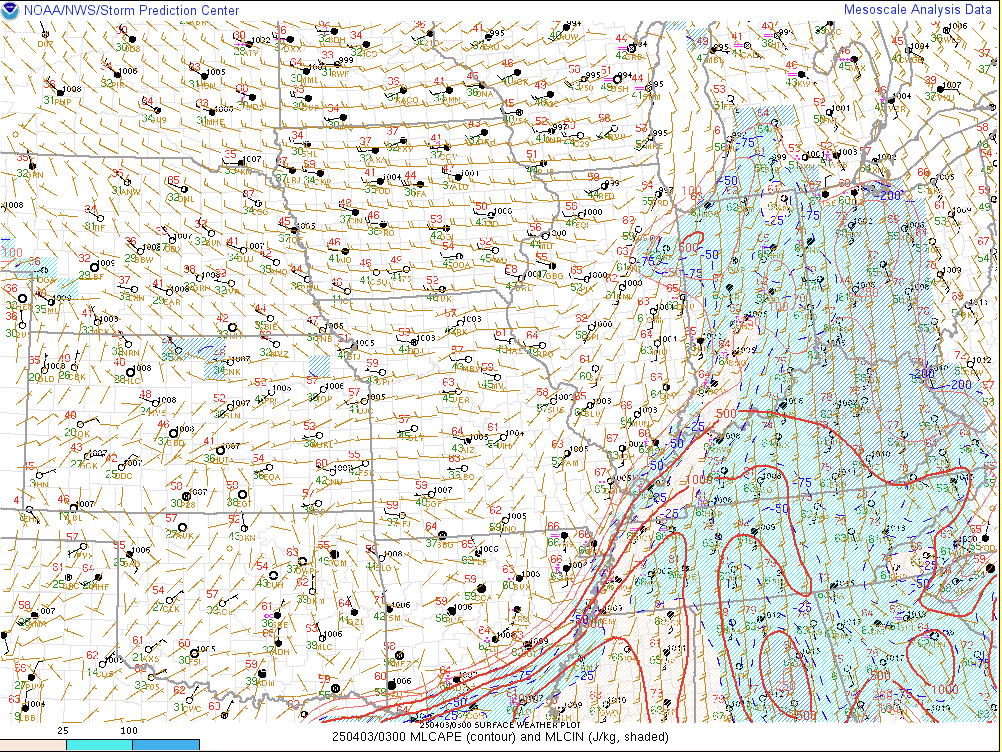
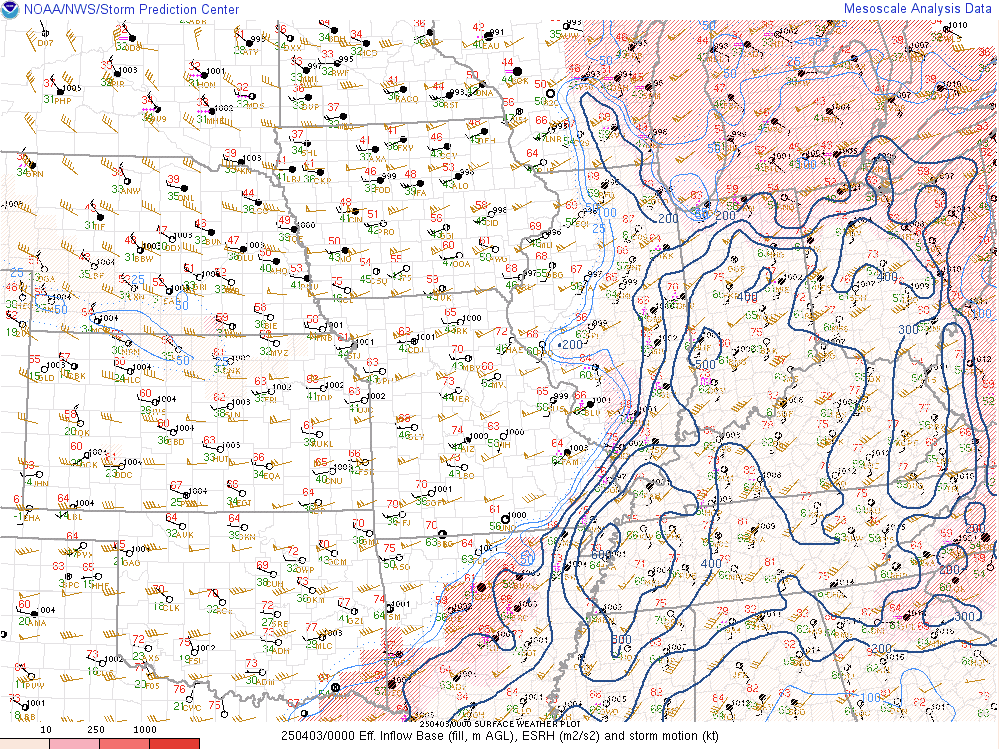
Low level moisture surging north from the Gulf resulted in Mixed-Layer CAPE values exceeding 2000 j/kg across our region by 4 PM on April 2nd. The storm relative helicity values were off the charts, peaking around 600-700 m2/s2 during the evening.
 |
 |
 |
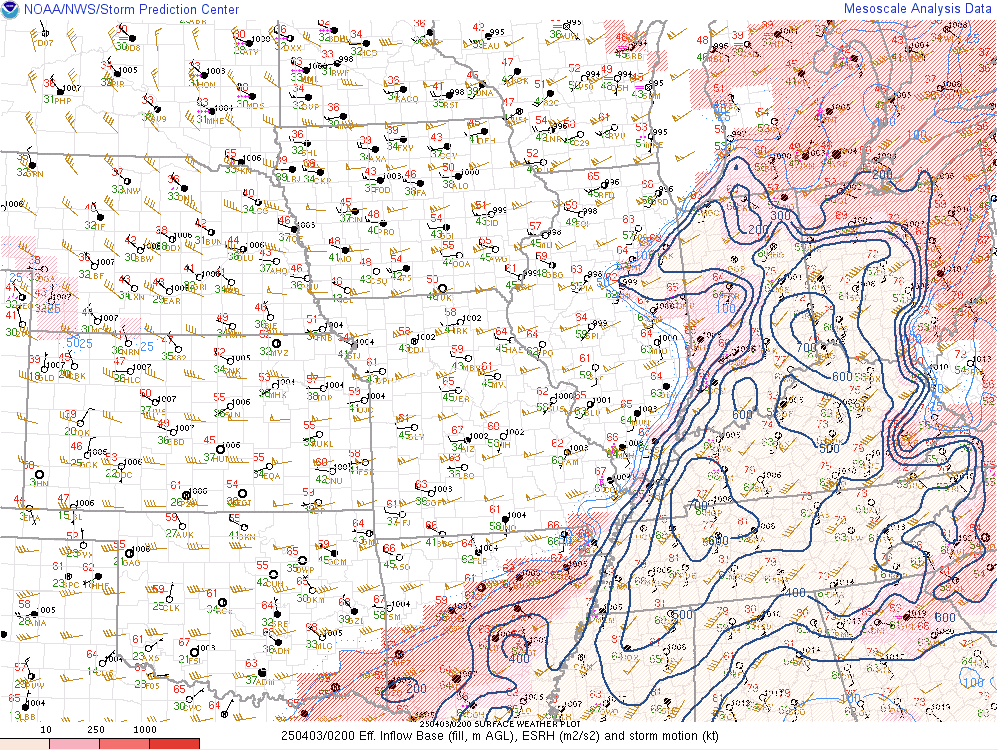 |
| Mixed-Layer CAPE at 4 PM April 2 | Mixed-Layer CAPE at 10 PM April 2 | Effective Storm Relative Helicity at 7 PM April 2 | Effective Storm Relative Helicity at 9 PM April 2 |
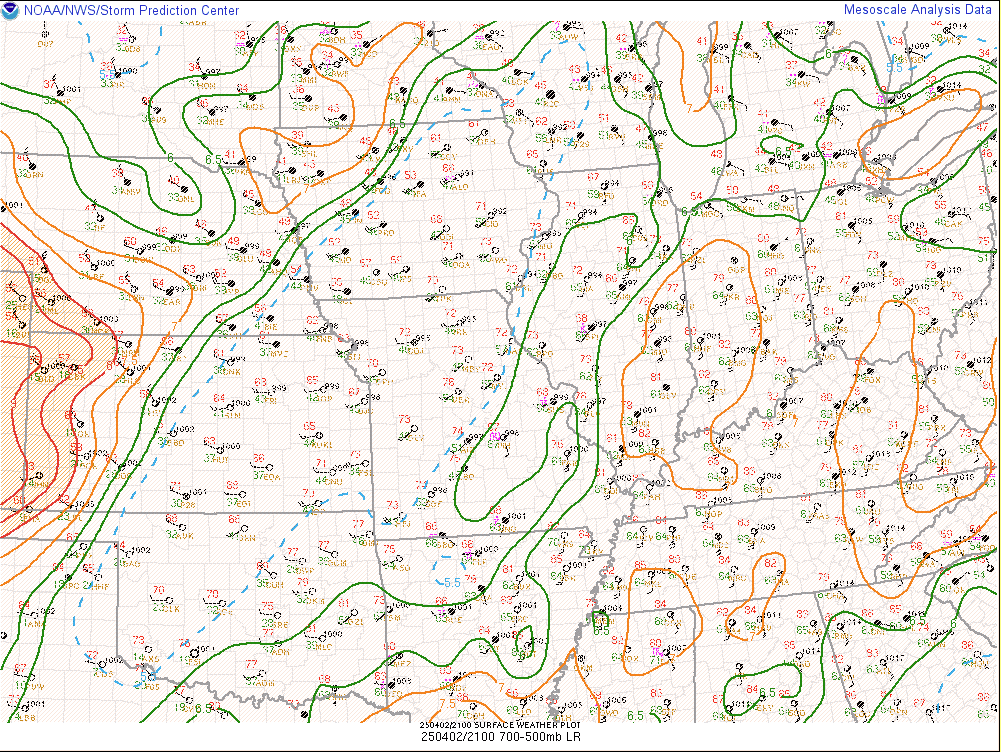
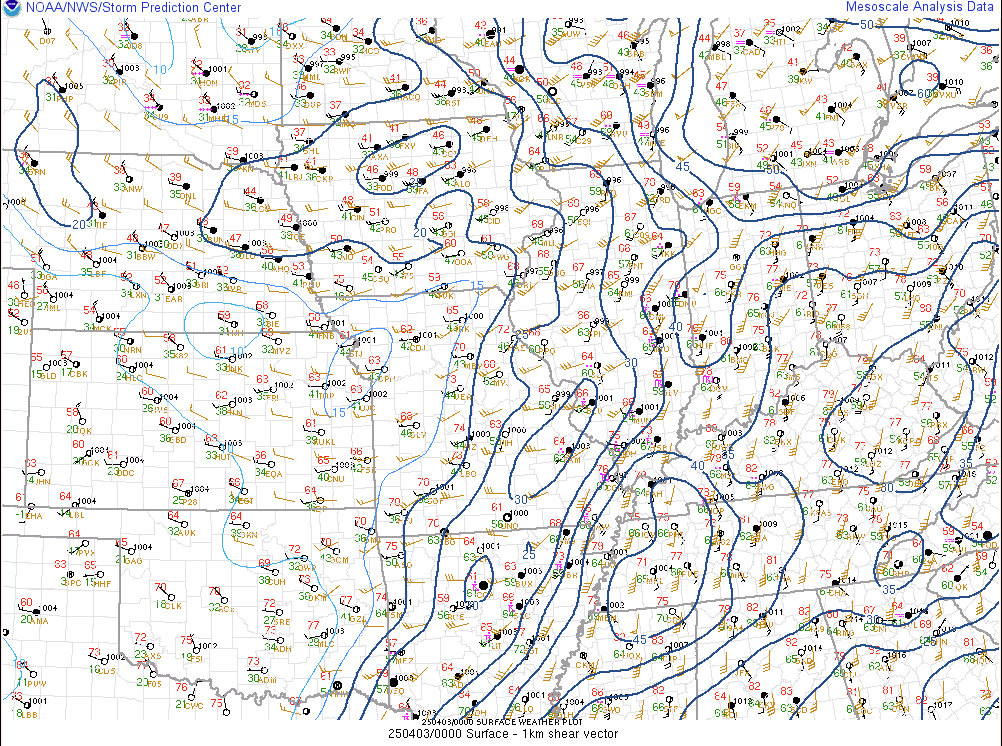
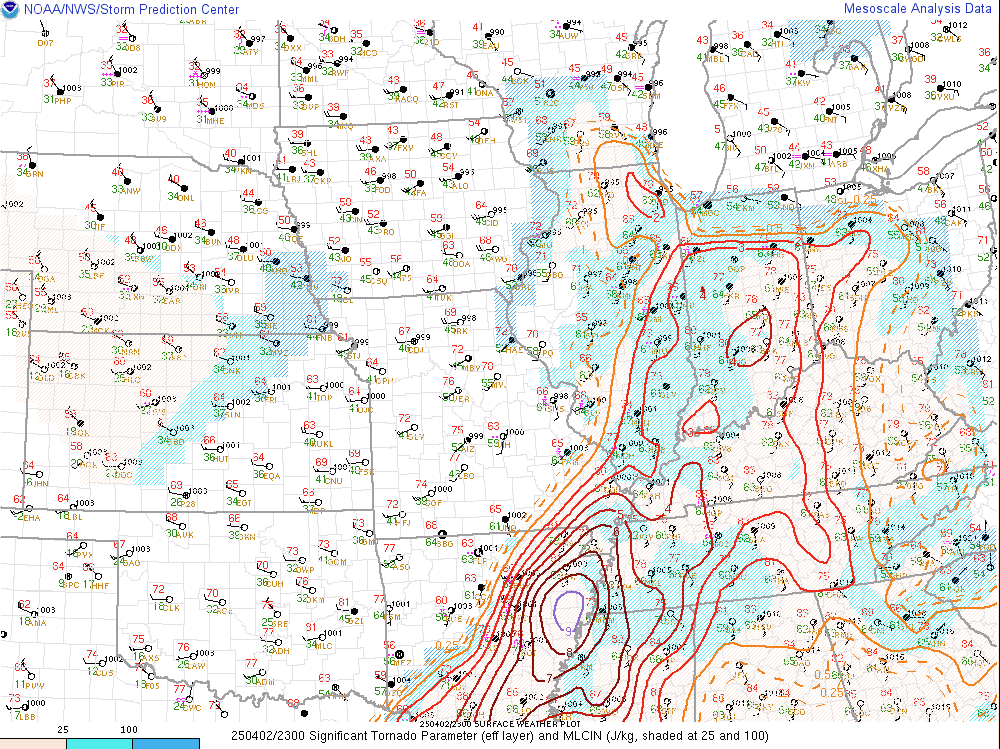
Significant tornado parameter values peaked around 4 to 5 across southern parts of the area, and 2 to 3 further north. Low level shear was quite impressive with long looping hodographs present. The environmental conditions were perfect for tornado development.
 |
 |
 |
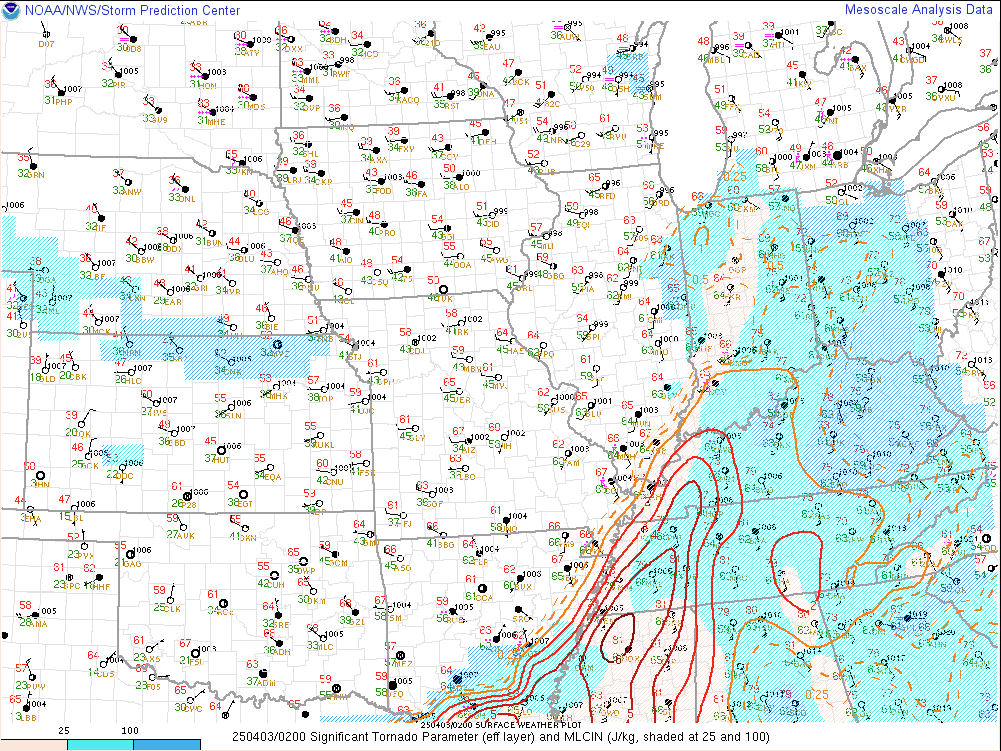 |
| Mid Level Lapse Rates at 4 PM April 2 | 0-1 km shear at 7 PM April 2 | Significant Tornado Parameter at 6 PM April 2 | Significant Tornado Parameter at 9 PM April 2 |
Additional Information
The Storm Prediction Center began outlooking our area for a chance for severe thunderstorms 6 days before the event. On Day 4 the outlook was upgraded to an Enhanced risk and then a Moderate Risk was introduced on the Day 2 update on April 1st. As confidence continued to grow, a rare High Risk was issued for our region with the Day 1 outlook issued shortly after midnight on April 2nd.
 |
.PNG) |
.PNG) |
.PNG) |
| SPC Day 6 Categorical Outlook | SPC Day 4 Categorical Outlook | SPC Day 2 Probabilistic Outlook | SPC Day 1 Categorical Outlook |
 |
Media use of NWS Web News Stories is encouraged! Please acknowledge the NWS as the source of any news information accessed from this site. |
|