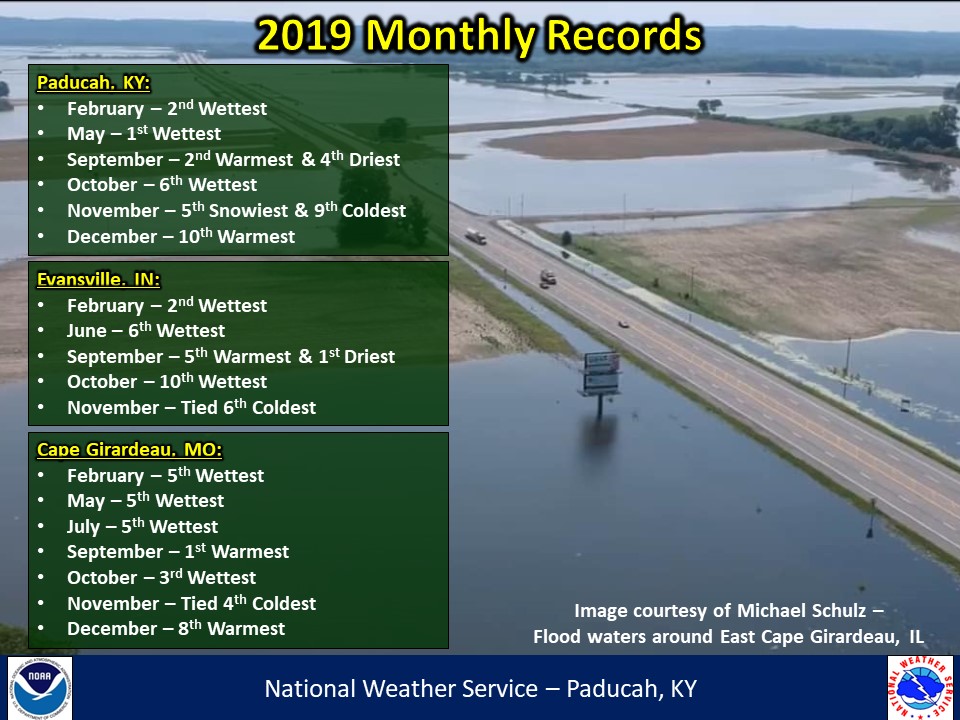
Now that 2019 is officially in the books, let’s take a look back on the yearly review. Temperatures finished above normal by around 1 degree across our region. The most abnormally warm months compared to normal were September and December. On the flip side, the coldest month compared to normal was November. The lack of mild temperatures during the fall season was incredible! Evansville, IN observed their fewest number of days with high temperatures in the 60s and 70s from September through November. Essentially we flipped right from summer to winter. In Paducah, the warmest temperature of the year (96) occurred on September 16th, while the coldest temperature of the year (10) occurred on November 13th. This was quite unusual, since typically our warmest temperature occurs in July or August and our coldest temperature usually occurs in January or February. In fact, this was the first time on record that Paducah’s warmest temperature of the year occurred so late in the season. Not to be outdone, it was also only the 2nd time on record that Paducah’s coldest temperature of the entire year occurred in November. This also happened back in 1950.
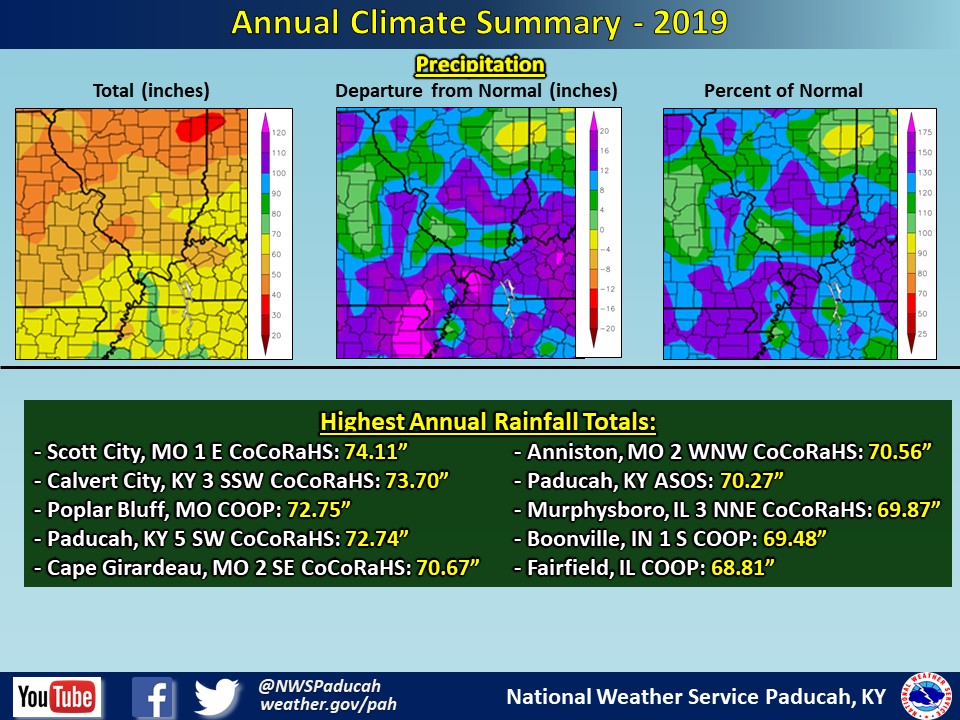
As for precipitation, it was an extremely wet year across a large portion of the country, including the lower Ohio Valley. Most locations in our area received anywhere from 55 to 70+ inches for the year. Normal annual precipitation is around 45 to 50 inches, so this was 10 to 20+ inches above normal! Paducah and Cape Girardeau finished as their 3rd wettest years on record, while Evansville finished 6th wettest. The highest observed total was 74.11” from a CoCoRaHS station near Scott City, MO. Several other locations exceeded 70” for the year, including Paducah. The wettest months compared to normal were February, May, and October. The exceptional amount of precipitation kept area rivers above flood stage, and even in major flooding, for a prolonged period of time. For a look back on some notable events from the year take a look at our Top 10 events of 2019 webpage
Here is to a great year ahead, as we embark on the start of a new decade!
| 2019 Annual Review: Precipitation Maps |
 |
| Climate Maps are from the Northeast Regional Climate Center |
