|
2025 National Hydrologic Assessment
Released on March 20th, 2025
Click here to view the 2025 National Hydrologic Assessment
Take an interactive look at the Spring Flood Outlook
 National Spring Flood Risk defined by risk of exceeding Moderate and Major Flood Levels National Spring Flood Risk defined by risk of exceeding Moderate and Major Flood Levels
Download the shapefile | Download the KMZ file (right click and save as)
For an interactive look at the Spring Flood Outlook, please visit the 2025 Spring Flood Outlook Story Map Journal
Executive Summary
The 2025 National Hydrologic Assessment offers an analysis of flood risk, water supply, and ice related flooding for spring 2025, summarized at the national scale. This assessment is based on late summer, fall, and winter precipitation, frost depth, soil saturation levels, snowpack, current streamflow, and projected spring weather.
Widespread major flooding is not expected this spring across the CONUS, and significantly reduced flood risk exists over much of the United States, given above average temperatures, combined with well below average snowpack over the Northern Plains, Midwest, and Ohio Valley. The reduced flood risk could lead to low flow impacts on navigation and saltwater intrusion on the Lower Mississippi River during the late summer and fall. This is the fourth year in a row with this risk.
Despite the overall reduced flood risk this spring, moderate flooding is expected in tributaries to the Lower Missouri River in Kansas and Missouri. This area typically experiences moderate flooding each spring, and despite the lack of snowpack, local antecedent conditions and typical spring rainfall will lead to the likelihood of moderate flooding on these tributaries.
Current water supply forecasts in the western United States indicate much below normal conditions for the Desert Southwest due to below average snowpack.
In Alaska, spring ice breakup and snowmelt flood risk is forecast to be above average for the Upper Yukon, Tanana, and Koyukuk River basins. Below average flood risk is expected in the Lower Yukon and Kuskokwim River basins, along with most of Southcentral Alaska.
Based on the expected spring flood outlook, hypoxia development in the Gulf of America and Chesapeake Bay is projected to not deviate from seasonal normals. Hypoxic zones directly impact commercial and recreational fisheries.
Introduction
The National Hydrologic Assessment (NHA), issued each spring by the National Weather Service (NWS), provides an outlook on U.S. spring flood potential and water supply. Analysis of flood risk integrates late summer, fall, and winter precipitation, frost depth, soil saturation levels, streamflow, snowpack, temperatures, and rate of snowmelt. The information presented in this report focuses on spring flood potential, using methods analyzed on the timescale of weeks to months, not days or hours. A network of 122 Weather Forecast Offices, 13 River Forecast Centers, and the National Water Center work collaboratively to assess the risk summarized here at the national scale. The NHA depicts flood risk over large areas, and is not intended to be used for any specific location.
Heavy rainfall at any time can lead to flooding, even in areas where the overall risk is considered low. Rainfall intensity and location can only be accurately forecast days in the future; therefore, flood risk can change rapidly. Stay current with flood risk in your area with the latest official watches and warnings at weather.gov. For detailed hydrologic conditions and forecasts, go to water.noaa.gov.
Current Hydrologic Conditions (Continental U.S.)
Across much of the Contiguous United States (CONUS) this winter (December - mid March) near to above average temperatures were observed (Figure 1). Above average temperatures were most prevalent across Southern and Central Texas, the Intermountain West States, West Coast, Upper Midwest, and portions of New England. Seasonal precipitation percent of average (Figure 2) indicates a wetter than average precipitation pattern from East Texas through the Mississippi Valley and into the Ohio Valley and southern Mid-Atlantic, as well as in Northern California into portions of the Northern Rockies. Much below average precipitation was observed across portions of the Great Basin through the Desert Southwest into West Texas; some locations in those areas experienced some of the driest conditions on record. Near to slightly below average precipitation totals were observed across the remainder of the CONUS.
The Soil Moisture Ranking Percentiles (Figure 3), provided by the Climate Prediction Center (CPC), indicate soil moisture deficits in the Southwest and Rio Grande Valley, as well as portions of the Northern Rockies and Upper Missouri Basin, and the coastal and inland Northeast. Below normal soil moisture also remains in place over the South Atlantic-Gulf Watershed and northward into most of the Mid-Atlantic Coast and Northeast. Portions of the Lower Mississippi Valley through the Tennessee Valley and into Ohio River Valley show a soil moisture surplus. Soils in Northern California and southern Oregon are near capacity primarily due to precipitation from an active atmospheric river pattern.
The 28-day average streamflows (Figure 4), provided by the U.S. Geological Survey (USGS), are generally consistent with the aforementioned winter precipitation trends. Much below normal to low streamflows are observed along the coastal and upper portions of the Mid-Atlantic, portions of the Central Plains into the Midwest, Central and Southern Texas, and the Great Basin.
In the Western U.S., the Natural Resources Conservation Service (NRCS) snow water equivalent (SWE) totals (Figure 5) show near to below normal for the northern Rockies and the interior Northwest. A series of atmospheric rivers in December through March has led to above normal snow conditions in southern Oregon and Northern California. Near to above normal conditions exist across the central Rockies, northern Great Basin, and Upper Colorado Basin after a wet first half of March. Below normal conditions dominate the Southern Rockies and Desert Southwest.
A warm and dry winter east of the Rockies led to well below normal snow water equivalent, except in localized areas downwind of Lakes Erie and Ontario.
Approximately 45% of the CONUS is experiencing drought conditions. The U.S. Drought Monitor continues to focus the severe (D2) to exceptional (D4) drought over portions of the Southwest, the Big Bend of Texas, the Northern Rockies and Upper Missouri Basin, and the Atlantic Coast.
Current Flooding
Minor river flooding is ongoing and forecast to continue from East Texas through portions of the Lower Mississippi Valley, Lower Ohio Valley, and portions of the eastern coastal plain from previous heavy rainfall. Minor river flooding is forecast across portions of the Pacific Northwest from persistent rainfall associated with repeated atmospheric rivers. River ice is present in portions of Maine, which combined with rainfall and the melting of snow that is present, will present a risk of ice jam flooding through the remainder of March.
Long Range River Flood Outlook
This outlook is focused on the potential for significant flooding (defined as moderate and major) with a 50% probability of exceedance, which is considered the most probable level of flooding expected within a season. To view the latest Long Range River Flood Outlook, which includes the potential for both minor and significant flooding, visit https://water.noaa.gov.
Potential Major Flood Areas
As of the date of this outlook, there are no areas expected to experience major flooding. Heavy rainfall at any time can lead to flooding, up to and including major flooding. Rainfall intensity and location can only be accurately forecast several days in the future; therefore, flood risk can change rapidly.
Potential Moderate Flood Areas
Moderate flooding is expected in tributaries to the Lower Missouri River in northeastern Kansas and northwestern Missouri. This area typically experiences moderate flooding each spring, and despite the lack of snowpack, local antecedent conditions and typical spring rainfall will lead to the likelihood of moderate flooding on these tributaries.
Of note, isolated areas in the Middle Mississippi, Lower Ohio, and Tennessee Valleys, as well as northeastern Texas could also experience moderate flooding this spring. Flooding in these areas are usually driven by spring convective rainfall events and flooding is typical in these basins given current conditions.
As of the date of this outlook, widespread moderate or major flooding is not expected on the mainstem of the Lower Mississippi River. Any flooding on the Lower Mississippi River is highly dependent on high flows from the Ohio River. Of note, this will be the fourth year of reduced Spring flood risk across the Mississippi River basin, with the risk for abnormally low flow on the mainstem Mississippi below Cairo, Illinois later in the year.
Water Supply
Western U.S.
Water supply forecasts are produced by the River Forecast Centers in the western United States. Forecasts are impacted by current hydrologic conditions including snowpack, soil moisture, and streamflow. As conditions change, particularly over the next few months, forecasts will be updated and available at the Western Water Supply Forecasts webpage.
Key Water Supply Locations
The locations listed in Table 1 are key forecast locations that can accurately represent the broad water supply forecasts for major basins in the western U.S.
Northwest
Water supply forecasts in the Northwest are a mix of conditions. Near to above normal runoff volumes are forecast in Oregon and the majority of the Snake River Basin while below normal runoff volumes are expected in eastern Washington, northern Idaho, and portions of the Upper Columbia River Basin.
California and Nevada
Near to above normal runoff volumes are forecast for northern California and near to below normal runoff volumes are expected in central California and Nevada.
Colorado River and Great Basin
Below to near normal runoff volumes are expected over the Upper Colorado River Basin and Great Basin. Much below normal runoff volumes are forecast for the Desert Southwest including Arizona and southern Utah.
Upper Rio Grande Basin
Below normal runoff volumes are expected for portions of southern Colorado into northern New Mexico. River basins such as the Rio Grande, Pecos, and Canadian are forecast at seasonal volumes between 60 - 70% of normal.
Upper Missouri River Basin
Across the eastern slopes of the Rocky Mountains in the headwaters of the Missouri River and along portions of the Yellowstone River Basin, below normal seasonal volumes generally between 50 - 75% are expected.
Eastern U.S.
Mid-Atlantic / Northeast
Due to a relative lack of winter precipitation, reservoirs across portions of the Catskill region of New York are below their typical storage capacity. However, the seasonal precipitation outlook favors above normal precipitation through June in this area, which could improve the current conditions.
Mississippi River Basin
As we enter the fourth year of reduced Spring flood risk across the Mississippi River basin, the risk for abnormally low flow on the mainstem Mississippi below Cairo, Illinois is again present. Climatologically, flows decrease in the late summer into early winter as rainfall patterns shift from widespread spring rainfall to summertime thunderstorms. Moreover, it should be noted the Mississippi River has experienced unusually below normal flows during portions of the last three years.
Alaska Spring Ice Breakup Outlook
The potential for spring ice breakup and snowmelt-induced flooding varies significantly across Alaska. In the Interior, including most of the Yukon, Tanana, and Koyukuk river basins, as well as portions of the North Slope, breakup flood risk is above average due to higher-than-average snowpack levels. In contrast, portions of the Lower Yukon and Kuskokwim river basins, along with most of Southcentral Alaska, can expect a below average breakup potential due to very low snowpack caused by warmer than average winter temperatures. There have been no reports of mid-winter breakups or the associated formation of anomalously thick ice. This outlook is based on observed snowpack, ice thickness reports, and seasonal temperature projections.
Alaskan River Ice
Measurements at limited observation sites from late February to early March indicate that ice thickness across the state is generally near to below average. In the Interior, ice thickness ranges from 65 - 110% of average, with most sites falling between 75 - 95% of average for this time of year.
Cumulative freezing degree days (FDD), a common proxy for river ice thickness, are below average across most of Alaska as of early March, reflecting a notably warm winter (Figure 6). In contrast, colder conditions prevailed in Southeast Alaska, where FDDs range from 115 - 200% of average.
Alaskan Snowpack
The March 1st snowpack analysis by the NRCS reveals a highly variable snowpack across Alaska. While the Interior and northern regions of the state have an above to well above average snowpack, areas along the West Coast and lower elevations in Southcentral and Southeast Alaska have a significantly below average snowpack, with some locations already experiencing melt-out.
Snowpack across the Yukon River Basin transitions from near average in the Canadian headwaters to above average on most of the U.S. side. Snowpack rapidly decreases to below average near the west coast due to persistently warm winter temperatures.
Snowpack remains above average across the Tanana and Koyukuk river basins, and across the Brooks Range and North Slope, with snowpack levels between 120 - 150% of average. The highest snowpack departures in the state are found in the Chena Basin north of Fairbanks, with snow courses from 140% to over 200% of average.
In contrast, the Porcupine River Basin is near average for March 1st, with about half the snowpack of last year’s record-setting levels. The Kuskokwim River Basin is experiencing well below average snowpack conditions, particularly in the lower basin, a stark contrast to last season’s well above average snowpack.
In Southcentral Alaska, snowpack is highly dependent on elevation. Above 1,500 - 2,000 feet, conditions are near average, whereas at lower elevations, much of the snowpack has already melted out. The Copper River Basin is generally near average for March 1st, but exhibiting this elevation dependence.
Alaska Seasonal Outlook
Temperatures in April and May are the most critical factor determining the severity of ice breakups. Dynamic breakups, with a high potential of ice jam flooding, typically require cooler than average temperatures in early April, followed by a rapid transition to warm, summer-like temperatures in late April or early May.
The CPC three-month outlook (April - June) favors above average temperatures across the North Slope and West Coast, with equal chances of above, average, or below average temperatures for the remainder of the state.
Current guidance suggests a potential trend toward above average temperatures in April across much of the state, which could decrease the ice jam flood risk. A warmer-than-expected April could lead to a more prolonged and steady melt, reducing abrupt breakup and severe ice jams. If this warming trend continues, it could even lessen the ice jam risk even in areas with high snowpack, such as the Upper/Middle Yukon and Tanana river basins. The warmer temperatures, however, would increase the snowmelt flood risk in the basins with above average snowpack.
Spring Flood Outlook and Implications for Gulf of America and Chesapeake Bay Hypoxia
In the northern Gulf of America, a large area of low-oxygen forms in the bottom waters during the summer months, often reaching in excess of 5,000 square miles. This area of low-oxygen, otherwise known as the “dead zone”, is strongly influenced by precipitation patterns in the Mississippi-Atchafalaya River Basin (MARB), which drains over 41% of the CONUS. Changes in precipitation influence river discharges into the Gulf, which carry the majority of nutrients fueling the annual dead zone, so examining spring flood risk in the basin can provide a useful indicator of the possible size of the dead zone during the summer.
The predicted spring flood risk across the MARB will likely lead to normal hypoxic conditions in the northern Gulf of America this summer. Most of the MARB is not predicted to experience moderate or major flooding this spring. Absent major flooding, normal springtime discharges of nutrients and freshwater from the Mississippi River are predicted.
In the Chesapeake Bay, recurring summer hypoxia has also been linked to nutrient loading and river discharge, especially from the Susquehanna and Potomac rivers. The spring flood outlook for these basins does not indicate any areas at risk of moderate or major flooding. As a result, an average hypoxia zone for the Chesapeake Bay under typical summer conditions is expected.
Flood conditions, should they occur in the Mississippi-Atchafalaya, Susquehanna, and Potomac rivers, may lead to higher-than-average springtime discharges and promote formation of a larger hypoxia area.
The spring flood outlook provides an important first look at some of the major drivers influencing summer hypoxia in the Gulf of America and Chesapeake Bay. In early August, NOAA will measure and report on the size of the hypoxia zone as part of efforts through the Mississippi River/Gulf of America Hypoxia Task Force to evaluate efforts aimed at reducing nutrient loading to the Gulf of America.
Appendix
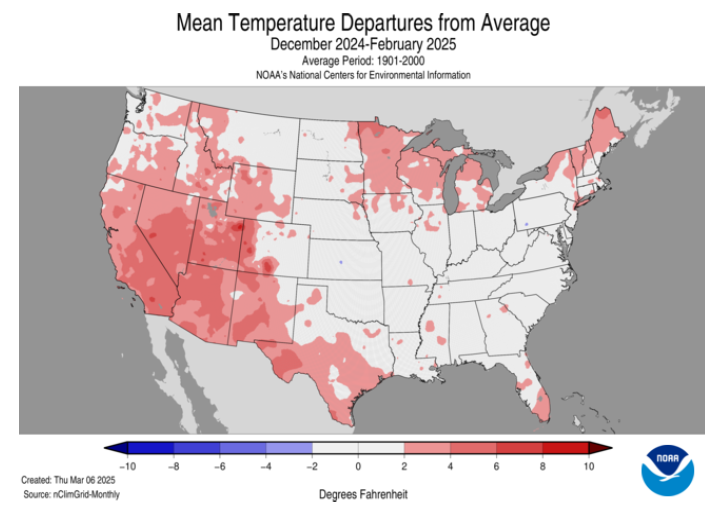
Figure 1: Winter 2024-2025 Departure from Average Temperature (NOAA/NCEI)
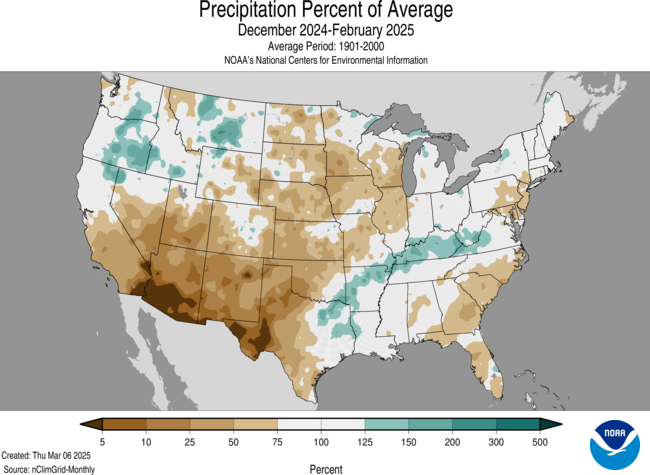
Figure 2: Winter 2024-2025 Percent of Average Precipitation (NOAA/NCEI)
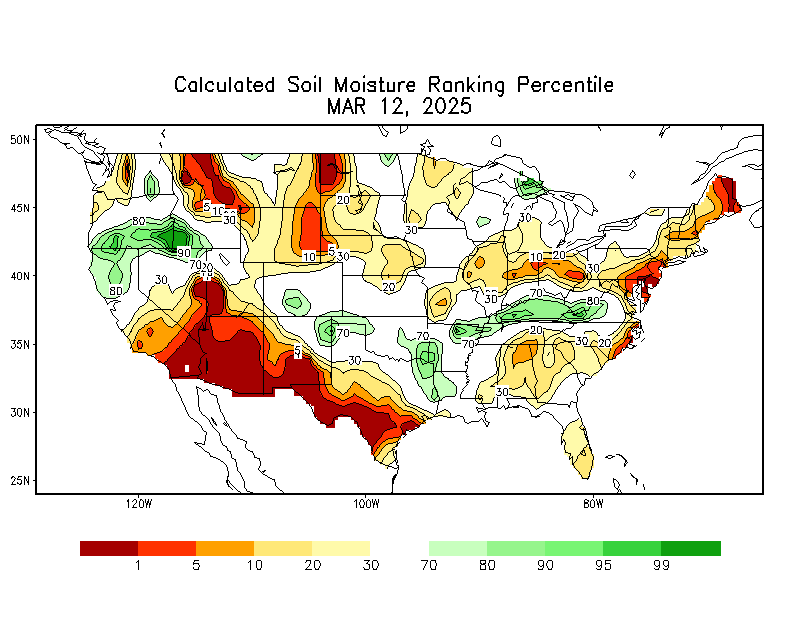
Figure 3: CPC Soil Moisture Percentile Map
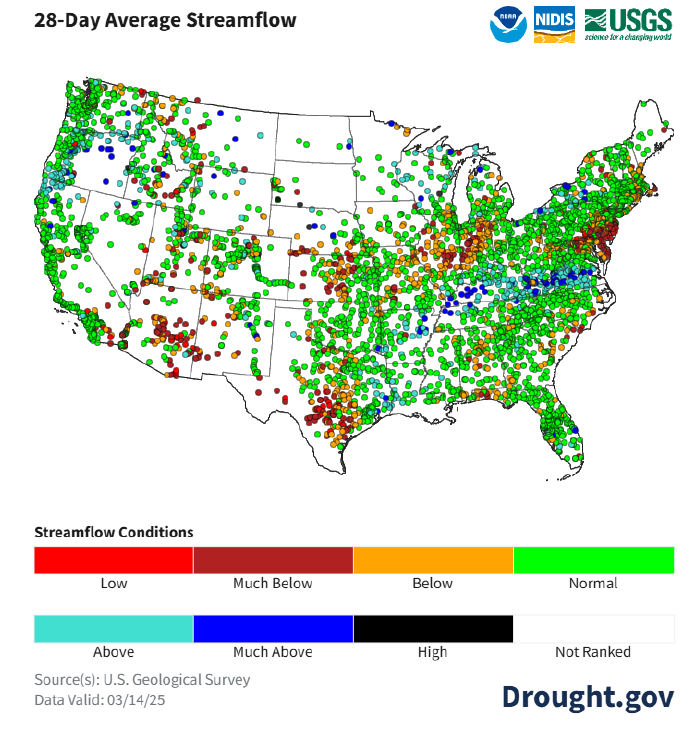
Figure 4: 28 Day Average Streamflow (USGS)
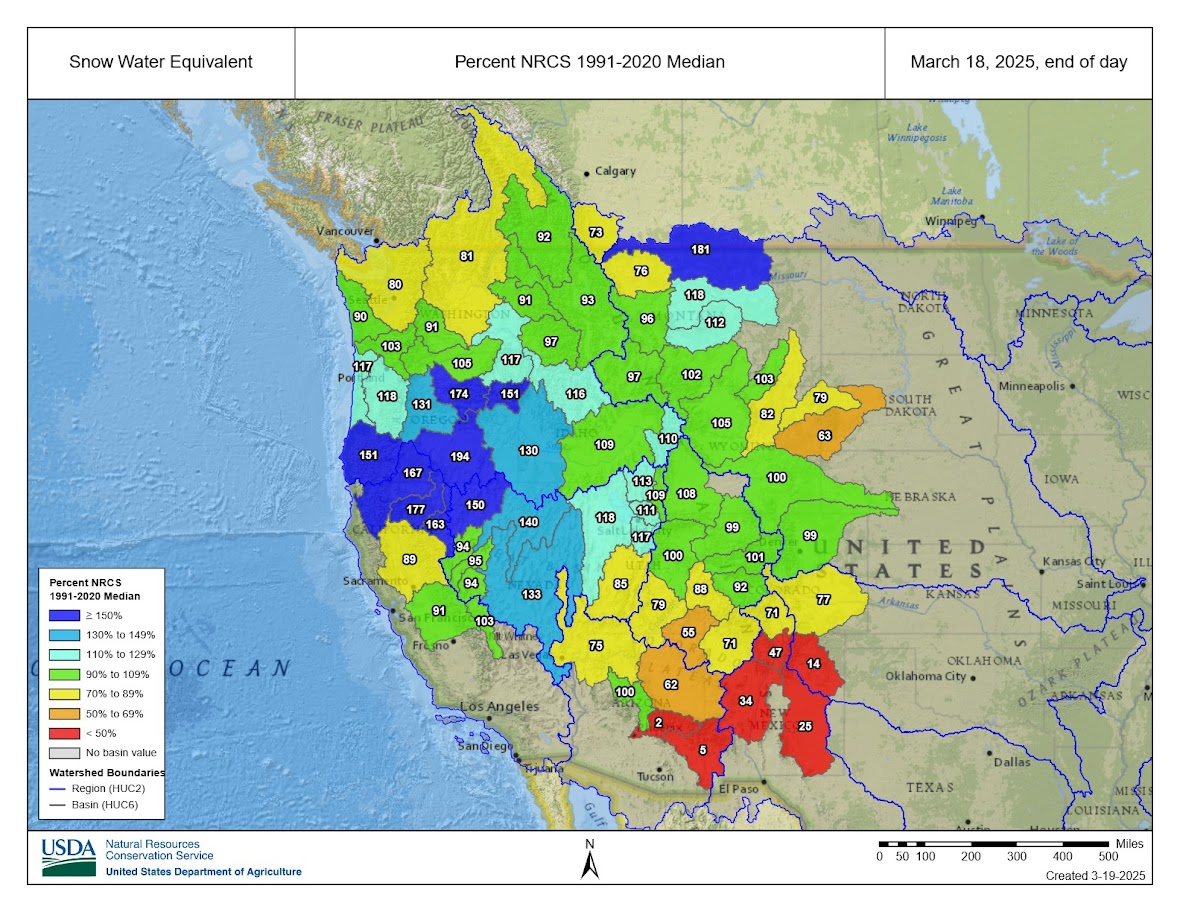
Figure 5: Snow Water Equivalent Percent of Median (NRCS)
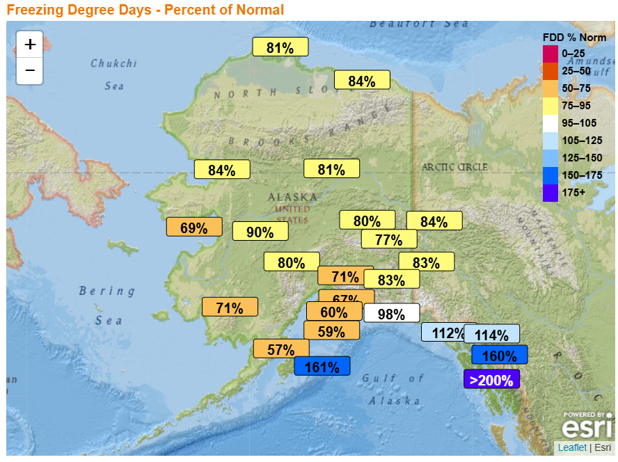
Figure 6: Accumulated Freezing Degree Days (FDDs), Percent of Normal as of March 12th, 2025 (NWS/APRFC)
| River |
% of Normal Runoff |
| Columbia River at Grand Coulee, WA |
90% |
| Snake River at Lower Granite Dam, ID |
105% |
| Columbia River at The Dalles, OR |
90% |
| Sacramento River Basin, CA (combined) |
100% |
| San Joaquin River Basin, CA (combined) |
80% |
| Bear River near Utah-Wyoming Stateline |
85% |
| Weber River near Oakley, UT |
80% |
| Provo/Utah Lake at Jordan, UT |
100% |
| Green River at Flaming Gorge Reservoir, UT |
80% |
| Colorado River near Cameo, CO |
90% |
| Colorado River at Lake Powell, AZ |
75% |
| Upper Missouri Basin above Fort Peck, MT |
80% |
| North Platte Basin above Seminoe Reservoir, WY |
75% |
| South Platte Basin at South Platte, CO |
60% |
| Arkansas River above Pueblo Reservoir, CO |
80% |
| Rio Grande at Del Norte, CO |
70% |
Table 1: Seasonal water supply forecast volumes at key locations in percent of normal runoff
|

