Winter Weather Awareness Week is November 1-7, 2015
U.S. Winter Weather Outlook| Snow Accumulation Potential Experimental - Leave feedback |
||
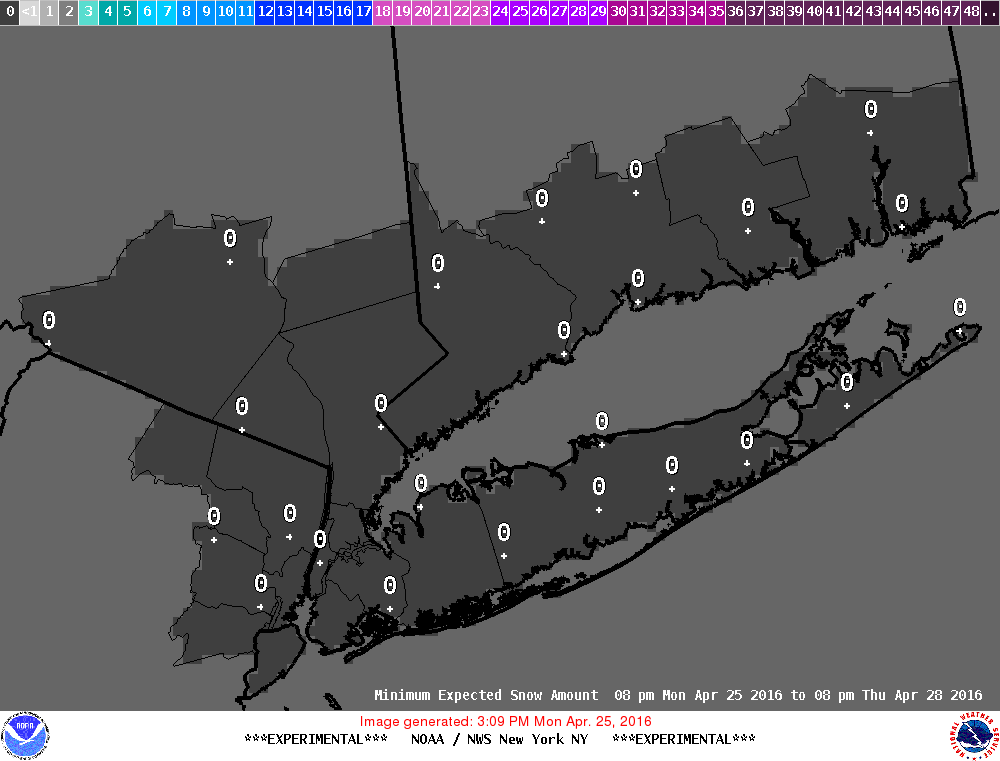
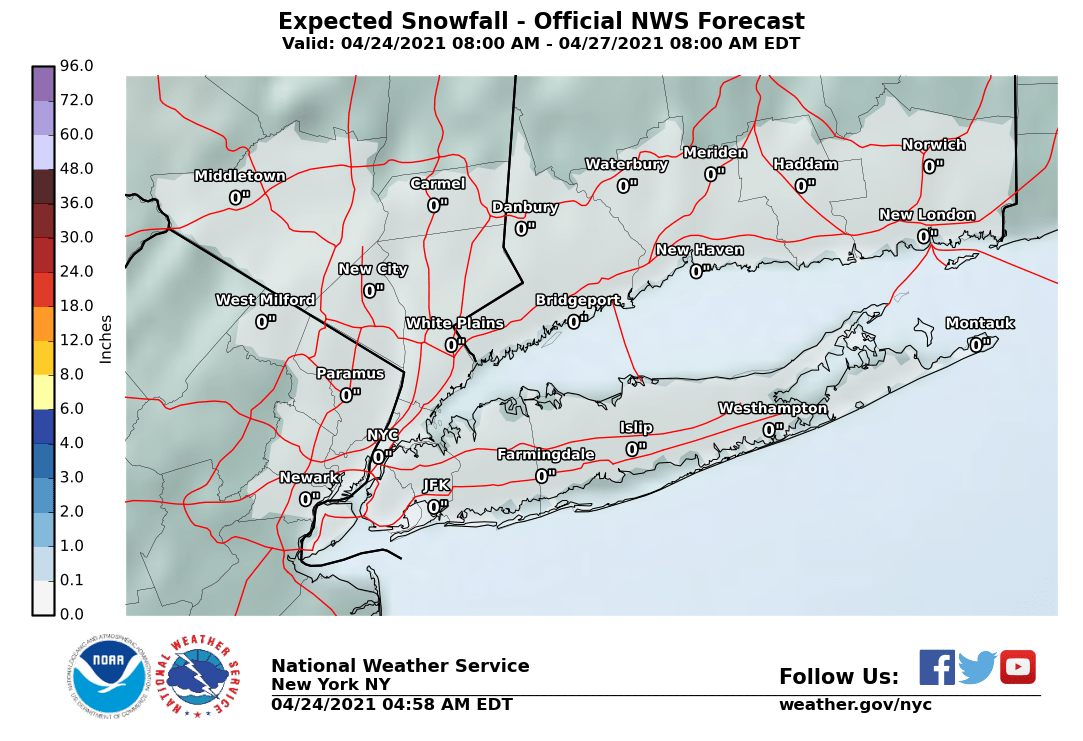
| Minimum | MOST LIKELY SNOWFALL | Maximum |
|---|---|---|
|
Expect at least this much:
|
Potential for this much:
|
|
 |
  |
 |
| What's this? | What's this? | What's this? |
Minimum Potential AccumulationExpect at least this much. This is what we see as the least amount of snow the storm can produce. This information is for advance planning ahead of the storm. It is provided out as far as three days. However, when the snow starts to fall, this will be discontinued to focus on the forecast snow amount. Most Likely Snow AccumulationRepresents our official snow forecast in inches within the next one to three days. The snowfall amounts are provided in point (single number) and ranges (1-2", 2-4", etc.). You can toggle between the two by hovering over the "Point" and "Range" text above the image. The point amount is our forecast but the range for the "most likely" represents the forecast uncertainty in predefined ranges. CloseMaximum Potential AccumulationWhat you should be prepared for. This is what we see as the storm's maximum potential snowfall accumulation. This information is for advance planning ahead of the storm. It is provided out as far as three days. However, when the snow starts to fall, this will be discontinued to focus on the forecast snow amount. Close |
||
Represents our official ice forecast in inches within the next one to three days. The ice accumulation amounts are provided in ranges.
Close
| Other Snow/Ice Information | ||
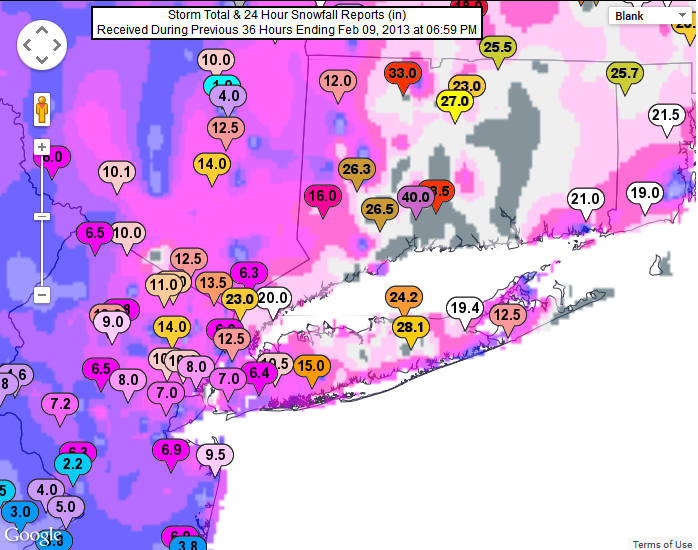
| Storm Track | Reported Snow/Ice Totals | |
|---|---|---|
 |
 |
|
| What's this? | What's this? | |
Low Tracks GraphicThe graphic depicts the forecast location of significant surface lows impacting the 48 contiguous United States in 12 hour increments out to 72 hours into the future. The low position and track forecast by NCEP WPC meteorologist is in white. Each low position is accompanied by a lead time (Eastern Time). The circles around each low represents a 75% probability the observed low will be located with the circle. Note: The probability is derived using previous season's verification data. For reference, existing surface lows are depicted with a red marker without yellow circles. CloseReportedAs snow and/or ice reports come into the NWS (you can email reports to okx-report@noaa.gov or Tweet to @NWS_BaltWash), we will pass them on here. With the map linked here, and the supporting reports below it, you can keep tabs on how much has fallen. |
||
| Active Watches/Warnings/Statements | |
| Percent Chance That Snow Accumulation Will Be Greater Than... Experimental - Leave feedback What's this? Exceedance ProbabilitiesRepresents the likelihood of exceeding a specific snowfall amount. Thresholds are 0.1", 1", 2", 4", 6", 8", 12", and 18". This product is designed to indicate high or low confidence in the official snowfall forecast. Example: An 80% chance of exceeding 2" means that we have a high confidence that it will snow at least 2". Conversely, a 10% chance of exceeding 18" means that we have high confidence that it will snow less than 18". Close
|
||||||||||||||||
|
||||||||||||||||
| Chance of Snow Accumulation Experimental - Leave feedback What's this? Snow AccumulationRangesRepresents the likelihood of various snowfall ranges. Amounts ranges are 0", 1-2", 2-4", 4-6", 6-8", 8-12", 12-18" and 18" +. This product is designed to indicate high or low confidence in the official snowfall forecast. ExceedanceRepresents the likelihood of exceeding a specific snowfall amount. Thresholds are 0.1", 1", 2", 4", 6", 8", 12", and 18". This product is designed to indicate high or low confidence in the official snowfall forecast. |
|
|
| Long-Range Forecast | |
| Days 4-5 Forecast Precipitation | Days 6-7 Forecast Precipitation |
 |
 |
|
Days 6-10 |
|
| Temperature | Precipitation |
 |
 |
|
Days 8-14 |
|
| TEMPERATURE | PRECIPITATION |
 |
 |
|
Week 3-4 |
|
|
TEMPERATURE |
PRECIPITATION |
 |
 |
|
|
||||
|
|
|
|
|
|
|
|
||||||||||||
 |
 |
Adjacent Radars:
|
||||||||||
|
|
|
|
|
|
||
|
& Advisories |
Statistics |
Measure Snow |
|
|
||
|
|
|
|
|
|
|

Winter Weather Criteria
Past Holiday Weather for Central Park
Snowfall/Snowpack Information
More Winter Weather Information
|


 Coastal Flooding