
JUMP TO:
Extreme heat is a major weather killer in the United States (Robinson 2001). Data gathered from the National Centers for Environmental Information (NCEI, formerly the National Climatic Data Center) (figure 1) shows that in a 12 year period from 1998 to 2009, heat has caused the most deaths for 5 out of the 12 years. Although this is not more than half of the years, it comes out number one in more years than any other weather related phenomenon. Looking at the 12 year average however clearly shows that heat comes out ahead of all the other phenomena, with an average of 154 deaths, followed by convection with 129. The only time heat is surpassed by a large margin is with Hurricane Katrina in 2005 where over 1000 people were killed. 1999 saw a peak in heat related fatalities, likely due to the extremely hot summer (Pollina et al., 2013).
Figure 1. Weather related fatalities from 1998-2009.

Climate change is a well established scientific fact. The Fifth Assessment Report from the Intergovernmental Panel on Climate Change states that "the science now shows with 95% certainty that human activity is the dominant cause of observed warming since the mid 20th century". Climate models show that there will be anywhere from a 0.5°C to just under 4.5°C increase in global temperatures at the surface by the year 2100 (Cubasch et al. 2013). As temperatures warm in the future, humans will become more susceptible to the effects of extreme heat.
Urban areas are more likely to suffer from extreme heat due to the urban heat island effect, a well known meteorological phenomenon where urban areas are warmer than the surrounding rural areas due to storage of short wave radiation in the concrete, asphalt, and buildings of the urban setting as opposed to the vegetative nature of the rural areas (Solecki et al. 2005, U.S. EPA 2013). Nighttime temperatures show a more drastic difference between urban and rural areas as opposed to daytime temperatures. For example, temperatures on a calm, cloudless night can be up to 20 degrees cooler at Westhampton Beach, NY than in Central Park, NY, which is located 70 miles east of Central Park. Therefore, extreme heat becomes more of a problem for urban areas, especially so given the fact that the global temperature is expected to continue to increase in the future.
The Earth is warming and urban areas will be more at risk for extreme heat, but why even care about heat since we have air conditioning? Air conditioning has become more prevalent in NYC over the decades. In 1970, only about 39% of NYC households had air conditioning. By 1987, that figure increased to 57%. By 2009, close to 88% of all households in NYC has air conditioning (United States Census Bureau). It would seem that with air conditioning becoming more prevalent, we need not worry about heat. That would be true if NYC stood at 100% of all households with air conditioning, but as of 2009, it does not. Some cannot afford it, such as the elderly and those in lower socioeconomic areas. But also, what would happen if a storm Such as Superstorm Sandy occurred in the summer? That could leave potentially millions of people without power and therefore air conditioning, even if 100% of NYC households had air conditioning.
What is a heat wave? There is no standard definition. In 1901, A.T. Burrows defined a heat wave (or as he termed it, hot wave) as 3 or more days in which the maximum temperature in the shade reached or exceeded 90°F. Robinson et al. (2001) notes that there is a lack of rigorous definition, although he does provide a basic definition as "it is an extended period of unusually high atmosphere-related heat stress, which causes temporary modification in lifestyle and which may have adverse health consequences for the affected population." The Glossary of Meteorology from the National Weather Service defines a heat wave as "a period of abnormally and uncomfortably hot and usually humid weather", but does note that it is based on what is normal for a given region of the world. For example, what is warm in Maine is not considered warm in the U.S. Southwest. A locally defined heat wave will be advantageous in many ways. For the public, when a heat wave is forecast, steps can be taken to alleviate heat stress, such as opening cooling centers as is done in NYC when heat advisories or excessive heat warnings are issued. It will also give clarification for the public. In places where there are no locally defined heat waves, the public may be confused as to whether 2 or 3 days constitutes a heat wave. This may not seem like much of a difference, but the prolonged nature of heat waves, which may contain days of excessive heat, can have negative side effects. Epidemiologic analysis conducted by the NYC Department of Health and Mental Hygiene revealed that there is a cumulative impact on consecutive days of extreme heat, with each day adding to the risk of previous days (Metzger 2010). Finally, it would provide a standard definition for local media, especially in a high market area such as NYC, where multiple media outlets could define a heat wave anyway they see fit.
Because extreme heat is a major killer and the effects of heat waves (which need to be locally defined) are cumulative, along with the fact that the global temperature is expected to continue and urban areas are warmer than their surrounding rural areas, a heat wave study of NYC is needed. This heat wave study will answer the following questions:
The results from this study could be used by forecasters of the local Weather Forecast Office (WFO) of New York, NY (OKX) to better forecast these events. If forecasters are better able to predict the onset of a heatwave, they will be able to alert the public about an impending heat wave, allowing the public to take the necessary precautions to prepare for the heatwave. It will also allow Emergency Managers (EM) to take precautions to keep the public healthy by opening up cooling centers.
This study uses the Central Park observations for its data because out of all 3 stations in NYC (JFK and LaGuardia being the other 2), Central Park has the longest history of data and would therefore better represent the climate of NYC. The daily maximum temperatures throughout the entire data set were examined and any period where the maximum temperature reached or exceeded 90°F for 3 consecutive days or more was determined to be a heatwave. These temperatures were obtained from NCEI and Weather Underground. The period of record for this project is 1876-2011 for a total of 135 years' worth of data. The daily maximums were averaged together for each day of a heat wave to gain an understanding of what types of maximum temperatures we see during these events and how they evolve from a day to day basis is. For example, all the day 1 maximum temperatures were averaged in a 3 day heatwave and compared to day 2 and day 3 to understand the temporal evolution. The same was done for the daily minimum temperatures during these heat waves to gain the same understanding.
3-hourly temperature and dew point was also obtained from NCEI and Weather Underground. Unfortunately, the 3-hourly data set does not span the entire daily maximum data set. 3-hourly data is available from 1965-1982 and from 1996-2011 for a total of 34 year. From there, the heat index (HI) was determined, using the following formula:
HI=c1+c2T+c3R+c4TR+c5T^2+c6R^2+c7T^2R+c8TR^2+c9T^2R^2 (Rothfusz 1990) where:
c1=-42.379
c2=2.04901523
c3=10.14333127
c4=-0.22475541
c5=-6.83783
c6=-5.481717*10^-2
c7=1.22874*10^-3
c8=8.5282*10^-4
c9=1.99*10^-6
T=temperature
R=Relative Humidity (RH)
The HI was only calculated for ambient temperatures of 80°F or greater. In a similar fashion to the daily maximum, the 3-hourly temperatures, dew points, RHs, and HIs were averaged during the heatwave events to gain an understanding of how these variables evolve throughout the daytime heating.
The National Centers for Environmental Prediction/National Center for Atmospheric Research (NCEP/NCAR) reanalysis (data available from 1948-2017) and the North American Regional Reanalysis (NARR) (data available from 1979-2017) were used to composite the large-scale flow evolution and other variables for the heat wave events. Daily composites were created using the websites https://www.esrl.noaa.gov/psd/data/composites/hour/ and https://www.esrl.noaa.gov/psd/cgi-bin/data/narr/plotday.pl (Kalnay and Coauthors 1996). Identifying these patterns in numerical weather prediction (NWP) models will alert forecasters to the potential for a heatwave.
850 hPa temperatures from OKX soundings (about 60 miles east of NYC) were obtained through the University of Wyoming (data available from 1995-2017). Composites from the aforementioned models show that the 850 hPa temperatures during these events were very similar to the averaged 850 hPa temperatures obtained from the OKX soundings and therefore the 850 hPa temperatures from the soundings were used, since actual observations would likely be more accurate than a model. 850 hPa temperatures are important because they are often used to predict surface temperatures.
Daily surface maps of the heatwave events were downloaded from the Weather Predictions Center and manually inspected to determine what type of surface high pressure is most common during these events. The Yarnal (1993) synoptic classification system was used to classify the high pressure systems. Yarnal identified eight different types of surface pressure patterns over the Northeast United States (NEUS). The “pre-high” synoptic type occurs when surface high pressure builds southeastward over the NEUS (Fig. 2a), which typically occurs after the passage of a cold front. With the surface high centered to the northwest of the NEUS there is usually northwesterly flow. For the “extended high” (Fig. 2b), the center of surface high pressure is directly over the NEUS, with light winds across the region. The “back of high” pattern has the center of the high located just to the east of the East Coast (Fig. 2c), which allows for southwesterly flow over the NEUS region. With “high to the south” (Fig. 2d), there is also typically a corresponding area of lower pressure to the north, with surface westerly flow between the two pressure centers. On the other hand, a high to the north and a corresponding low to the south allows for an easterly flow across the NEUS (Fig. 2e).
Figure 2a-e. High pressure types to affect the NEUS.

There were 263 separate heatwave events to affect Central Park between 1876 and 2011 (Fig. 3). This works out to be just under 2 per year (135 years*2=270). There were 134 3-day heatwave events, which is just about 1 per year. 4-day heatwaves occur a little under half as much as 3-day events, with a total of 63 events, or about once every other year. 5-day heat waves occur just over half as much as 4-day and a quarter as much as 3-day events, with a total of 36 events. That works out to be once every 3.75 years. 6-day heat waves and higher are not statistically significant and occur more randomly, so results from here on out will largely reflect 3-, 4-, and 5-day heat waves. The earliest a heatwave has occurred is April 16-18 2002 (a close 2nd was April 17-19 1976). The latest a heatwave has occurred is September 21-23 1914. The highest order heatwave to ever occur in Central Park is 12, from August 24 to September 4 1953.
Figure 3. Frequency of heat waves to affect Central Park from 1876-2011.

This climatology is based on maximum temperatures. Therefore, the maximum temperatures for each day of each heat wave type (3-day, 4-day, 5-day, etc.) was taken and averaged. The results are shown in figure 4. 3-day heat waves start out with high temperatures in the lower 90s (92.3ºF to be exact), then warm to the lower to middle 90s (93.5ºF), then cool slightly (93ºF). The 4 and 5-day heat waves follow a similar pattern of warming and then cooling. 4-day heat waves warm through day 3 and then cool on the last day of a heat wave. 4-day heat waves start off in the lower 90s (92.6ºF) then gradually warm to the middle 90s by day 3 (94.9ºF), then cool to the lower 90s by day 4 (93.1ºF). 5-day heat waves start off in the lower 90s (91.9ºF), then warm into the middle to upper 90s (96ºF), then cool to the lower to middle 90s by day 5 (93.8ºF). High temperatures for 4-day heat waves are consistently warmer than 3-day heat waves (comparing days 1, 2, and 3). Except for day 1, 5-day heat waves are warmer than 3-day heat waves (comparing days 1, 2, and 3) and 4-day heat waves (comparing days 1, 2, 3, and 4). This graph has great forecasting value. After looking at this plot, a forecaster may want to forecast slightly higher temperatures on day 2 of a 3-day heat wave compared to day 1, since, on average day 2 is warmer than day 1. If a 3-day heat wave is extended to become a 4-day heat wave early in the forecast period, temperatures may need to be increased since on average, 4-day heat waves are warmer than 3-day heat waves.
Figure 4. Average high temperatures for each day of 3-day, 4-day, and 5-day heat waves.

Table 1 shows the statistics for maximum (high) temperatures of each day a 3-day heat wave. The minimum high temperatures (which are set to 90ºF, since this is the definition of a heat wave), 25th percentile (meaning that 75% of all observations are above this value), median (the midpoint of all the observations), 75th percentile (meaning that 25% of all observations are above this value), maximum high temperatures, and standard deviation were all calculated for all the high temperatures of each day. Box and whisker diagrams were also created (figure 5) to help visualize the range of values. In figure 5, the lower end whisker is the minimum high. The lower portion of the red box represents the 25th percentile. The median is the small dashed line inside the red box. The top of the red box represents the 75th percentile. Finally, the top whisker represents the highest observation recorded. All these variables follow the trend of the averages, that being a slight increase in the temperatures between days 1 and 2, then a decrease from days 2 to 3.
Table 1. Minimum, 25th percentile, median, 75th percentile, maximum, and standard deviation for high temperatures of each day of a 3-day heat wave.
| Day | Minimum High | 25th Percentile | Median | 75th Percentile | Maximum High | Standard Deviation |
| 1 | 90 | 91 | 92 | 93 | 101 | 2.4 |
| 2 | 90 | 92 | 93 | 95 | 103 | 2.7 |
| 3 | 90 | 91 | 92 | 94.75 | 102 | 2.6 |
Figure 5. Box and whisker diagrams for days 1-3 of 3-day heat waves for maximum temperatures. The bottom whisker is the lowest maximum temperature recorded on each day (all 3 are 90ºF since this is the lowest possible temperature given our definition of a heatwave). The bottom portion of the red box is the 25th percentile, the small dashed line inside the red box is the median, the top portion of the red box is the 75th percentile, and the top whisker is the highest maximum temperature recorded.

Table 2 shows the statistics for high temperatures of each day a 4-day heat wave and figure 6 is the respective box and whisker diagrams.
Table 2. Same as in Table 1 except for 4-day heat waves.
| Day | Minimum High | 25th Percentile | Median | 75th Percentile | Maximum High | Standard Deviation |
| 1 | 90 | 91 | 92 | 94 | 101 | 2.4 |
| 2 | 90 | 92 | 93 | 96 | 104 | 3.1 |
| 3 | 90 | 93 | 95 | 97 | 103 | 3.1 |
| 4 | 90 | 91 | 93 | 95 | 100 | 2.5 |
Figure 6. Same as figure 5, except for 4-day heat waves.
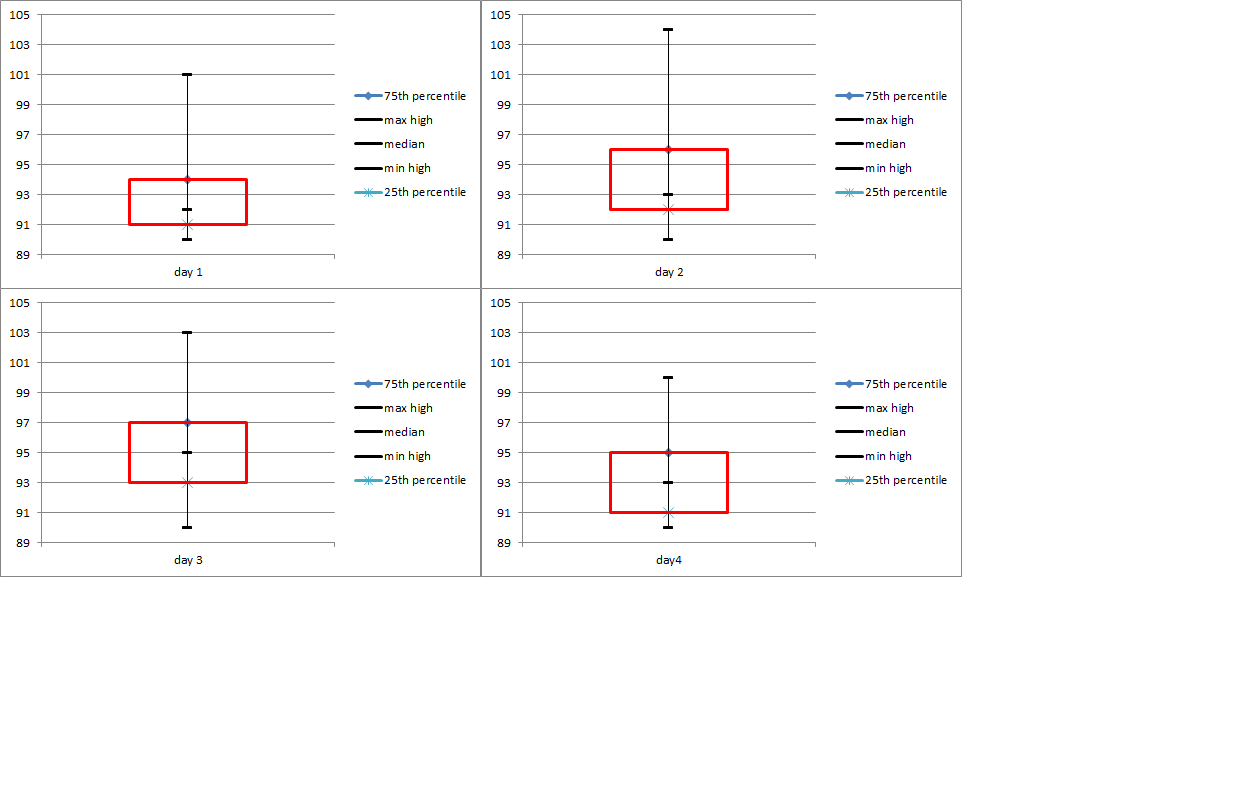
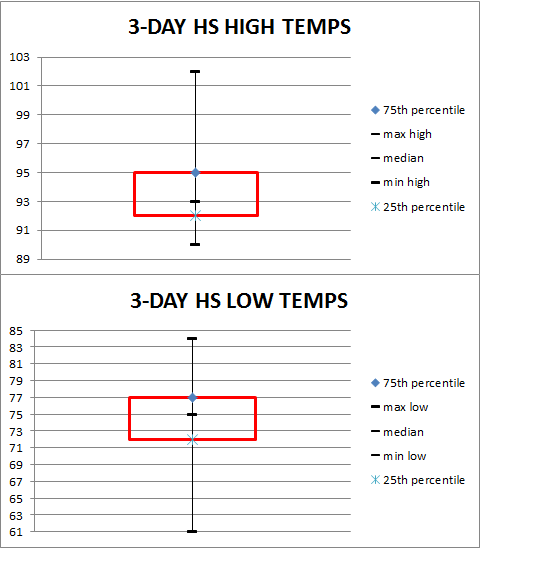
Table 3 shows the statistics for high temperatures of each day a 5-day heat wave and figure 7 is the respective box and whisker diagrams.
Table 3. Same as in Table 1, except for 5-day heat waves.
| Day | Minimum High | 25th Percentile | Median | 75th Percentile | Maximum Percentile | Standard Deviation |
| 1 | 90 | 90 | 91 | 93 | 101 | 2.3 |
| 2 | 90 | 92 | 94 | 96 | 103 | 3.0 |
| 3 | 90 | 93 | 96 | 98.25 | 106 | 3.8 |
| 4 | 90 | 93 | 94.5 | 97.25 | 102 | 3.3 |
| 5 | 90 | 92 | 94 | 95.25 | 101 | 3.0 |
Figure 7. Same as Figure 5 except for 5-day heat waves

Average low temperatures (fig. 8) follow a similar pattern with a steady increase in temperatures through each type of heat wave, and then cooling toward the end. 3-day heat waves start out with lows in the lower 70s on average (70.8ºF) for day 1, then warm into the middle 70s (74.2ºF) for day 2, then cool slightly on the 3rd day (73.9ºF). Average low temperatures on 4-day heat waves start out in the lower 70s as well. In fact, low temperatures on the first day of a 4-day heat wave are exactly the same as the first day of a 3-day heat wave (70.8ºF). Temperatures steadily warm on days 2 and 3 (74.5ºF and 75.3ºF respectively), and then cool on day 4 (73.8ºF). 5-day heat waves start out almost 2ºF cooler than 3 and 4-day heat waves with lows in the upper 60s on average (68.7ºF on day 1), then warm into the middle 70s from days 2 through 4 (73.4ºF, 75.1ºF, and 75.1ºF respectively), with cooler temperatures on day 5 (73.4ºF). Low temperatures on 5-day heat waves are not only cooler for the 1st day, but 2nd and 3rd days as compared to 3 and 4-day heat waves. It is not until day 4 that 5-day low temperatures become warmer than 4-day heat waves.
Figure 8. Same as in figure 4, but for low temperatures.

The 3-day heat wave low temperature statistics are shown in Table 3 and box and whisker diagrams are shown in figure 9. Since the criteria for a heat wave is based on high temperatures, there is no lower limit for low temperatures.
Table 4. Same as in Table 1, except for low temperatures.
| Day |
Minimum Low |
25th Percentile | Median | 75th Percentile | Maximum Low | Standard Deviation |
| 1 | 58 | 68 | 71 | 74 | 80 | 4.1 |
| 2 | 66 | 72 | 74 | 77 | 82 | 3.4 |
| 3 | 62 | 72 | 74 | 76 | 84 | 3.5 |
Figure 9. Same as in Figure 5, except for low temperatures. Note: there is no set minimum temperature for lows, since heatwaves in this study are based on high temperatures.

Table 5. Same as in Table 4, except for 4-day heatwaves.
| Day | Minimum High | 25th Percentile | Median | 75th Percentile | Maximum High | Standard Deviation |
| 1 | 61 | 68 | 71 | 73 | 79 | 3.7 |
| 2 | 68 | 73 | 74 | 76 | 84 | 3.1 |
| 3 | 68 | 73 | 75 | 77 | 83 | 3.4 |
| 4 | 60 | 72 | 74 | 77 | 84 | 4.3 |
Figure 10. Same as in figure 9, except for 4-day heatwaves.

Table 6. Same as in Table 4, except for 5-day heatwaves.
| Day | Minimum High | 25th Percentile | Median | 75th Percentile | Maximum Percentile | Standard Deviation |
| 1 | 60 | 67 | 68.5 | 71.25 | 77 | 3.8 |
| 2 | 67 | 70 | 74 | 76 | 80 | 3.4 |
| 3 | 69 | 72 | 75.5 | 77 | 82 | 3.1 |
| 4 | 65 | 74 | 75.5 | 77 | 79 | 2.7 |
| 5 | 63 | 71 | 73 | 77 | 80 | 4.3 |
Figure 11. Same as in figure 9, except for 5-day heatwaves.

The next plot (Fig. 12) shows the distribution of each heatwave event through the decades, beginning in the 1880s (although data began in 1876, it was not a complete decade, and was not included in this plot). One of the key things to note with this plot is that prior to the 1930s, rarely do we see anything higher than a 5-day heatwave event. There were two 6-day heatwaves in the 1890s and one 7-day heatwave in the 1900s, but other than that, 3-, 4-, and 5-day heatwaves dominated. From the 1940s and onward, higher order heatwaves become more prevalent. From the 1880s to the 1920s, there is a peak in 3-day heatwaves in the 1890s (occurring 9 times that decade). From the 1930s to the 1990s, 3-day heat waves occur at least as much as the peak of 9 in the 1880-1920 period with a peak in 3-day heat waves occurring in the 1930s with 15 events. 3-day heat waves drop below this peak in the 2000s, with a total of only 7, but there were more higher order events (two 6-day and one each of 8 and 9-day events). Along with an increase in higher order events from the 1930s-2000s is an increase in 4-day heatwaves (outside of the peak of 9 in the 1940s). This plot may reflect the changes occurring with climate change. The increase in 3-day heatwaves beginning in the 1930s and the prevalance of higher order heat waves after the 1940s at least shows more 90+ days and longer duration events.
Figure 12. Number of heatwave events per decade for 3-day through 12-day heatwave events.

The next plot shows the number of heatwaves per month (Fig. 13). 3-, 4-, and 5-day heat waves are shown, along with All, which is the sum of all 3 heat-wave event types. A heat wave that started in a specific month and spanned over 2 months counted toward the month it started in. For example, if a 4-day heat wave began on August 31 and ended on September 3rd, it was counted as an August heat wave. Heat waves can start as early as April (2 3-day heat waves) and can occur as late as September (7 3-day events and 3 4-day events for a total of 10 separate September events). The number of heat waves steadily increases from April through July, which is the most likely time to see a heat wave (118 separate events, which is ~45% of all events). The number of heat waves drop in August, but are still more numerous than June overall (70 in All events in August vs. 55 in June). This is mainly because 3-day heat waves are more likely to occur in August than in June (40 events vs. 26 respectively). 4-day heat waves are less likely in August vs. June (10 vs. 19 respectively), while 5-day heat waves are about the same (9 vs. 10 respectively). There were no 4- or 5-day heatwave events reported in April, and no 5-day heat waves reported in September.
Figure 13. Number of heat waves reported by month for 3-day, 4-day, 5-day, and All events. All is the total sum of all 3 different heatwave types.

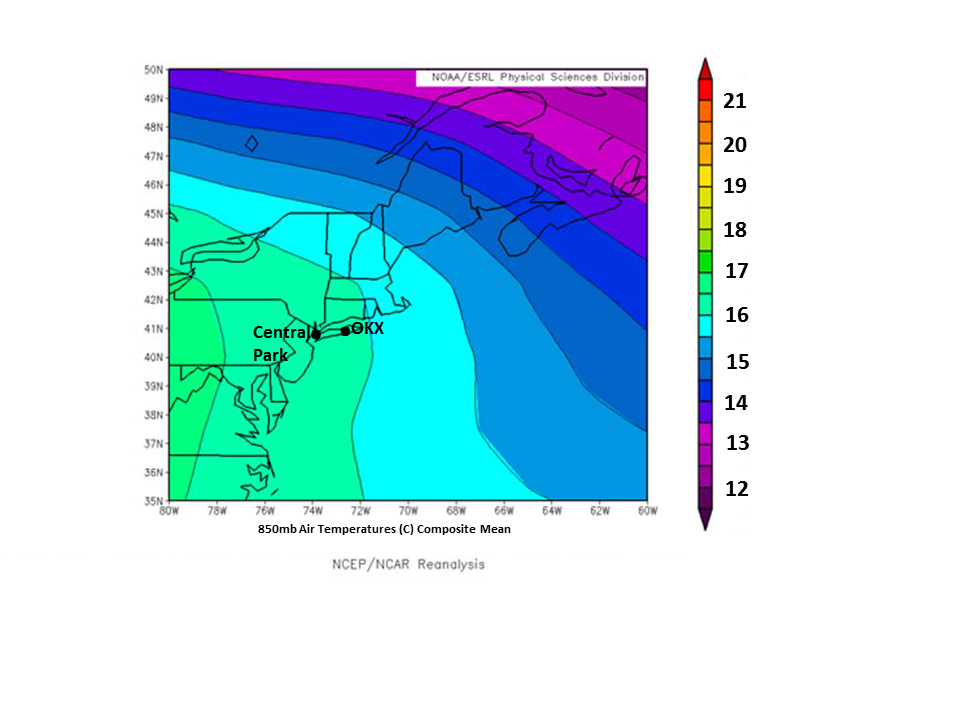
850 hPa temperatures are extremely important when forecasting. This temperature is often used because it is typically high enough off the surface to not be influenced by frictional forces by the wind and the surface. This temperature on a sounding can be followed adiabatically to the surface on sunny days to forecast surface temperatures. A composite of 850 hPa temperatures was created (fig. 14). This composite is the average of all the 1st days of a 3-day heatwave. These composites show that the 850 hPa temperatures over Central Park were similar to those over OKX during these events (between 16°C and 17°C). All composites (all days across 3-, 4-, and 5-day heatwaves) show similar results (see figs. 35-37).
Figure 14. Composite 850 hPa temperatures across the NEUS, with Central Park and OKX labeled for the 1st day of a 3-day heatwave. Temperatures are in ºC .
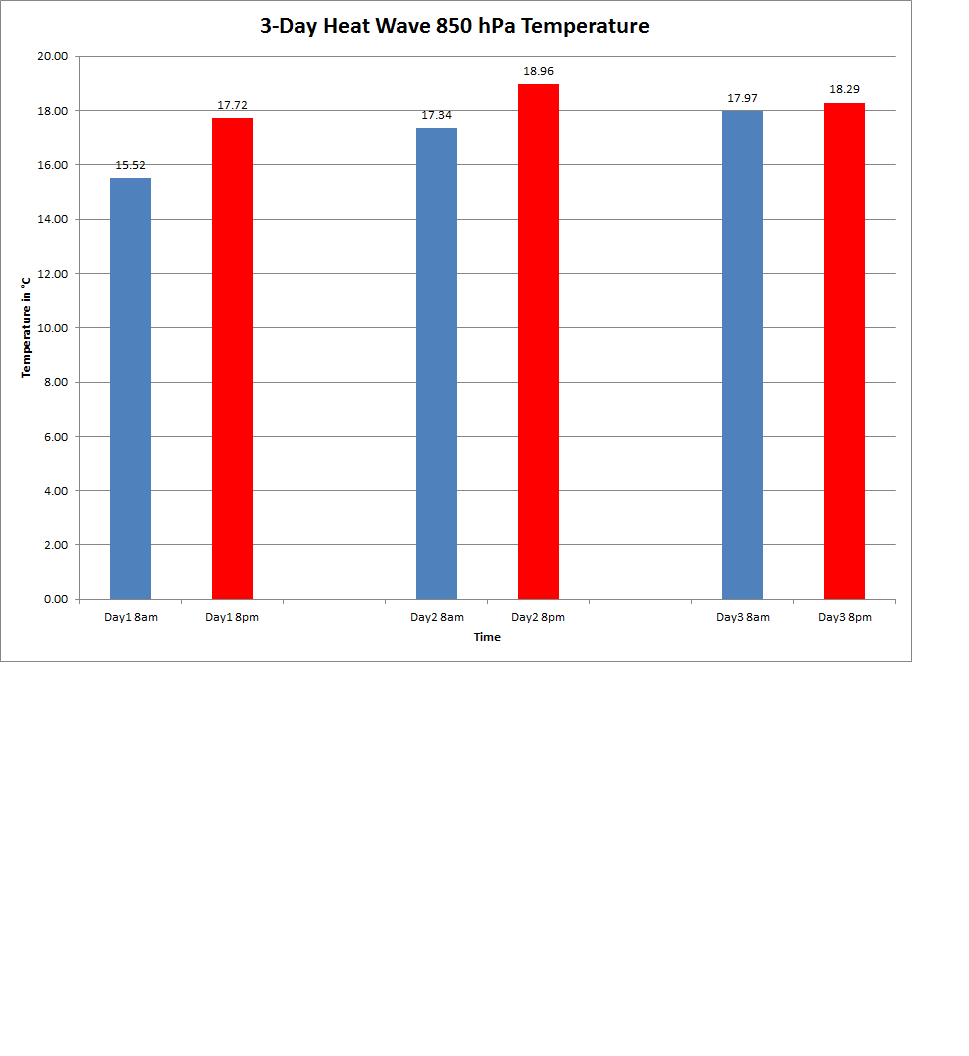
Therefore, instead of using composites from NCEP/NCAR or from NARR, actual observations from the soundings were used. Figure 15 shows the 850 hPa temperatures from the soundings from days 1-3 from 8am and 8pm (12Z and 00Z respectively). Average 850 hPa temperatures range from 15.5°C on day 1 at 8 am to almost 19°C by day 2 at 8 pm. 8 am 850 hPa temperatures steadily increase through the entire 3 day period, while the 8 pm temperatures follow the average high trend of steadily increasing through day 2, then decrease on the 3rd day. 8 pm temperatures are anywhere from about 0.3°C to 2.5°C warmer than the 8 am temperatures on the same day.
Figure 15. Averaged 850 hPa temperatures for both 8 am and 8 pm soundings from OKX for each day of a 3-day heatwave.
4-day heat wave 850 hPa temperatures (fig. 16) range from 17°C to just under 20°C. 850 hPa temperatures rise steadily through day 3 from the respective time of days (i.e. day 2 at 8 am is warmer than day 1 at 8 am and day 2 at 8 pm is warmer than day 1 at 8 pm.). 850 hPa temperatures on day 4 are cooler, with both 8 am and 8 pm 850 temperatures very close to each other (18.62°C for 8 am and 18.67°C for 8 pm).
Figure 16. Same as figure 14, but for 4-day heatwaves.

For 5 day heat wave events, 850 hPa temperatures range from near 15°C to 20°C (fig. 17). 5-day 850 hPa temperatures start off rather cool (14.7°C) on day 1 at 8 am. Thereafter, there is no steady increase or decrease for 8 am 850 hPa temperatures through the rest of the days of 5-day heatwaves. Instead, they alternate between increasing and decreasing through the period. 8 pm 850 hPa temperatures however show a steady increase from 17.3°C on day 1 to 20°C by day 3, which mirrors average surface temperatures in fig. 4. A possible explanation for the alternating nature of 8 am 850 hPa temperatures vs. the steadily increasing then decreasing nature of the 8 pm 850 hPa temperatures is that there were only 2 5-day heat wave events for these averages. 3 and 4-day heat wave events had 15 and 14 events respectively. 8 pm 850 hPa temperatures show a decrease after day 3.
Figure 17. Same as figure 15, but for 5-day heatwaves.

For dates that had hourly temperatures (3-hourly, for those that reported every hour, only every 3 hours were used for consistency), the maximum hourly temperature for each day of a heatwave event was found during the daytime hours (from 12Z to 21Z). As will be shown, the idea behind finding the hourly maximum temperature was to gain an understanding of what the highest HI during the day may have been during these heatwave events. HI is not a metric that is recorded for climate data, so it needs to be calculated from available data. The maximum hourly temperature is not necessarily the maximum daily temperature, but it does have corresponding dew points available and since dew points are also not a metric that is recorded with a corresponding daily maximum temperature in climate data, we used hourly temperatures with corresponding dew points to calculate a maximum HI for the day. Of course, this does not mean it is the highest HI value reported during the day, as a lower temperature and a higher dew point may produce a higher heat index, but it was the most efficient way to approximate the highest HI during these events, given the large data set.
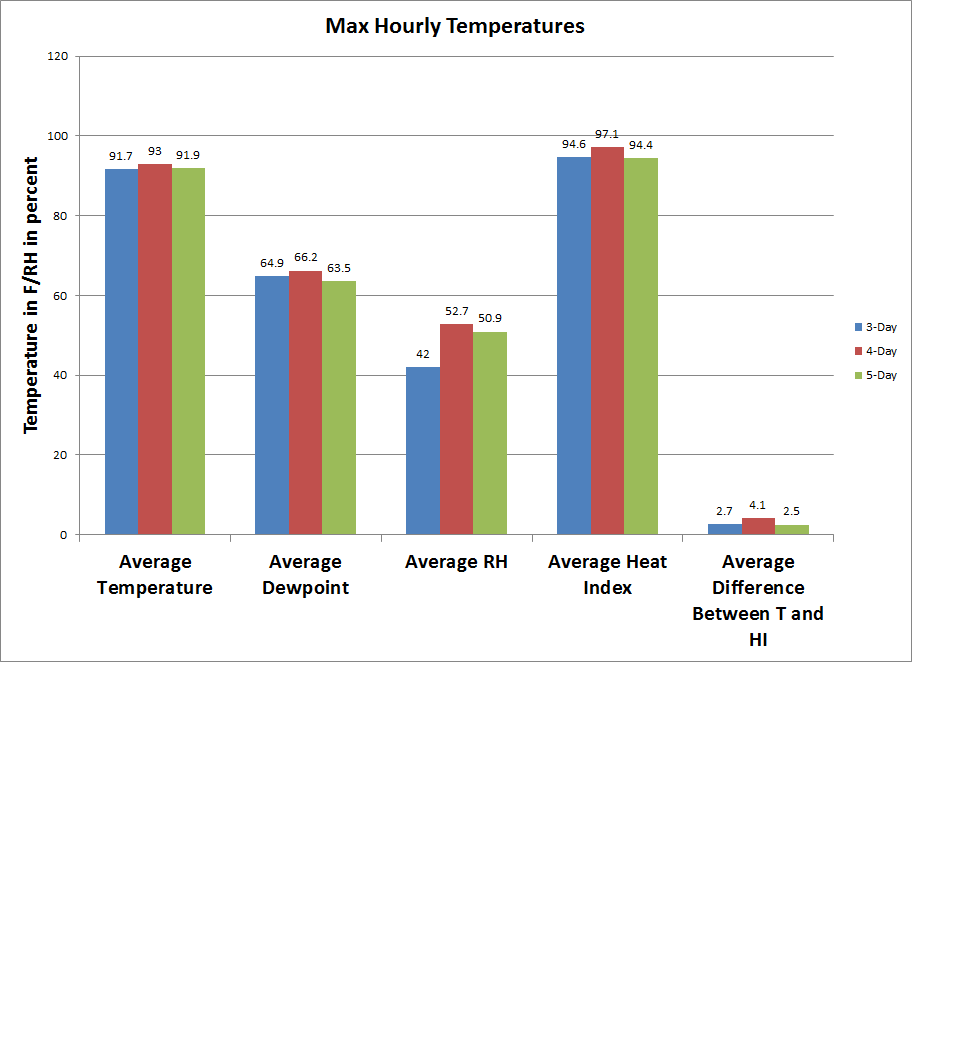
The maximum hourly temperatures were averaged for 3-, 4-, and 5-day heat waves. The results are shown in fig. 18. The maximum hourly temperature for a 3-day heat wave is 91.7ºF with 31 events (93 maximum temperatures). The maximum hourly temperature is slightly higher for a 4-day heat wave at 93ºF with 18 events (74 maximum temperatures), and slightly lower than that for a 5-day heat wave at 91.9ºF with 8 events (40 maximum temperatures).
The corresponding dew points that were recorded at these maximum hourly temperatures were also found and averaged. They are 64.9ºF, 66.2ºF, and 63.5ºF respectively for 3-, 4-, and 5-day heatwaves. Using the maximum temperature (T) and the dew points (Td) that were observed at the same time of maximum hourly temperature, the RH was calculated, by first calculating the saturation vapor pressure (Es) and the actual vapor pressure (E), where Es=6.11*10^(7.5*T/(237.7+T), E=6.11*10^(7.5*Td/(237.7+Td), and RH=(E/Es)*100. This translates to a RH of 42%, 52.7% and 50.9% respectively for 3-, 4-, and 5-day heatwaves. HI was also calculated (see data and methods section for formula used) using these variables, and the results are 94.6ºF, 97.1ºF, and 94.4ºF respectively for 3-, 4-, and 5-day heatwaves. According to these results, 4-day heat waves have the highest maximum hourly temperatures (again, this does not mean it has the highest daily maximum temperatures), highest dew points, and thus highest heat index. The average difference between the HI and the actual temperature in a 4-day heat wave is 4.1, while the difference is 2.7 and 2.5 for a 3-day and 5-day heat wave respectively.
Figure 18. Average maximum hourly temperatures and average dew points (from 3 hourly or hourly data), calculated average RH, calculated average heat index, and difference between average temperature and average heat index.
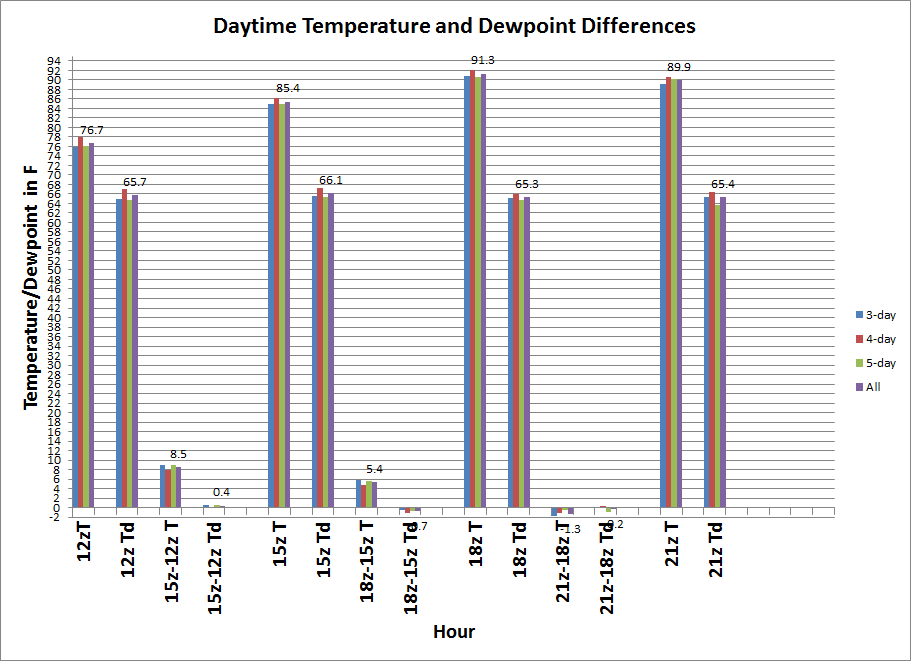
In order to get a sense of how the temperatures and dew points evolve during the daytime hours, all the events that had 3-hourly temperatures and dew points available were averaged during the daytime hours, i.e. all the 12Z temperatures were averaged (15Z, 18Z, and 21Z as well). During these heatwave events, temperatures start out in the middle to upper 70s at 12Z (75.9ºF for 3-day, 78.1ºF for 4-day heat waves, and 76.1ºF for 5-day heat waves) with dew points in the middle to upper 60s (65.0ºF, 67.1ºF, and 64.8ºF respectively for 3-, 4-, and 5-day heatwaves) (Fig. 19). By 15Z, temperatures warm into the lower to middle 80s (about an 8ºF or 9ºF difference, 84.9ºF, 86.2ºF, and 85.0ºF respectively for 3-, 4-, and 5-day heatwaves). Dew points only increase slightly at 15Z (anywhere from 0.2ºF-0.5ºF more), with 65.5ºF, 67.3ºF, and 65.4ºF respectively for 3-, 4-, and 5-day heatwaves. By 18Z, temperatures increase 4.8ºF-5.9ºF to the lower 90s (90.9ºF, 92.1ºF, and 90.7ºF respectively for 3-, 4-, and 5-day heatwaves), while dew points actually drop 0.4ºF-1.0ºF (65.1ºF, 66.0ºF, and 64.7ºF respectively for 3-, 4-, and 5-day heatwaves). By 21Z, temperatures drop anywhere from 1.7ºF-0.4ºF (89.1ºF, 90.7ºF, and 90.3ºF respectively for 3-, 4-, and 5-day heatwaves). Dew points at 21Z again only change slightly (from -0.65ºF to +0.2ºF change) with 21Z values at 65.3ºF, 66.3ºF, and 63.7 ºF respectively for 3-, 4-, and 5-day heatwaves. 4-day heat waves have the highest 3-hourly temperatures, while 3-day and 5-day 3-hourly temperatures are very similar. An average of all 3-, 4-, and 5-day events was calculated (All in Fig. 19). The average temperature during all events start off at 76.7ºF at 12Z, then rise to 85.4ºF by 15Z, then increase to 91.3ºF by18Z, and then cool slightly to 89.9ºF by 21Z. Temperatures rise 8.5ºF from 12Z to 15Z when averaged across all heatwave (All). They then increase another 5.4ºF from 15Z to 18Z, then drop 1.3ºF from 18Z to 21Z. Dew points start off at 65.7ºF at 12Z, then rise slightly to 66.1ºF by 15Z, then fall to 65.3ºF and 65.4ºF for 18Z and 21Z respectively. This data shows that, on average, slightly lower dew points are being mixed down to the surface, mainly between 15Z and 18Z, and then hold steady between 18Z and 21Z. This is helpful information if say perhaps NYC is forecast to be close to a 95ºF heat index for 2 days in a row. Lowering dew points by a degree during the warmest part of the day could bring dew points down below their 2-day threshold of 95ºF heat index for heat advisory for NYC.
Figure 19. 3-hourly averaged temperatures and dew points from 12Z-21Z for 3-, 4-, and 5-day heatwaves and All (combined 3-, 4-, and 5-day heatwaves), and differences of each from previous hours.
The following graph shows what time of day that the maximum hourly temperatures are reached during the heat wave events (Fig. 20). Maximum hourly temperatures did not occur prior to 15Z during all cases and hourly temperatures were only retrieved for the daytime hours of between 12Z and 21Z, so no temperatures would be reported after 21Z. Therefore, the first bin was chosen such that if they occurred at 16Z or prior (noon Local Daylight Time), making the first bin is 15Z-16Z (11 am - 12 pm Local Daylight Time). The next bin centered around 18Z, making it 17Z-19Z (1 pm -3 pm Local Daylight Time). Finally, the third bin was whatever was left over, that being 20Z-21Z (4 pm - 5 pm Local Daylight Time).
The time of day that these maximum temperatures are most often reached are between 17Z and 19Z, where 70.97% of all 3-day, 75% of all 4-day, and 60% of all 5-day cases fall in this time frame. The next most common time frame for maximum hourly temperatures to be reached is between 20Z and 21Z, where 26.88%, 20.83%, and 40% of 3-day, 4-day, and 5-day events respectively fall into this time frame. A small percentage of events have their maximum hourly temperatures fall between 15Z and 16Z; 2.15% of 3-day events, 4.17% of 4-day events, and 0% of 5 day events fall in this time frame.
Figure 20. Time interval that maximum hourly temperatures are reached during 3-, 4-, and 5-day heatwaves.

Since dew points can vary greatly over a small distance, it was felt that dividing dew points into bins might be helpful to help forecast these events. Dew points were separated into 7 different bins: <50ºF (first bin), 50ºF-54ºF (2nd bin), 55ºF-59ºF (3rd bin), 60ºF-64ºF (4th bin), 65ºF-69ºF (5th bin), 70ºF-74ºF (6th bin), and 75ºF-79ºF (7th bin). The observed dew points at the time of the maximum hourly temperature were recorded. All 3 heat wave events see a rise in percentage of events from the 1st bin to the 3rd bin (55ºF-59ºF) (Fig. 21). 3-day and 4-day events continue their rise into the 5th bin (65ºF-66ºF), and 4-day events continue rising into the 6th bin (70ºF-74ºF). The most common bin for 3 and 5-day events is 65ºF-69ºF, with about 38% and 33% of all events falling within this bin respectively, while for 4-day events, it's 70ºF-74ºF at about 33% of all events. The data suggests that 4-day heat waves are usually more humid than the other 2 types, which agrees well with Fig. 19. Interestingly, 5-day heat waves have a secondary peak in a drier type bin (54ºF-59ºF) (about 23%), which also fits well with Fig. 19.In general however, nearly 1/3 of each event falls in the 65ºF-69ºF dew point range.
Figure 21. Dew point bins at the time of maximum hourly temperature for 3-, 4-, and 5-day heatwaves.

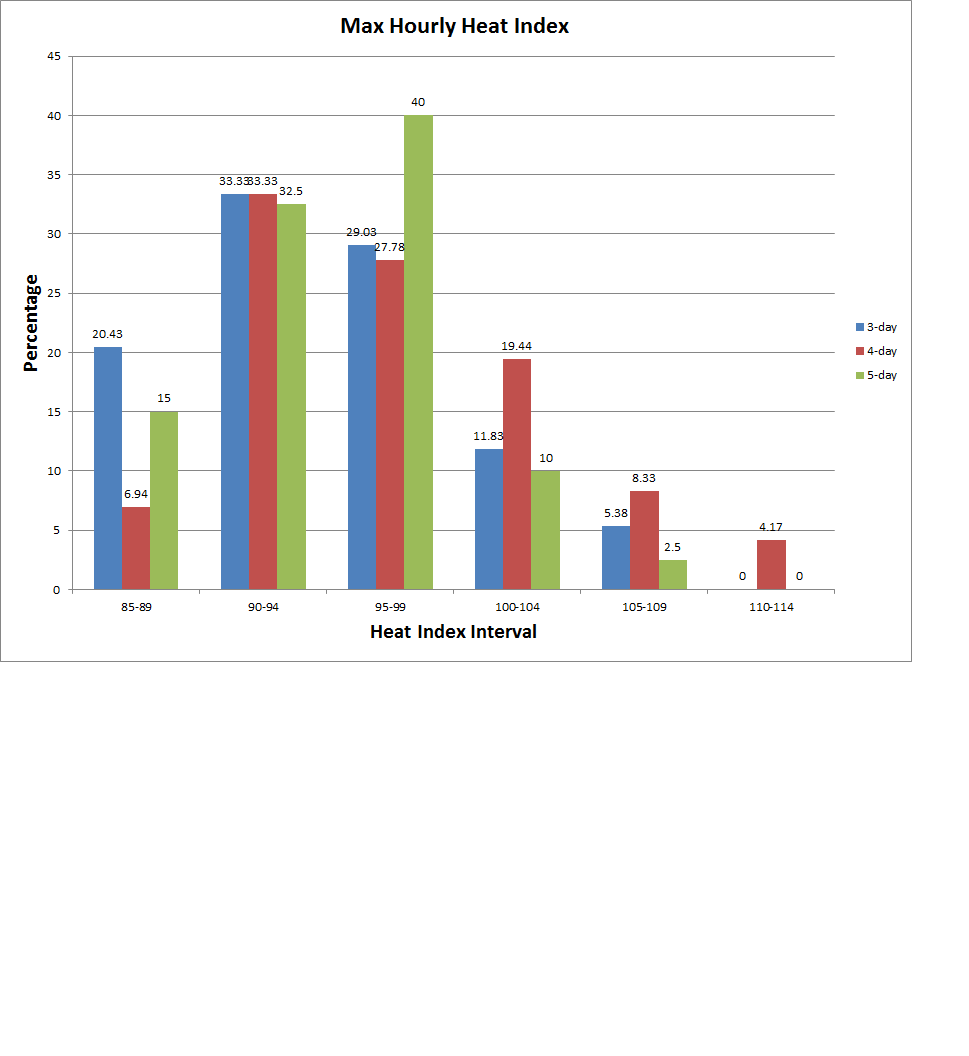
Similarly, the maximum hourly HI was divided into 6 bins: 85ºF-89ºF (1st bin), 90ºF-94º (2nd bin), 95ºF-99ºF (3rd bin), 100ºF-104ºF (4th bin), 105ºF-109ºF (5th bin), and 110ºF-114ºF (6th bin) in figure 22. The bins are divided into criteria for Heat Advisory (2 consecutive days of 95ºF or higher), general Heat Advisory (100ºF-104ºF), and Excessive Heat Warning (105ºF+). All 3 heat wave event types increase in percentage from the 1st to 2nd bin (which is the peak for 3- and 4-day events at 33% of all events for both event types). 5-day heat waves continue to increase through the 3rd bin (peak for 5-day events at 40%) which is the 2-day Heat Advisory criteria, while 3-day and 4-day heat waves decrease. Thereafter, all heat wave types decrease through the 6th bin. 4-day heat waves, while having its peak in the 2nd bin, has a higher percentage in the higher order bins (4th, 5th, and 6th bins) as compared to 3- and 5-day heatwaves. The 4th and 5th bins are general Heat Advisory criteria and Excessive Heat Warning criteria respectively. In fact, 4-day heatwaves are the only heat wave type to have any events in the last bin at about 4%. This indicates that out of these 3 event types, 5-day heat wave events are more likely to reach Heat Advisory for the 2-day criteria, while 4-day heat waves are more likely to reach general Heat Advisory and Excessive Heat Warning levels. One reasoning behind this is that there is a higher potential of reaching the 2 day criteria for Heat Advisory for 5-day events than 3- or 4- because there are more days.
Figure 22. Maximum hourly heat index bins for 3-, 4-, and 5-day heatwaves.
Now we will move to the synoptic composites and their evolution through each event type. A composite was produced by averaging a meteorological variable over a domain. This was done for each day of 3-, 4-, and 5-day events. Each image is defaulted to the 1st day of the respective events. To step through to the next day, just scroll over "Day 2" and so on and note the progression of each variable over the domain.
On the first day of a 3-day heat wave, a 1024-1026 mb Bermuda type high pressure is centered over the northern Atlantic Ocean, approximately 500 miles east-southeast of the Azores (Fig. 23). The high intensifies on the second day as the 1024 mb contour encompasses more area and drifts slightly west, then weakens on the third day as the 1024 mb contour disappears.
A close up view of the area (not shown) indicates that a surface trough develops over the Northeast by day 2 and remain over the area on day 3.
Figure 23. Composite Mean Sea Level Pressure (MSLP) for 3-day heat waves.

On the first day of a 4-day heat wave, a 1024-1026 mb Bermuda type high pressure is centered just to the southeast of the Azores (fig. 24). This high drifts over the Azores on day 2, and remains nearly stationary through days 3 and 4, while remaining nearly the same strength.
Similar to the 3-day heat wave MSLP temporal evolution, a surface trough develops along the edge of the Bermuda high in the NEUS (not shown). A very weak trough is evident on the first day, while more prevalent and stronger on days 2-4. The trough moves slightly southeast from day 3 to day 4.
Figure 24. Same as fig. 23, but for 4-day heat waves.
On the first day of the 5-day heat wave, a broad surface trough and its axis is well off the Northeast coast (fig. 25). This trough weakens and becomes more zonal through day 3. Thereafter, another surface trough develops over the Northeast. This trough is shorter in wavelength than the previous one that developed offshore (this feature is better viewed in a close up view which is not shown here). A 1024-1026 mb Bermuda high pressure is in place on the first day of a 5-day heat wave (the center of which is similar in area to the 3-day heat wave). This high pressure is centered farther east than the 3-day and 4-day heat waves, in the north central Atlantic Ocean. The strength of the high pressure weakens slightly after the first day, then remains consistent days 2-5.
Figure 25. Same as fig. 23, but for 5-day heat waves.
On the first and second day of a 3-day heat wave, NYC lies within an area of zero MSLP anomaly. On the first day, a large area of +1 to +2 mb positive anomaly exists over the Mid-Atlantic and Southeast US (fig. 26). The northern extent is just to the south of Long Island and stretches southward to northern Florida, while the western extent is just east of the Mississippi River in Western Kentucky and Tennessee and the eastern extent is hundreds of miles off the east coast in the Western Atlantic Ocean. There is a positive anomaly maximum (+2 to +3 mb above normal) over northern South Carolina, much of North Carolina, and stretching northeastward just off the Virginia coast. There is a large area of negative anomaly over the Mid-West, Plains and eastern Rockies states, with a maximum negative anomaly (-5 to -4 mb below normal) over northeast Colorado, northwest Kansas, central Nebraska and extreme central South Dakota. On day 2, the positive anomaly area sinks south and becomes less intense (closer to neutral) as the negative anomaly moves east, closer to NYC and also weakens. By day 3, the eastern and southern edges of the negative anomaly is over NYC (-1 to -2 mb), while the positive anomaly is mainly limited to just off the South Carolina coast.
Negative anomalies exist mainly west of the Mississippi River, except across inland California on the first day of a 4-day heat wave (fig. 27). The anomaly is oriented from northeast to southwest. The largest negative anomalies occurs in central southern Canada (-6 mb or anomaly), with a large area of -5 to -6 mb across the Northern Plains states. The first day of a 4-day heat wave starts off very similar in pattern to the first day of a 3-day heat wave, with the large area of positive anomaly (+1 to +3 mb) over nearly the same area as in the 3-day heat wave. It covers roughly the same areas as the 3-day heat wave as well, except the 4-day heat wave anomaly does not extend as far off the East Coast as the 3-day heat wave. The northern extent is just north of NYC, while the southern extent only extends to southern Georgia and extreme northeast Florida. The western extent is roughly the same as the first day of a 3-day heat wave: just east of the Mississippi River in western Tennessee and western Kentucky. The eastern extent does not extend as far out into the Western Atlantic Ocean either, but is hundreds of miles offshore.
The area of maximum positive anomaly (+2 to +3 mb) is larger in the first day of a 4-day heat wave as compared to the 3-day heat wave. The maximum positive anomaly is farther north and covers much of North Carolina, Virginia, and southern portions of West Virginia, and Maryland, and extends east, off the coasts of the previously mentioned coastal states.
As we progress through days 2-4 of the 4-day heat wave, the area of positive anomalies sinks south on day 2 and weakens (+2 to +3 mb anomalies are no longer present). However, the aerial coverage of positive anomaly remains nearly the same as the first day. By day 3, the positive anomaly becomes much smaller and is confined to the Southeast U.S. Finally, by day 4, there is no positive anomaly present.
The negative anomaly over the Northern Plains also weakens, becoming less negative, and moves slightly east, with maximum negative anomalies of -4 to -3 mb on day 2. It continues weakening into day 3, with maximum anomalies of -3 to -2 mb as it enters the Western and Central Great Lakes region and into Northeast U.S. In fact, at this point, NYC is under the -2 to -1 mb anomaly. The orientation begins to differ as well, being oriented more east-northeast to west-southwest. By day 4, the negative anomaly strengthens somewhat, with maximum anomalies of -4 to -3 mb seen across New England, while NYC is under a -3 to -2 mb anomaly. The orientation is back to a more northeast to southwest direction.
Figure 27. Same as fig. 26, but for 4-day heat waves.
On the first day of a 5-day heat wave, there is a large area of positive anomaly, generally encompassing the eastern half of the US. Positive anomalies stretch from the Great Lakes, south to into the Gulf of America, and from well off the East Coast in the Northwestern Atlantic stretching west into the eastern half of Texas and eastern Oklahoma (fig. 28). NYC lies within the positive anomaly (specifically +3 to +4 mb). The maximum positive anomaly (+4 mb) lies south of NYC over much of Virginia, North Carolina, and portions of West Virginia and Maryland. A second maximum positive anomaly exists over eastern Canada.
Negative anomalies exist over the eastern Rockies, into the Central and northern Plains states, and into south central Canada. The largest negative anomalies (-4 to -3 mb) lies over Wyoming, Colorado, Nebraska, South Dakota, and North Dakota.
As we progress from days 2-5, the positive anomaly shrinks and weakens and moves south. The maximum anomaly of +4 mb is gone by day 3, and by day 5, only a small area of maximum positive anomaly exists (+1 to +2 mb), mainly over portions of Georgia, South Carolina and North Carolina and off the Mid-Atlantic coast. The negative anomaly weakens and dissipates by day 3. Negative anomalies northeast of Hudson Bay in Canada pushe east and moves into the east coast of Canada and into Northern New England. By day 5, this anomaly strengthens to -3 to -2 mb.
In NYC, the positive anomaly weakens about 1 mb per day, becoming neutral by day 5, with negative anomalies located just northeast of the city.
Figure 28. Same as fig. 26, but for 5-day heat waves.
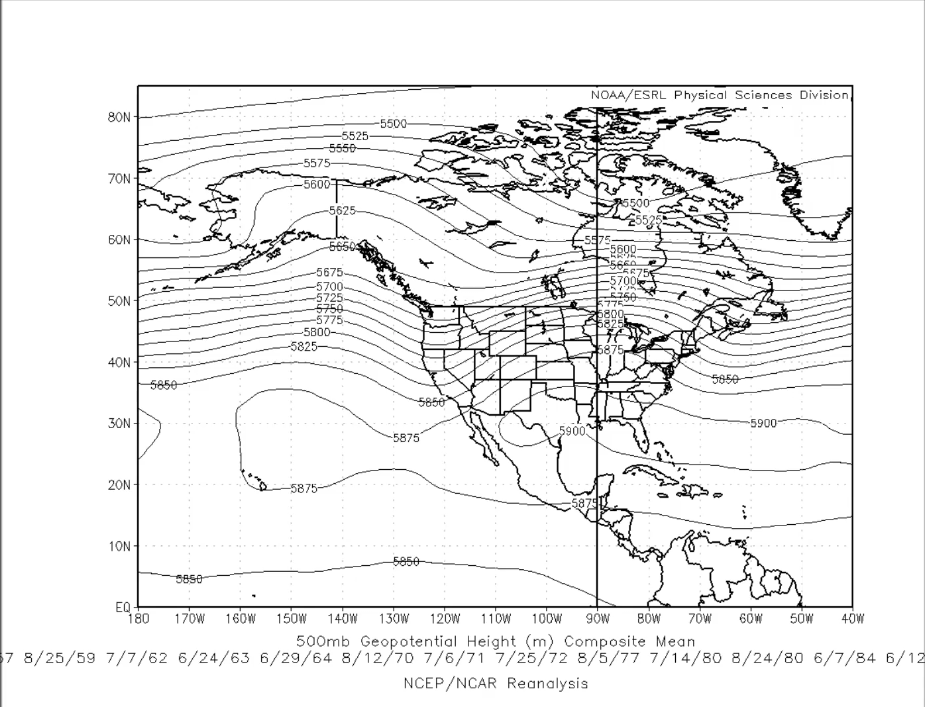
On the first day of a 3-day heat wave, there is a 500 mb level ridge, with a ridge axis over the Central Great Lakes area (fig. 29) and a trough, with its axis generally over the West Coast of the US. The NEUS lies on the eastern edge of this ridge, with the 5860 m geopotential height over NYC. A 500 mb trough lies over the West Coast of the U.S. A broad area of high pressure exists over the Mid-Atlantic states, the Southeast states, all the Gulf states, much of Mexico, much of the Gulf of America, northern half of the Caribbean Sea, and into the western central Atlantic Ocean. Moving into days 2 and 3, the ridge weakens and the NEUS is replaced by a general zonal flow aloft. The trough over the West Coast also weakens while the broad area of high pressure remains nearly stationary. The 5860 m geopotential height remains over NYC through the time period.
Figure 29. Composite 500 mb geopotential height for 3-day heat waves.
For 4-day heat waves, the Northeast U.S. is again on the eastern edge of the ridge, with NYC located in between the 5850 and 5875 mb geopotential line at 500 mb (fig. 30) on day 1. A trough also lies over the West Coast of the U.S. The ridge and trough are more amplified in the 4-day heat wave. There is a closed off area of high pressure over the Southeast U.S. that extends off the Southeast U.S. coast. Another difference from the 3-day heat wave is the existence of a trough off the Northeast and Mid-Atlantic coast. From days 2 through 4, the ridge axis moves slowly east and weakens, with the 500 mb flow becoming zonal over NYC by day 4, in similar fashion to the 3-day heat wave. The trough over the West coast remains nearly stationary and weakens through days 2 through 4, while the closed high over the Southeast U.S. retrogrades into Texas and Louisiana. The trough off the Northeast and Mid-Atlantic Coasts amplifies somewhat from days 1 to 2, then its strength remains rather constant through day 3 and then weakens slightly through day 4. This trough treks slowly east through the period. Much like the first day of a 3-day heat wave, the first day of a 4-day heat wave has a ridge axis over the Central Great Lakes area.
Figure 30. Same as fig. 29, but for 4-day heat waves.
Figure 31 shows the 500 mb heights for 5-day heat waves. There is a 500 mb trough off the Northeast U.S. coast, a ridge over the Western Great Lakes area, and a trough over the West Coast of the U.S. A broad area of high pressure exists over the Gulf states, northern portions of the Gulf of America and extending east into the Western Central Atlantic. NYC lies on the eastern edge of the ridge, lying between the 5850 m and 5825 m geopotential heights.
On the second day, the trough off the Northeast U.S. moves east and amplifies somewhat, while the ridge over the Western Great Lakes moves into the Central Great Lakes Area with no appreciable change in amplitude. The trough over the West Coast remains nearly stationary and deamplifies. The broad area of high pressure over the Southeast U.S. becomes closed off over the Southern U.S. On the third day, the trough off the Northeast coast tracks slightly east with no appreciable change in amplitude, the ridge weakens, while the trough over the West Coast retrogrades to the west. On the fourth day, the trough off the Northeast U.S. remains nearly stationary while weakening, the ridge over the Great Lakes continues to weaken, now becoming zonal flow over that region, while the trough over the West Coast continues to remain stationary. Further weakening (deamplification) of the trough over the Northeast Coast is seen on the last day, while zonal flow is evident over the Great Lakes and Northeast U.S., and the West Coast trough moves slightly closer back to the West Coast. The closed high over the South retrogrades to the west, situated over Texas, the U.S. Southwest, and northern Mexico.
Figure 31. Same as fig. 29, but for 5-day heat waves.
For the first day of a 3-day heat wave, the 500 mb anomaly shows a large area of positive anomaly over the eastern half of the U.S. and portions of southeastern Canada, while the western half and mainly southwestern Canada is under a negative anomaly (fig. 32). The positive anomaly ranges from +10 to +80 m, with the maximum over the Eastern Great Lakes region. The maximum negative values (-40 to -50 m) are over the Northern Rockies: much of Idaho, eastern Oregon, eastern Washington, western Montana, and southern portions of British Columbia and Alberta in Canada.
The positive anomaly moves east over the next 2 days and weakens (becomes less positive) as it does so, with the maximum (+50 to +60 m) centered over Central New York and southern New England. Much of the Eastern Seaboard (except southern Georgia and Florida) is under the positive anomaly and it stretches west to just east of the Mississippi River. It also encompasses the Central and Eastern Great Lakes and portions of southeastern Canada. For the first day of a 3-day heat wave, the 500 mb anomaly shows a large area of positive anomaly over the eastern half of the U.S. and portions of southeastern Canada, while the western half and mainly southwestern Canada is under a negative anomaly. The positive anomaly ranges from +10 to +80 m, with the maximum over the Eastern Great Lakes region. The maximum negative values are over the Northern Rockies: much of Idaho, eastern Oregon, eastern Washington, western Montana, and southern portions of British Columbia and Alberta in Canada.
The negative anomaly generally remains stationary and weakens (becomes less negative) as time progresses.
Figure 32. Composite 500 mb geopotential height anomaly for 3-day heat waves.
The 4-day 500 mb anomaly (fig. 33) starts off with positive and negative anomalies in the same general areas as the 3-day heat wave: over the eastern half of the U.S. and portions of southeastern Canada, while the western half and mainly southwestern Canada is under a negative anomaly. The main difference between the 3- and 4-day heat waves is that the 4-day heat wave has a stronger positive anomaly over the Central Great Lakes region (+80 to +90 m), and a stronger maximum negative anomaly over Northern Idaho, Western Montana, and southern Alberta Province in Canada (-80 to -70 m).
On day 2, both anomalies move east. However, the positive anomaly strengthens somewhat (becomes more positive), with the maximum centered over the eastern Great Lakes region (+90 to +100 m), while the negative anomaly becomes weaker (less negative), centered over Northwestern Montana and extreme southern Alberta Province in Canada (-60 to -50 m). Thereafter, the positive anomaly continues eastward and weakens (becomes less positive) with the maximum centered over the same general area as the 3-day heat wave: Central New York and southern New England (at a strength of +40 to +40 m). Much of the Eastern Seaboard (except southern Georgia and Florida) is under the positive anomaly and it stretches west to just east of the Mississippi River. It also encompasses the Central and Eastern Great Lakes and portions of southeastern Canada. The negative anomaly generally remains stationary and weakens (becomes less negative) as time progresses, with a maximum of -30 to -40 m over southwestern Canada by day 4.
Figure 33. Same as fig. 32, but for 4-day heat waves.
The first day in 5-day heat waves looks slightly different than the 3- and 4-day heat waves in regards to 500 mb anomaly (fig. 34). While it encompasses much of the Eastern Seaboard as the other heat waves do, it extends well into Canada. In fact, the maximum positive anomaly is centered in Quebec, just southeast of the tip of the Hudson Bay and north of Lake Huron (greater than +80 m). The maximum negative anomaly is also slightly different, encompassing much of Idaho, western portions of Washington and Oregon, western Montana, and southern Alberta Province in Canada, with maximum negative values of -60 to -80 m.
On day 2, the maximum positive anomaly sinks southeast, centered just of the Eastern Great Lakes region. The strength of the anomaly remains the same at greater than +80 m, however the areal coverage of the +80 m increases. In general, the area of positive anomaly moves southeast and weakens for days 3 and 4, with the lowest positive anomalies stretching into the Gulf states . The core of the positive anomaly is +40 to +60 m over the NEUS. The negative anomaly moves slightly east and weakens (becomes less negative), with a core of -20 to -40 m over the Pacific Northwest through day 2, then moves slightly east on day 3 and continues to weaken. By day 4, the eastern edge continues to weaken, while the western edge strengthens (lower anomalies develop over the Pacific Northwest with a negative maximum [-40 to -30 m] over Oregon and Northern California).
The positive anomaly then heads east and weakens (becomes less positive) through day 5, with the maximum positive anomaly over southern New England (+30 to +40 m). The aerial coverage also decreases significantly, now confined to the NEUS, Mid-Atlantic, portions of the mid-West and Eastern Great Lakes as well as extreme southeastern Quebec in Canada. There is little change in strength or position of the negative anomaly by day 5.
Figure 34. Same as fig.32, but for 5-day heat waves.
On the first day of a 3-day heat wave, the 850 mb temperature over NYC is between 16ºC and 17ºC (fig. 35). Temperatures increase to between 17ºC and 18ºC on day 2 and day 3, however, the 18ºC isotherm is just to NYC’s south (from central New Jersey southward) on the third day (located in southern Pennsylvania, western Maryland, and northwestern Virginia on day 2), indicating possible further warming aloft into day 3.
Figure 35. Composite 850 mb temperature for 3-day heat waves.
The 4-day heat wave starts in similar fashion to a 3-day heat wave with NYC’s 850 mb temperature between 16ºC and 17ºC (fig. 36). It then warms to between 19ºC and 20ºC on day 2, as well as day 3 (the 20ºC isotherm is just south of NYC, over central New Jersey, indicating possible further warming) and day 4 (the 20ºC isotherm moves southwest into central Virginia indicating possible cooling over NYC.
Figure 36. Same as fig. 35, but for 4-day heat waves.
On the first day of a 5-day heat wave, 850 mb temperatures over NYC are between 14ºC and 15ºC, warming to between 16ºC and 17ºC on the second day, and between 17ºC and 18ºC on the third through fifth days (fig. 37). From the fourth and fifth days, the 18ºC isotherm moves south from central New York, extreme southern Vermont and New Hampshire on day 4 to just north of NYC on day 5 (southern Lower Hudson Valley in New York and extreme southern Connecticut), indicating some possible cooling.
Figure 37. Same as for fig 35, but for 5-day heat waves.
The figures for 850 mb temperature anomaly (Figs. 38-40) were generated using degrees K. However, the following text will use the Celsius scale. Since these images are anomalies, they measure the number of degrees above or below what is considered the mean, therefore, it is a temperature difference, and a difference of 1 K is equal to a difference of 1 C.
Figure 38 shows the 850 mb temperature anomaly for 3-day heat waves. Positive 850 mb temperature anomalies exist over the Northeast and Mid-Atlantic states as well as southern Quebec, Ontario, and Saskatchewan Provinces in Canada and stretching westward into the central and northern Plains states. The maximum positive anomaly is centered over the Great Lakes (+4ºC to +5ºC). NYC is between +2ºC to +3ºC at 850 mb. Negative anomalies exists over the Rockies and the Wes Coast, with the maximum (-3ºC to -2ºC) over the Pacific Northwest and western Idaho as well as a small area over southern California.
On day 2, the positive and negative anomalies move east. The maximum positive anomaly approaches NYC, with the +4ºC isotherm over NYC. The negative anomaly weakens (becomes less negative) as the northern portions of the negative anomaly move into the Northern Plains.
By day 3, the positive anomaly has moved slightly east and weakened. NYC is clearly within the +4ºC to +5ºC anomaly, with the maximum anomaly centered over central and southern NEUS. The aerial coverage of the positive anomaly has decreased and is now limited to the NEUS, Mid-Atlantic, mid-west, central and eastern Great Lakes region, southern Quebec Province in Canada, and the northwestern Atlantic. This indicates possible weakening in the positive anomaly. The negative anomaly also shows weakening by day 3, with only 2 minor areas of -1ºC to -2ºC, one over the northeastern Rockies and northwestern Plains states, and another area over extreme southern California and extreme northern Baja of California.
Figure 38. Composite 850 mb temperature anomaly for 3-day heat waves.
The first day of a 4-day heat wave starts with the positive 850 mb temperature anomaly in the same general area as the 3-day heat wave, except it extends farther north into central Ontario and Quebec Provinces in Canada (fig. 39). The maximum temperature anomaly (+4ºC to +5ºC) is located over the Great Lakes region, slightly northwest of the first day in the 3-day heat wave. NYC is in the +2ºC and +3ºC anomaly. Negative temperature anomalies are located over the Rockies and West Coast, with the maximum negative anomaly (-5ºC to -4ºC) over eastern Washington, eastern Oregon, northern Idaho and extreme western Montana.
By day 2, both anomalies move slightly east, with the maximum positive anomaly increasing to +5ºC to +6ºC and centered over the central and eastern Great Lakes region. The +4ºC anomaly moves over NYC. The maximum negative anomaly weakens (becomes less negative) and is centered over Idaho and western Montana (-4ºC to -3ºC).
Thereafter, the positive anomalies weaken as they continue moving east through day 4, with the maximum positive anomaly (+4ºC to +5ºC) located over NYC, northern NJ, Lower Hudson Valley, Long Island, Connecticut, Rhode Island, and extreme southern Vermont and New Hampshire. The aerial coverage of positive anomalies decreases, being limited to the NEUS, Mid-Atlantic, mid-West, central and eastern Great Lakes Region and southern Quebec and Ontario in Canada and into the northwest Atlantic by day 4. Negative anomalies move slightly east through day 3 as they weaken, then remain nearly stationary through day 4, with only Idaho and northwestern Oregon, western Washington, and southern British Columbia in Canada seeing negative anomalies of -1ºC to -2ºC by day 4. Also, negative anomalies of -1ºC to -2ºC develop over the Hudson Bay and the area just to its south.
Figure 39. Same as fig. 38, but for 4-day heat waves.
Figure 40 shows that the first day of a 5-day heat wave starts out with an area of positive anomaly sandwiched in between 2 areas of negative anomalies: One area of negative anomaly out over the western Atlantic and the mid-Atlantic and Southeastern states, the other over the Rockies, West Coast, and western Canada. The area of positive anomaly lies between these 2 areas, stretching from central Quebec and Ontario southwest into western Texas and from the Northern and Central Plains states east to the Northeast and Mid-Atlantic coasts. The maximum positive anomaly (greater than +4ºC) lies just north of the Central Great Lakes region. NYC lies in an area of 0ºC to +1ºC. The maximum negative anomalies are over northern Idaho, western Montana, eastern Washington and eastern Oregon as well as southern California and southwestern Nevada (-3ºC to -4ºC).
By day 2, the anomalies move east, but the core of maximum positive anomaly of greater than +4 C moves south and is located over portions of the Western and Central Great Lakes region and southern Ontario. NYC lies on the +2 C line. The maximum negative anomaly lies over west central Montana at greater than -4 C.
By day 3, the maximum positive anomaly of greater than +4ºC is now located over extreme northern New York, northern Vermont and extreme southern Quebec. NYC in the +3ºC to +4ºC anomaly area. The aerial coverage of positive anomalies is noticeably less, although the aerial coverage of the maximum anomaly is still about the same as day 1. The maximum negative anomaly (-3ºC to -4ºC) moves east into central and eastern Montana, western North Dakota, northern Wyoming and southern Alberta. The aerial coverage of negative anomalies also becomes somewhat less.
Thereafter, the positive anomaly's aerial coverage continues to decrease as it moves east through day 5 while the maximum positive anomaly decreases to +2ºC to +3ºC and is located over much of the NEUS and extreme southeastern Quebec. NYC lies within this maximum positive anomaly. The negative anomaly continues to weaken (becomes less negative) as it move east. By day 5, the only areas that have negative anomalies are over Quebec, southwest into Ontario, the Upper Peninsula of Michigan, extreme northern Wisconsin, northwest into northern Minnesota, and into southern Manitoba and central Saskatchewan. Negative anomalies also exist over much of the West Coast and just off the West Coast of the U.S. The maximum negative anomalies exist over northern Quebec at -2ºC to -3ºC.
Figure 40. Same as fig. 38, but for 5-day heat waves.
The next 3 figures (figs. 41-43) show composites of wind speed and direction. Wind speed is shaded, while arrows show the wind direction. An arrow pointing south indicates a north wind (the wind blows from north to south). In order to get a sense of the wind direction for NYC, the closest arrows were used, one of southwestern Pennsylvania and another a few hundred miles off the east coast of New Jersey, near the 40N 70W benchmark).
Composites of each day of a 3-day heat wave show no appreciable change in surface wind speed or direction during a 3-day heat wave over NYC (fig. 41). Southwesterly winds are seen from days 1 to 3 while wind speeds range from 3.75 to 4.0 m/s (8.4 to 8.9 mph) on day 1 to 3.5 to 3.75 m/s (7.8 to 8.4 mph) on days 2 and 3.
The strongest winds remain off the NEUS Coast throughout the event. On the first day, the strongest winds are hundreds of miles east off the Massachusetts coast (near 42.5N, 68W), with winds of 5.5 m/s or greater (12.3 mph or greater). The area of maximum winds moves southwest through day 2, located just south and east of Long Island. By day 3, they are located slightly farther south than day 2 and are slightly weaker at between 5.25 to 5.5 m/s (11.7 to 12.3 mph).
Figure 41. Composite surface wind speed (shaded) and direction (arrows) for 3-day heat waves.

4-day heat wave surface wind composites also show no appreciable change in wind speed or direction (fig. 42). Wind direction is southwesterly over NYC through the period. Wind speeds are slightly weaker than in 3-day heat waves, ranging from 3 to 4 m/s (6.7 to 8.9 mph).
As with 3-day heat waves, the strongest winds are off shore. The maximum winds are a few hundred miles east off the Massachusetts coast (near 42N to 43N and 66W to 68W), then move southwest through the period, located a few hundred miles off the Virginia coast by day 4 (near 37.5N, 73.5W). These offshore winds increase through the period, from 5 to 5.5 m/s (11.1 to 12.3 mph) on day 1 to 7 m/s or greater by day 3 (15.7 mph).
Figure 42. Same as fig. 41, but for 4-day heat waves.
On the first day of a 5-day heat wave (fig. 43), winds are from the west to southwest across the area at speeds of 2.25 to 2.5 m/s (5 to 5.6 mph). By days 2-5, a general southwest flow is more evident across the area. Winds increase from days 1 through 4, increasing to 3 to 3.25 m/s (6.7-7.3 mph) on day 2, to 3.5 to 3.75 (7.8-8.4 mph) by day 3, and to 3.75 to 4.0 (8.4-8.9 mph ) by day 4. Winds decrease to 3.5 to 3.75 (7.8-8.4 mph) by day 5.
As with the other 2 heat waves, the 5-day heat wave shows the maximum surface winds off shore. Maximum winds of 3.0 to 3.25 m/s (6.7-7.3 mph) are located over Nova Scotia to just south of Nova Scotia on day 1, to winds of 5 to 5.25 m/s (11.2-11.7 mph) near the 40N, 70W benchmark by day 3, to a broad area of high winds of 6.25 to 6.5 m/s (14-14.5 mph) well south and east of Long Island by day 5 (there are 2 areas of maximum winds of greater than 6.5 m/s (greater than 14.5 mph) : 1 near the 40N, 70W benchmark, and the other near 37.5N, 72W).
Figure 43. Same as fig. 41, but for 5-day heat waves.
Recognizing the above patterns in the composites is key to forecasting heat wave events in Central Park. Anomaly composites presented here can be used with Pennsylvania State University-National Weather Service's Weather and Research Site page and analyzing the anomaly maps for the same elements presented here. If models show the same or similar patterns presented in this research, a heat wave is likely to occur. The web site is: http://cms.met.psu.edu/sref/
The synoptic classification can be seen in figure 47. As is expected, the BH type is the most common type of high pressure system to affect the region during 3-, 4-, and 5-day heat waves (33%, 58%, and 37% respectively). This type of heat wave is associated with a Bermuda high, which is a semi-permanent high pressure system with its center near Bermuda. This position allows for a southwesterly flow to develop over the region, introducing a warm, humid air mass into NYC.
The next most common synoptic type to affect the region during 4- and 5-day heat waves is the PH type (19% and 26% respectively). This is a high pressure with its center to the west or northwest of the area. It is somewhat counterintuitive that this would cause heat waves because the flow is northwesterly and offshore, so the air mass is usually a drier one than the BH type. However, downsloping off the higher terrain probably aids in heating the area, so although the maximum temperatures during these events reach into the 90s, the apparent temperatures would be less, since the air mass is drier.
For 3 day heat waves, the next most common type to affect the region is the EH at 23%. The EH type is a high pressure system that has it's center over the NEUS. Subsidence underneath the high pressure, which causes the air to heat up, is the most probable cause of the heat waves.
The next most common high pressure type to affect NYC for 4- and 5-day heat waves is the HS type (9% and 12% respectively). This high pressure type has high pressure to the south and low pressure to the north. This allows for a westerly flow over the area. This also is a downsloping flow for NYC, leading to warm and dry conditions.
For 3-day heat waves, the next most common type is PH (13%).
EH is the next most common type for 4- and 5-day heat waves (7% and 11% respectively), while it is HS for 3-day heat waves (11%).
All other synoptic types are not significant (low, trough, cold front, warm front, HN, and N/A (no clear synoptic type was identifiable) contributing a combined 20%, 5%, and 14% for 3-, 4-, and 5-day heat waves respectively.
Figure 44. Distribution of Yarnal types to affect NEUS during 3-, 4-, and 5-day heat wave events. BH=back of high, PH=pre-high, HS=high to the south, EH=extended high, LOW=low pressure system, TROUGH=surface trough (A region of relatively low atmospheric pressure at the surface that is not associated with a cold front or warm front), CF=cold front, WF= warm front, HN=high to the north, N/A=not available.

Synoptic composites for each Yarnal type were created for various elements for 3, 4, and 5-day heat waves. Since the results were similar for each type of heat wave within a synoptic type, only 3-day heat wave results will be shown, with differences noted.
In figure 45, the composite for the 3-day BH type is shown. There is a 1022-1024 mb high pressure centered just west of the Azores which stretches west into the East Coast of United States. The 1016 mb line is closest to NYC. Within the periphery of this high, there is a trough, whose axis extends from southern New England into the mid-Atlantic. The major difference with the other heat waves is that 4-day heat waves have a slightly stronger high (1024-1026 mb) and 5-day heat waves have a weaker trough.
Figure 45. Composite MSLP for 3-day heat waves for BH type.

The PH synoptic type is shown in fig. 46. It shows a 1022 mb to 1024 mb high pressure over the Azores which stretches west into the northeast Caribbean. There is a sharp surface trough over the NEUS, it is much more evident as compared to the BH type. This could be a composite of the passage of a cold front, which typically precedes the PH type. A closer view of this synoptic type in figure 47 shows that this trough is just off the Northeast Coast, while another closed high (1017 to 1018 mb) is centered over southwest Virginia, western Kentucky, and northeast Tennessee.
Figure 46. Same as fig. 45, but for PH.

Figure 47. Same as fig. 46, but for CONUS view.

The EH MSLP is shown below in fig. 48, which shows a 1023 mb to 1025 mb high centered to the southwest or west-southwest of the Azores. A surface trough is evident over the NEUS. However, this is not nearly as sharply defined as the PH type. Similar to PH, there is another closed high over western Virginia and western North Carolina (1018.5 mb to 1020 mb) .
Figure 48. Same as fig. 45, but for EH.

HS MSLP is shown below (fig. 49). It shows a 1022 mb to 1024 mb high centered just to the south-southwest of the Azores. As with the other synoptic highs, a trough is over the NEUS. Although there is no closed high south of the NEUS (which may be due to averaging out the data), there is a low pressure situated over Newfoundland in Canada which is typical of the HS type. This low is between 1004 mb and 1006 mb in strength.
Figure 49. Same as fig. 45, but for HS.

For the BH 500 mb heights (fig. 50), there is a 5900 m closed high to the south of the area. This closed high is off the North Carolina/South Carolina coasts for 3-day heat waves. It is broader for 4- and 5-day heat waves, extending westward into the Southeast U.S. for 4-day heat waves, and into all of the Southern U.S. for 5-day heat waves. There is weak ridging in the vicinity of the NEUS. On 3-day heat waves, it is over Eastern New York State. This ridge is progressively farther east for 4- and then 5-day heat waves, where it is just offshore. The 5875 m line is closest to NYC for all 3 heat wave types. This is the highest height to affect NEUS out of the main synoptic types to affect the region during heat waves.
Figure 50. Composite 500 mb geopotential height for 3-day heat waves for BH type.

For 500 mb PH heights (fig. 51), there is a large 5900 m closed high over the southern Plains states and into northern Mexico. Over the NEUS, a weak trough is just off the NEUS coast. The 5850 mb line is closest to NYC.
Figure 51. Same as fig. 50, but for PH.

The EH 500 mb heights are shown in fig. 52. This shows the NEUS in between an exiting trough well off the NEUS coast and entering ridge over the eastern Great Lakes region. A 5900 m closed high is centered over western Virginia/North Carolina and eastern Kentucky/Tennessee. The 5875 m height is closest to NYC
Figure 52. Same as fig. 50, but for EH.

The HS 500 mb height is shown below (fig. 53). This shows a zonal flow over the NEUS, with a semi-closed high over the Southeast US. The 5825 m height is closest to NYC. HS shows the lowest heights to affect NYC.
Figure 53. Same as fig. 50, but for HS.
Composite 850 mb temperatures for BH, PH, EH, and HS are shown in fig. 54 - 57 respectively. For BH, 850 mb temperature for NYC is 17°C to 18°C. For PH, it is 16°C to 17°C. For EH, 850 mb temperature is 17°C to 18°C, and for HS it is 16.5°C-17.5°C.
Figure 54. Composite 850 mb temperature for 3-day heat waves for BH type.

Figure 55. Same as fig. 54 but for PH.

Figure 56. Same as fig. 54, but for EH.

Figure 57. Same as fig. 54, but for HS.

The surface winds composite are shown in figures 58- 61 (BH, PH, EH, and HS respectively). The closest vector to NYC is over west central New Jersey. BH shows a composite southwest wind of 4.0 to 5.0 m/s (8.9 to 11.2 mph) over NYC, with the highest winds just east of Long Island at 6 to 6.5 m/s (13.4 to 14.5 mph), while PH shows that NYC is in between an area of west wind, with an average wind speed of 3.5 m/s to 4.0 m/s (7.8 to 8.9 mph). For EH, a composite southwest flow occurs with an average wind speed of 3.0 m/s to 3.5 m/s (6.7 to 7.8mph). Finally, HS shows a southwest wind at an average speed of 4.5 to 5.5 m/s (10.0 to 12.3 mph), with the highest winds similar to BH just east of Long Island at 7.0 to 7.5 m/s (15.6 to 16.8 mph). Of all 4 synoptic types, HS and BH show the highest wind speeds, while EH and PH show the lowest. It stands to reason that EH would show the lowest, since high pressure should be centered over the region with this synoptic type. With a lack of pressure gradient, winds will be lower.
Figure 58. Composite surface wind speed (shaded) and direction (arrows) for 3-day heat waves for BH type.

Figure 59. Same as fig. 58, but for PH.

Figure 60. Same as fig. 58, but for EH.

Figure 61. Same as fig. 58, but for HS.

Separate statistics for high temperatures, low temperatures and dew points for the synoptic classes were computed in the form of box and whiskers diagrams. These diagrams show statistics for the Yarnal synoptic types for each heat wave.
For 3-day heat waves, tables 7 and 8 show the statistics for the main Yarnal types that cause 3-day heat waves for highs and lows respectively, while fig. 62-65 show box and whisker diagrams for each synoptic type. Notice that the minimum high temperatures of 90ºF are all the same. This is because a heat wave is defined by this minimum temperature. The EH type shows the greatest high temperature of all synoptic types that cause a 3-day heat wave at 103ºF, with PH the lowest at 99ºF. EH also has the highest variability with a standard deviation of 2.9, while the lowest occurs with PH at 2.4. BH has a standard deviation of 2.6 and HS has a standard deviation of 2.7. The median is 92ºF for all types except HS, where it is 93ºF. The 25th percentile is 91ºF for all types, again, except for HS, where it is 92ºF. The 75th percentile is 94ºF for BH and PH; it is 95ºF for EH and HS.
For low temperatures, the maximum lows are either 82ºF for BH and PH or 84ºF for EH and HS. The lowest minimum low temperature occurs with PH at 58ºF and the highest with BH at 62ºF. EH has a minimum low of 60ºF, while it is 61ºF for HS. EH has the lowest median temperature of 72ºF, while it is 73ºF for PH, 74ºF for BH and 75ºF for HS. The 25th percentiles start at a low of 70ºF with EH, BH and PH are 71ºF and HS is 72ºF. The 75th percentile are 74ºF, 75ºF, 76ºF, 77ºF for EH, PH, BH, and HS respectively. Finally, standard deviations range from a low (least variability) in EH at 3.7, to a high (most variability) in PH at 4.8. HS and BH have similar standard deviations at 4.0 and 4.1 respectively.
Table 7. Maximum, minimum, median, 25th percentile, 75ht percentile, and standard deviation for BH, EH, PH, and HS, for 3-day heat waves.
|
Yarnal type |
Maximum high temp |
Minimum high temp |
Median |
25th percentile |
75th percentile |
Standard deviation |
|
BH |
102 |
90 |
92 |
91 |
94 |
2.6 |
|
EH |
103 |
90 |
92 |
91 |
95 |
2.9 |
|
PH |
99 |
90 |
92 |
91 |
94 |
2.4 |
|
HS |
102 |
90 |
93 |
92 |
95 |
2.7 |
Table 8. Same as table 7, but for low temperatures.
|
Yarnal type |
Maximum low temp |
Minimum low temp |
Median |
25th percentile |
75th percentile |
Standard deviation |
|
BH |
82 |
62 |
74 |
71 |
76 |
4.1 |
|
EH |
84 |
60 |
72 |
70 |
74 |
3.7 |
|
PH |
82 |
58 |
73 |
71 |
75 |
4.8 |
|
HS |
84 |
61 |
75 |
72 |
77 |
4.0 |
Figure 62. Box and whisker diagrams for high and low temperatures for 3-day heat waves for BH type.
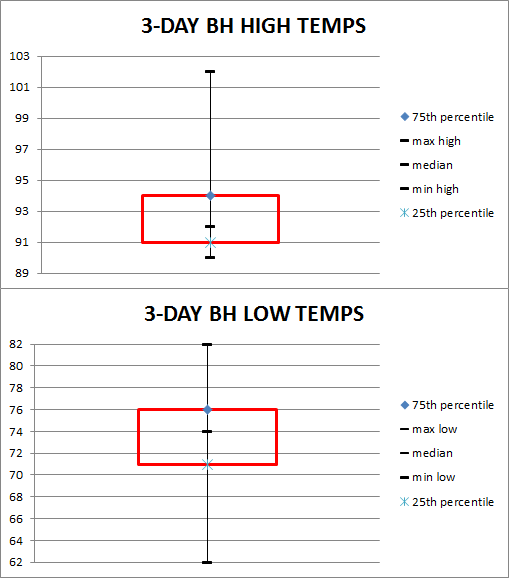
Figure 63. Same as fig. 62, but for EH.
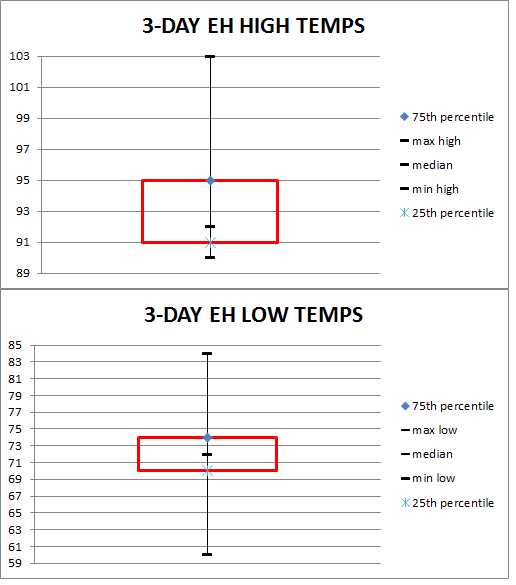
Figure 64. Same as fig. 62, but for PH.

Figure 65. Same as fig. 62, but for HS.
For 4-day heat waves, the greatest maximum temperature occurs with BH at 104ºF (table 9), the lowest maximum high temperature is with EH at 97ºF. HS has a maximum high temperature of 99ºF, while PH has a maximum of 100ºF. Median temperatures are the same for BH, EH, and PH at 93ºF, while it is slightly higher for HS at 94ºF. The 25th percentile is 90ºF, 91ºF, 92ºF, and 93ºF for EH, BH, PH, and HS respectively. The 75th percentile for EH is 94ºF, while it is 95ºF for both PH and HS, and 96ºF for BH. The standard deviation is 2.3 for EH and HS, 2.6 for PH and it is the highest for BH at 3.2.
For low temperatures for 4-day heat waves, the greatest maximum low temperature is from BH with 84ºF (table 10), while the lowest maximum low temperature is 81ºF from HS. The greatest minimum low temperature occurs with EH at 68ºF, while lowest minimum low temperature occurs with BH at 61ºF. The highest median occurs with HS at 76ºF, then it is 74ºF, 73ºF, 72, with BH, PH, and EH respectively. The 25th percentile is 71ºF for EH, PH, and HS, while it is slightly higher for BH at 72ºF. HS has the highest 75th percentile at 77ºF, then it is 76ºF for BH and 75ºF for both EH and PH. EH has the lowest standard deviation with 3.0, then PH with 3.6. HS and BH have similar standard deviations of 3.9 and 4.0 respectively.
Figures 66-69 show the box and whisker diagrams for BH, EH, PH, and HS respectively.
Table 9. Same as table 7, but for 4-day heat waves.
|
Yarnal type |
Maximum high temp |
Minimum high temp |
Median |
25th percentile |
75th percentile |
Standard deviation |
|
BH |
104 |
90 |
93 |
91 |
96 |
3.2 |
|
EH |
97 |
90 |
93 |
90 |
94 |
2.3 |
|
PH |
100 |
90 |
93 |
92 |
95 |
2.6 |
|
HS |
99 |
90 |
94 |
93 |
95 |
2.3 |
Table 10. Same as table 8, but for 4-day heat waves.
|
Yarnal type |
Maximum low temp |
Minimum low temp |
Median |
25th percentile |
75th percentile |
Standard deviation |
|
BH |
84 |
61 |
74 |
72 |
76 |
4.0 |
|
EH |
78 |
68 |
72 |
71 |
75 |
3.0 |
|
PH |
82 |
63 |
73 |
71 |
75 |
3.6 |
|
HS |
81 |
66 |
76 |
71 |
77 |
3.9 |
Figure 66. Same as fig. 62, but for 4-day heat waves.

Figure 67. Same as fig. 63, but for 4-day heat waves.

Figure 68. Same as fig. 65, but for 4-day heat waves.

Figure 69. Same as fig. 66, but for 4-day heat waves.

For 5 day heat wave, EH and HS will be missing, since there was not enough data to produce meaningful results from these synoptic types. The greatest maximum high temperature occurs with PH at 103ºF (table 11), while it is 101ºF for BH. The median for both BH and PH are 94ºF. The 25th percentiles are at 91ºF and 93ºF for PH and BH respectively. The 75th percentile is 96ºF and 96.5ºF for PH and BH respectively. Finally, the standard deviation is 2.9 and 3.2 for BH and PH respectively.
The greatest maximum low temperature occurs with both BH and PH at 80ºF (table 12). PH as the lowest minimum temperature at 60ºF, while it is 66ºF for BH. The median for both PH and BH is 74ºF. The 25th percentile is 68.5ºF and 71ºF for PH and BH respectively. The 75th percentile is 76ºF and 77ºF for PH and BH respectively. The standard deviation is 3.5 and 4.8 for BH and PH respectively.
Figures 70-71 show the box and whisker diagrams for BH and PH respectively.
|
Yarnal type |
Maximum high temp |
Minimum high temp |
Median |
25th percentile |
75th percentile |
Standard deviation |
|
BH |
101 |
90 |
94 |
93 |
96.5 |
2.9 |
|
EH |
|
|
|
|
|
|
|
PH |
103 |
90 |
94 |
91 |
96 |
3.2 |
|
HS |
|
|
|
|
|
|
Yarnal type |
Maximum low temp |
Minimum low temp |
Median |
25th percentile |
75th percentile |
Standard deviation |
|
BH |
80 |
66 |
74 |
71 |
77 |
3.5 |
|
EH |
|
|
|
|
|
|
|
PH |
80 |
60 |
74 |
68.5 |
76 |
4.8 |
|
HS |
|
|
|
|
|
|
Figure 70. Same as fig. 62, but for 5-day heat waves.

Figure 71. Same as fig. 64, but for 5-day heat waves.

Table 13 shows the statistics for daily 3-day Yarnal dew points, while figs. 73-74 show the box and whisker diagrams. BH recorded the highest dew point at 77ºF (tied with HS). While it also recorded the lowest dew point at 48ºF, it recorded the highest median, 25th percentile, and 75th percentile at 68ºF, 64ºF, and 71ºF respectively. The fact that for a majority of the statistics regarding dew points, it came out as the highest makes sense. BH is typically a Bermuda high type that introduces a south or southwesterly flow in the region. This means a more humid air mass, and thus typically higher dew points than the other Yarnal types. A possible explanation for BH having the lowest dew point is that it may have been recorded during a transitioning event. Typically, the NEUS will experience a transition of Yarnal types: first PH with high pressure to the west of the area, then EH with high pressure over the area, and finally BH with high pressure offshore, and then back to PH again after the passage of a cold front, repeating the cycle (Pollina et al). The minimum dew point may have been recorded during a transition period from EH to BH, or from BH to PH after the passage of cold front, which would allow high dew points to lower as a drier air mass filters into the region.
PH is typically a drier air mass, since it introduces a northwest flow (off shore). It would therefore be expected to show lower dew points during heat wave events. While the maximum and minimum are not the lowest among the Yarnal types (74ºF and 51ºF respectively), the median, 25th percentile, and 75th percentile are (63ºF, 58ºF, and 67ºF respectively). The median, 25th percentile and 75th percentile are a more consistent way to show that PH is a drier air mass, since they take into account all values, not just one (such as the case with the maximum and minimum).
BH and PH show the highest variability with standard deviations of 5.6. This could hint at the fact that the transitioning between synoptic types causes a high amount of variability for these types. EH has the lowest variability among the synoptic types at 4.6.
Figs. 72-75 show box and whisker diagrams for BH, EH, PH, and HS respectively.
Table 13. Maximum, minimum, median, 25th percentile, 75th percentile, and standard deviation of daily dew points for each BH, EH, PH, and HS for 3-day heat waves.
|
Yarnal type |
Maximum dew point |
Minimum dew point |
Median |
25th percentile |
75th percentile |
Standard deviation |
|
BH |
77 |
48 |
68 |
64 |
71 |
5.6 |
|
EH |
73 |
53 |
65 |
62 |
69 |
4.6 |
|
PH |
74 |
51 |
63 |
58 |
67 |
5.6 |
|
HS |
77 |
55 |
64 |
62 |
68.5 |
5.3 |
Figure 72. Box and whisker diagram for daily BH dew points.
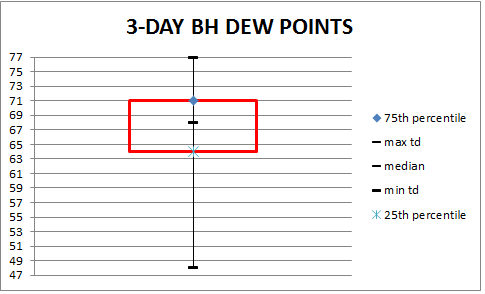
Figure 73. Same as fig. 72, but for EH.
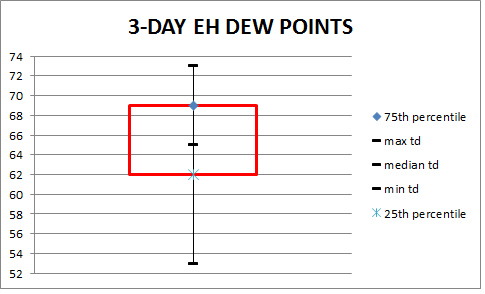
Figure74. Same as fig. 72, but for PH.
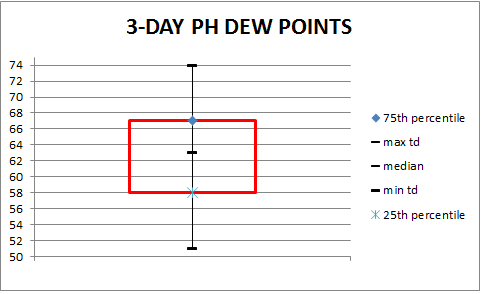
Figure 75. Same as fig. 72, but for HS.
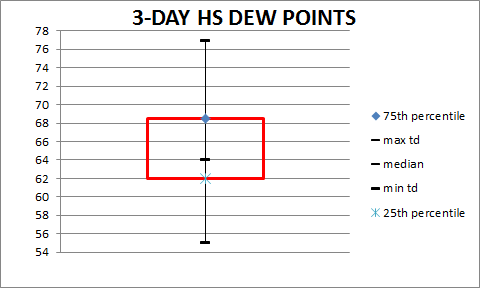
With 4-day daily synoptic type dew points in table 14, BH shows the highest maximum dew point out of all the synoptic types at 77ºF. However, like 3-day heat waves, it comes in at the lowest minimum dew point out of all synoptic types at 48ºF. Again, this may be due to transitioning synoptic types. Median and 25th percentile are highest out of all the synoptic type (69ºF and 67ºF respectively), however, it is only the 2nd highest at 75th percentile (72ºF), coming in behind HS. Although winds are typically westerly with an HS type, a slight turn to a more southwesterly flow would introduce a more humid air mass than would otherwise be seen in an HS type, which also can be seen in a transitory state from an HS to a BH.
PH for shows some evidence of being a drier air mass in 4-day heat waves. It shows the lowest dew points for the median, 25th percentile, and 75th percentile (62.5ºF, 60.5ºF, and 70ºF respectively) out of all the synoptic types. EH shows the lowest maximum dew point at 72ºF and as previously mentioned, BH shows the lowest minimum dew point. Again, these may occur during transitory states.
EH once again shows the lowest variability in 4-day heat waves, with a standard deviation of 4.6, while PH again shows the highest at 5.2.
Table 14. Same as in table 13, but for 4-day heat waves.
|
Yarnal type |
Maximum dew point |
Minimum dew point |
Median |
25th percentile |
75th percentile |
Standard deviation |
|
BH |
77 |
48 |
69 |
67 |
72 |
4.9 |
|
EH |
72 |
58 |
65.5 |
60.5 |
70 |
4.6 |
|
PH |
73 |
51 |
62.5 |
58 |
65 |
5.2 |
|
HS |
75 |
61 |
67 |
62 |
73 |
5.1 |
Figure 76. Same as fig. 72, but for 4-day heat waves.
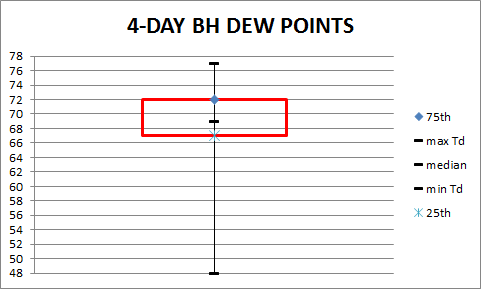
Figure 77. Same as in fig. 73, but for 4-day heat waves.
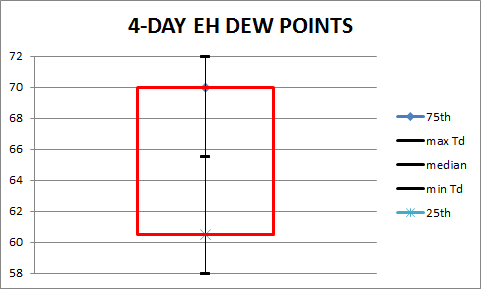
Figure 78. Same as in fig. 74, but for 4-day heat waves.
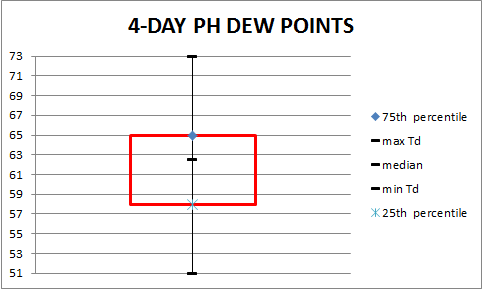
Figure 79. Same as in fig. 75, but for 4-day heat waves.
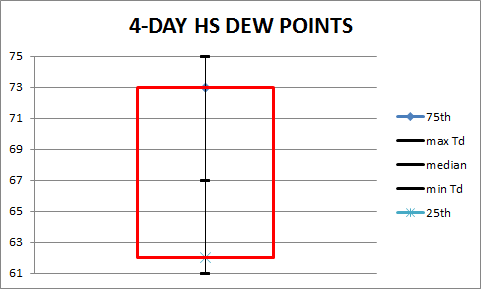
As with temperatures, EH and HS will be missing for 5-day daily synoptic dew points, since there was not enough data to produce meaningful results from these synoptic types. BH comes in with the higher dew points for each category, while PH therefore come in at the lowest.
Table 15. Same as in table 13, but for 5-day heat waves.
|
Yarnal type |
Maximum dew point |
Minimum dew point |
Median |
25th percentile |
75th percentile |
Standard deviation |
|
BH |
76 |
57 |
68 |
66 |
70 |
3.7 |
|
EH |
|
|
|
|
|
|
|
PH |
75 |
51 |
60 |
57 |
65 |
5.5 |
|
HS |
|
|
|
|
|
|
Figure 80. Same as in fig. 72, but for 5-day heat waves.
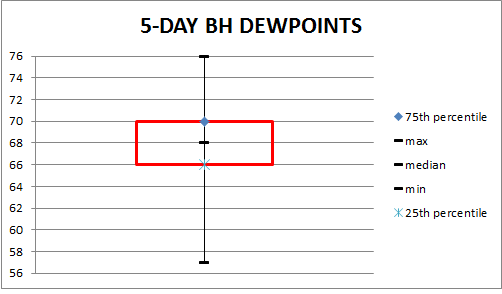
Figure 81. Same as in fig. 74, but for 5-day heat waves.
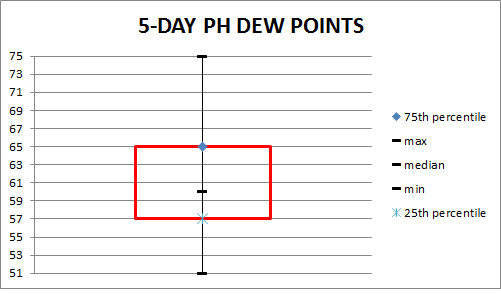
Box and whisker diagrams were also created for hourly temperatures for each Yarnal synoptic type for 3-, 4-, and 5-day heat waves. 3-day heat waves had the biggest sample size, so they are shown here. 4- and 5-day heat waves did not have enough data to create meaningful plots.
For the BH type (fig. 82), the median temperature increases from 78ºF at 12Z to 86ºF at 15Z to 91ºF at 18Z and then decreases down to 90ºF by 21Z.
12Z temperatures had a range from a low of 65ºF to a high of 88ºF. The 25th percentile was at 75ºF, while the 75th percentile was at 80ºF. The standard deviation was 4.23.
15Z temperatures had a range from a low of 76ºF to a high of 97ºF. The 25th percentile was 83ºF, while the 75th percentile was 89ºF. The standard deviation was 3.86.
18Z temperatures had a range from a low of 85ºF to a high of 103ºF. The 25th percentile was 89ºF, while the 75th percentile was 94ºF. The standard deviation was 3.47.
Finally, 21Z temperatures had a range from a low of 76ºF to a high of 101ºF. The 25th percentile was 88ºF, while the 75th percentile was 93ºF. The standard deviation was 4.68.
Figure 82. Box and whisker diagrams for hourly temperatures for BH synoptic type for 3-day heat waves.

For the PH type (fig. 83), the median temperature increases from 76ºF at 12Z to 84 at 15Z to 90ºF by 18Z and then continues to increase to 91ºF by 21Z.
12Z temperatures had a range from a low of 69ºF to a high of 84ºF. The 25th percentile was at 73ºF, while the 75th percentile was at 78ºF. The standard deviation was 3.73.
15Z temperatures had a range from a low of 79ºF to a high of 92ºF. The 25th percentile was 82ºF, while the 75th percentile was 87ºF. The standard deviation was 3.16.
18Z temperatures had a range from a low of 85ºF to a high of 96ºF The 25th percentile was 89.25ºF, while the 75th percentile was 92ºF. The standard deviation was 2.64.
Finally, 21Z temperatures had a range from a low of 83ºF to a high of 96ºF. The 25th percentile was 90ºF, while the 75th percentile was 92ºF. The standard deviation was 2.84.
Figure 83. Same as in fig. 82, but for PH type.

For the EH type (fig. 84), the median temperature increases from 76ºF at 12Z to 85 at 15Z to 91ºF by 18Z and then decreases to 90ºF by 21Z.
12Z temperatures had a range from a low of 68ºF to a high of 90. The 25th percentile was at 74ºF, while the 75th percentile was at 80ºF. The standard deviation was 4.50.
15Z temperatures had a range from a low of 72ºF to a high of 95. The 25th percentile was 83.2ºF5, while the 75th percentile was 88.75ºF. The standard deviation was 4.38.
18Z temperatures had a range from a low of 82ºF to a high of 100. The 25th percentile was 89ºF, while the 75th percentile was 93.25ºF. The standard deviation was 3.73.
Finally, 21Z temperatures had a range from a low of 83ºF to a high of 102. The 25th percentile was 88ºF, while the 75th percentile was 92ºF. The standard deviation was 4.40.
Figure 84. Same as in fig. 82, but for EH type.

For the HS type (fig. 85), the median temperature increases from 77ºF at 12Z to 84.5 at 15Z to 90.5ºF by 18Z and then decreases to 90ºF by 21Z.
12Z temperatures had a range from a low of 66ºF to a high of 81ºF. The 25th percentile was at 72ºF, while the 75th percentile was at 78ºF. The standard deviation was 4.62.
15Z temperatures had a range from a low of 75ºF to a high of 89ºF. The 25th percentile was 82.75ºF, while the 75th percentile was 86.25ºF. The standard deviation was 3.75.
18Z temperatures had a range from a low of 86ºF to a high of 95ºF. The 25th percentile was 89.75ºF, while the 75th percentile was 92.25ºF. The standard deviation was 2.37.
Finally, 21Z temperatures had a range from a low of 83ºF to a high of 94ºF. The 25th percentile was 85.75ºF, while the 75th percentile was 93.25ºF The standard deviation was 4.08.
Figure 85. Same as in fig. 82, but for HS type.
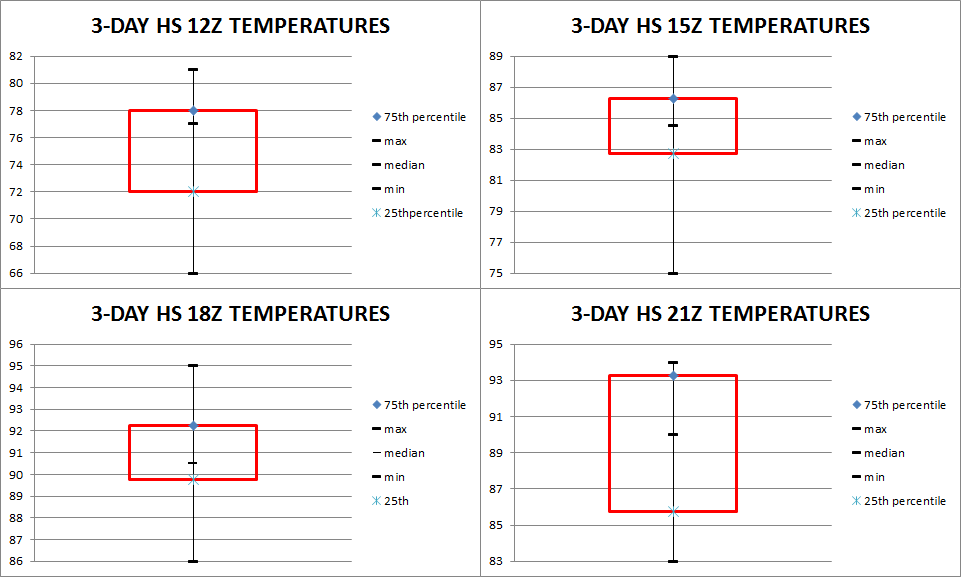
Box and whisker diagrams were also created for hourly dew points for each Yarnal synoptic type for 3-day heat waves. As with temperatures, since they were the most common type, 3-day heat waves were the only heat waves that hourly box and whisker diagrams were created. 4- and 5-day heat waves did not have enough data to create meaningful plots.
For the BH type (fig. 86), the median dew point is 68ºF at 12Z, 15Z and 18Z, then decreases to 67ºF by 21Z.
12Z dew points had a range from a low of 49ºF to a high of 75ºF. The 25th percentile was at 64ºF, while the 75th percentile was at 70ºF. The standard deviation was 5.39.
15Z dew points had a range from a low of 52ºF to a high of 76ºF. The 25th percentile was 65ºF, while the 75th percentile was 77ºF. The standard deviation was 5.67.
18Z dew points had a range from a low of 52ºF to a high of 76ºF. The 25th percentile was 62ºF, while the 75th percentile was 70ºF. The standard deviation was 5.96.
Finally, 21Z dew points had a range from a low of 48ºF to a high of 76ºF. The 25th percentile was 61ºF, while the 75th percentile was 70ºF. The standard deviation was 5.78.
Figure 86. Box and whisker diagrams for hourly dew points for BH type for 3-day heat waves.

For the PH type (fig. 87), the median dew point increases from 62ºF at 12Z to 62.5ºF at 15Z decreases back to 62ºF by 18Z and then continues to decrease to 61ºF by 21Z.
12Z dew points had a range from a low of 55ºF to a high of 73ºF. The 25th percentile was at 58ºF, while the 75th percentile was at 64.75ºF. The standard deviation was 4.99.
15Z dew points had a range from a low of 55ºF to a high of 74ºF. The 25th percentile was 58.75ºF, while the 75th percentile was 65ºF. The standard deviation was 5.01.
18Z dew points had a range from a low of 52ºF to a high of 74ºF The 25th percentile was 58ºF, while the 75th percentile was 65ºF. The standard deviation was 5.58.
Finally, 21Z dew points had a range from a low of 51ºF to a high of 73ºF. The 25th percentile was 57ºF, while the 75th percentile was 65.5ºF. The standard deviation was 6.00.
Figure 87. Same as in fig. 86, but for PH type.
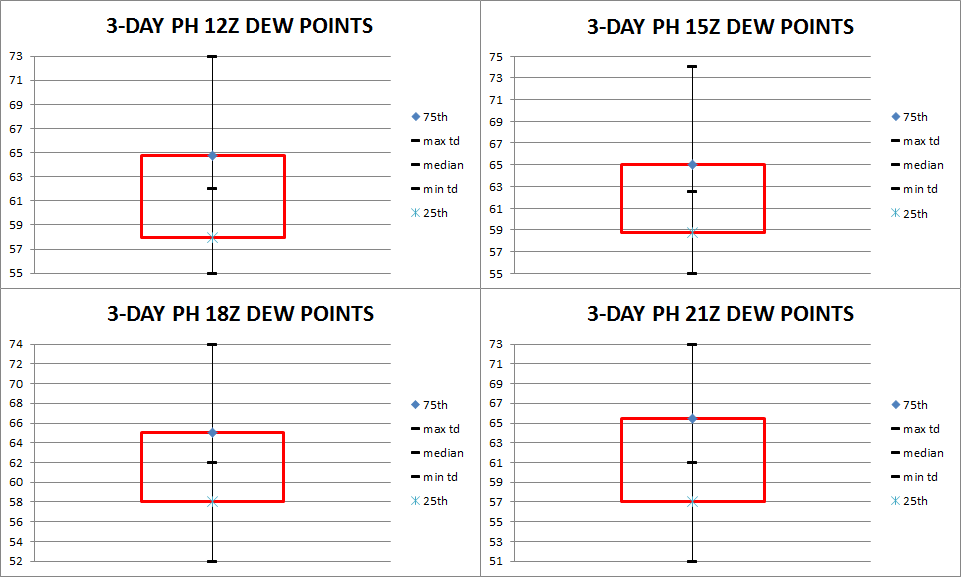
For the EH type (fig. 88), the median dew point decreases from 66ºF at 12Z to 65.5ºF at 15Z to 65ºF by 18Z and then increases to 67ºF by 21Z.
12Z dew points had a range from a low of 55ºF to a high of 70ºF. The 25th percentile was at 62.25ºF, while the 75th percentile was at 68ºF. The standard deviation was 4.19.
15Z dew points had a range from a low of 54ºF to a high of 72ºF. The 25th percentile was 64ºF, while the 75th percentile was 68.75ºF. The standard deviation was 4.55.
18Z dew points had a range from a low of 56ºF to a high of 73ºF. The 25th percentile was 60.75ºF, while the 75th percentile was 68ºF. The standard deviation was 4.70.
Finally, 21Z dew points had a range from a low of 59ºF to a high of 72ºF. The 25th percentile was 63ºF, while the 75th percentile was 69ºF. The standard deviation was 4.04.
Figure 88. Same as in fig. 86, but for EH type.

For the HS type (fig. 89), the median dew point increases from 64ºF at 12Z to 66ºF at 15Z then decreases to 63ºF by 18Z and then increases to 64ºF by 21Z.
12Z dew points had a range from a low of 57ºF to a high of 73. The 25th percentile was at 61ºF while the 75th percentile was at 68ºF. The standard deviation was 5.13.
15Z dew points had a range from a low of 55ºF to a high of 75. The 25th percentile was 62ºF, while the 75th percentile was 68.75ºF. The standard deviation was 5.49.
18Z dew points had a range from a low of 59ºF to a high of 73. The 25th percentile was 61.75ºF, while the 75th percentile was 69ºF. The standard deviation was 4.75.
Finally, 21Z dew points had a range from a low of 55ºF to a high of 77. The 25th percentile was 61.5ºF, while the 75th percentile was 67.75ºF The standard deviation was 6.39.
Figure 89. Same as in fig. 86, but for HS type.

It is interesting to note that median temperatures increase from 18Z to 21Z for PH types, while they decrease during this time frame for BH types. Perhaps the northwesterly flow in PH allows for more downsloping and thus higher temperatures. Also of note is that BH has the highest temperatures out of all the synoptic types at 12Z, perhaps this is due to the more humid nature of the synoptic type (a more humid air mass will prevent overnight temperatures from dropping too much due to the high specific heat of water), as is noted with the highest median dew point in table 14 (3-day Yarnal dew points) and it had the highest hourly median dew points out of all the Yarnal synoptic types.
There is little change overall from hour to hour in regards to dew point in the synoptic types, however, the least change occurs in the BH type, where the median dew point remains at 68 from 12Z through 18Z.
The PH median dew points show an increase through 15Z, then decreases through 21Z. This again may show how downsloping plays a part in these types of heat waves. Downsloping causes compressional heating and drying. Already previously noted was the warming through 21Z, and the decreasing dew points after 15Z is evidence of drying.
BH has both the highest and lowest observed dew points. This could be due to the fact that a transition from one synoptic type to another is usually observed. For instance, PH starts off, then transitions to EH, and finally BH. The lower dew points may actually be due to a quick transition from the dry PH overnight which then quickly becomes BH by 12Z (the time the maps were investigated to determine what synoptic type was affecting NYC that day).
EH had the lowest standard deviation in the 3-day heat waves among all synoptic types (table 14), however, it had some of the highest standard deviations when looked at hourly. In other words, EH dew points didn’t vary much as compared to other synoptic types, but when looked at hourly, it had some of the highest variation compared to the other synoptic types.
When looking at both high and low temperatures, HS seems to be the warmest synoptic type when looking at 3-day heat waves. It has the 2nd highest maximum temperature (tied with BH at 102ºF [table 9], the highest median temperature for the high and low temperatures, it has the highest temperature at the 25th percentile for both high and low temperatures and is tied for the highest temperature at the 75th percentile for high temperature and has the highest temperature at the 75th percentile for the low temperatures (tables 9 and 10). However, as previously noted, HS does not occur frequently.
In general, there isn’t much range between temperatures for the synoptic types for 3-day heat waves. Maximum high temperatures only range from 99ºF-102ºF and maximum low temperatures only range from 82ºF-84ºF. Minimum low temperatures only range from 58ºF-62ºF. Median temperatures for highs range from 92ºF-93ºF and from 72ºF-75ºF for lows. The 25th percentile ranges from 91ºF-92ºF for highs and 70ºF-72ºF for lows. Finally, the 75th percentile ranges from 94ºF-95ºF for highs and from 74ºF-77ºF for lows.
In general, high temperatures increase from the start of a heat wave, to somewhere in the middle, then decrease. For 3-day heat waves, high temperatures increase from day 1 to day 2, then decrease from days 2 to 3. For 4-day heat waves, high temperatures increase from days 1 to 3, then decrease through day 4. For 5-day heat waves, high temperatures increase from days 1 to 3, then decrease through day 5. Low temperatures follow the same pattern.
Generally, longer heat waves mean higher temperatures. Low temperatures do not necessarily follow this pattern.
The frequency of heat waves may be another metric to gage climate change. In NYC, prior to the 1940s, there were few higher order (6-day or greater) heat waves. Beginning in the 1940s and onward, there were multiple higher order heat waves in every decade. Also, from the 1930s through the 1990s, the frequency of 3-day heat waves occur at least as often as the peak in the 3-day heat waves from the 1880s-1920s (peaking at 9 events in the 1890s). There were only 7 3-day heat wave events in the 2000s, however, this is misleading because there is a peak of 6 4-day heat waves in this decade (tied with the 1990s), plus there were 2 6-day heat waves and an 8- and a 9-day heat wave event. There may have been a peak of 4-day heat waves in the 1940s, but 4-day heat waves have been on the rise since the 1950s, with more higher order events occurring.
The earliest heat waves can occur in NYC is April and the latest is in September. The occurrence of heat waves increases from April through July (the peak), then they decrease through September.
850 hPa temperatures generally range between 15°C to 20°C during heat wave events. 850 hPa temperatures also generally follow the pattern of high temperatures, increasing through the middle of the heat wave then decreasing (when looking at 8 pm temperatures, slight variations are seen in 3-day heat waves for 8 am temperatures).
Looking at average maximum hourly temperatures and the dew points at those hours, 4-day heat waves have the highest maximum hourly temperatures and dew points and thus highest average HI, with the greatest difference between average actual maximum hourly temperature and average HI (4.1°F). This may contradict the previous statement that 5-day heat waves have higher maximum temperatures than 3- and 4-day heat waves, but there are two things to consider: 1) these are maximum hourly temperatures taken every 3 hours (hourly temperatures are not available for the entire data set, so every 3 hours was used). They are likely not capturing the high temperature for the days. 2) There were only 8 events to consider for 5-day events (40 temperatures) as opposed to 18 events (72 temperatures) for 4-day and 31 events (93 temperatures) for 3-day events. Thus, there may not be enough 5-day events to accurately compare to 3- and 4-day events.
A daytime diurnal curve can be developed for 3-, 4- and 5-day heat wave events. Temperatures increase from 12Z through 18Z, then decrease slightly by 21Z. The largest increase is seen from 12Z-15Z (by 8°F-9F). Thereafter, temperatures increase 5°F-6°F from 15Z to 18Z. Thereafter, temperatures drop slightly (up to 2°F). Combine this with the fact that dew points change very little throughout the daytime hours, there is an overall decrease in RH throughout the day. While a decrease in RH may seem like the air mass is getting drier and therefore the HI should not be as high, the temperature rise counteract this feature. Meaning that because RH is decreasing, it does not necessarily mean the HI is decreasing, since temperatures are increasing more, allowing the HI to increase despite the lowering of RH.
A majority of maximum hourly temperatures occur between 17Z and 19z, with 20Z-21Z coming in 2nd. A small percentage of maximum hourly temperatures occur very early in the day, between 15Z-16Z. Increased cloud cover, convection or precipitation in general, and passage of a cold front all can lead to cutting off diabatic heating early in the day.
Most dew points at the time of max hourly temperature fall between 65â°F and 69â°F, though 70â°F to 74â°F is most common for 4-day heat waves, while there is a secondary peak of lower dew points for 5-day heat waves between 54â°F and 59â°F. This, along with other data shown, proves that 4-day heat waves are generally associated with higher dew points (and thus higher heat indices) while 5-day heat waves are associated with lower dew points (and thus lower heat indices). However, based on research from Matte et al. XXXX (date of article), prolonged exposure to heat waves for longer periods of time that are not as hot as heat waves that are hotter but shorter in duration may be equally, if not more dangerous.
Comparisons of temporal evolution of composite MSLP from 3-, 4-, and 5-day heat waves show that a Bermuda type high pressure system is in place over the northern Atlantic Ocean for all 3 heat wave types, with some differences in the average central location of the high. During the 3-day heat waves, this high pressure intensifies on the second day, then weakens by the third day. 5-day weaken on the 2nd day, then remains at the same strength through the 5th day. For 4-day heat waves, the high remains nearly the same strength through all 4 days on average. All three heat wave types exhibit a thermal trough that develops over the NEUS, with slight differences in spatial and temporal evolution. MSLP anomalies show a range from 0 to +2 mb over NYC at the beginning of 3- and 4-day heat waves, then trend to -1 to -3 mb near the end. 5-day heat waves begin with up to a +3 mb to +4 mb anomaly, then trend to 0 through the period, with slightly negative anomalies located just north of NYC by day 5.
Comparisons of temporal evolution of composite 500 mb height shows that the NEUS lies between an exiting trough and entering ridge. The ridge (over the Great Lakes region) typically deamplifies (weakens) as it moves east during the heat wave events, becoming zonal near the end of the events. A closed off high is also evident over the southern US, and usually retrogrades west through the events. 500 mb height anomalies show some differences between the 3 different types of heat waves, but generally, positive anomalies exist over the eastern half of the US, with a core of +80 mb or greater height anomalies over or just north of the Great Lakes region. This core remains steady then weakens for 3- and 5-day heat waves, but strengthens on the 2nd day of 4-day heat waves, then weakens through the end of the heat wave.
At 850 mb, temperatures over NYC start off at 14â°C to 16â°C and generally warm to 18â°C to 20â°C through the end of all heat waves. 850 mb temperature anomalies start off +3â°C to +5â°C over the Great Lakes region. This anomaly stays constant in magnitude for 3-day heat waves, but becomes smaller in areal coverage as it moves east through the 3 day period. For 4-day heat waves, the anomaly increases to +5â°C to +6â°C through about half way through the heat wave, before decreasing somewhat at the end. For 5-day heat waves, the magnitude of the anomaly remains constant (>+4â°C) through day 3, then weakens thereafter to between +2â°C and +3â°C by day 5.
Surface winds for 3- and 4-day heat waves generally show no change in direction. Speeds range from 8-9 mph for 3-day heat waves and 7-8 mph for 4-day heat waves. 5-day heat waves show an increase in wind speeds from 5.0 to 5.6 mph on day 1 to 8.4 to 8.9 mph on day 4, then decrease to 7.8 to 8.4 on day 5. 5-day heat waves do show some minor variations in wind direction, from west on day 1 to southwest over the rest of the event. In all heat waves, the strongest winds are offshore.
Recognizing the above patterns in the composites is key to forecasting heat wave events in Central Park. Anomaly composites presented here can be used with Pennsylvania State University-National Weather Service's Weather and Research Page and analyzing the anomaly maps for the same elements presented here. If models show the same or similar patterns presented in this research, a heat wave is likely to occur. The web site is: http://cms.met.psu.edu/sref/
The most common high pressure synoptic type to affect NYC during any heat wave is a BH type (which affects anywhere from 33%-58% of all events depending on which type of heat wave). This is a Bermuda high type high pressure system that introduces a warm and humid air mass into the region. The next most common type to affect NYC is EH for 3-day heat waves, and PH for 4- and 5-day heat waves. The center of high pressure is over the area in EH, and subsidence occurring underneath this high allows for compressional heating. With PH, downsloping winds off the higher terrain from the northwest, especially after the passage of a cold front in the summer, when winds are typically stronger, allows for compressional heating and drying at the coastal plain (where NYC is located) as well. HS is the next most common type. The westerly component here also allows for some compressional heating.
Burrows, A.T.: Hot waves: conditions which produce them, and their effect on agriculture. Yearbook of the United States department of agriculture. Washington D.C.: U.S. G.P.O., 1901. 325-336.
Cubasch, U. et al, 2013: Introduction. In: Climate Change 2013: The Physical Science Basis. Contribution of Working Group I to the Fifth Assessment Report of the Intergovernmental Panel on Climate Change [Stocker, T.F., D. Qin, G.-K. Plattner, M. Tignor, S.K. Allen, J. Boschung, A. Nauels, Y. Xia, V. Bex and P.M. Midgley (eds.)]. Cambridge University Press, Cambridge, United Kingdom and New York, NY, USA.
Kalnay, E. and Coauthors, 1996: The NCEP/NCAR Reanalysis 40-year Project. Bull. Amer. Meteor. Soc., 77, 437-471.
L. P. Rothfusz, “The Heat Index Equation (or, More Than You ever Wanted to Know about Heat Index),” Tech. Attachment, SR/SSD 90-23, NWS S. Reg. Headquarters, Forth Worth, TX, 1990. http://www.srh.noaa.gov/images/ffc/pdf/ta_htindx.PDF
Metzger KB, Ito K, Matte TD (2010) Summer heat and mortality in New York City: how hot is too hot? Environ Health Perspect 118: 80–86. doi: 10.1289/ehp.0900906 [PMC free article] [PubMed].
National Centers for Environmental Prediction/National Center for Atmospheric Research (NCEP/NCAR) reanalysis (data available from 1948-2017) and the North American Regional Reanalysis (NARR) (data available from 1979-2017).
National Weather Service Glossary of Meteorology, published online 25 June, 2009 1:01 PM from http://w1.weather.gov/glossary/ retrieved June 9, 2012.
NOAA Central Library, https://library.noaa.gov/Collections/Digital-Collections/US-Daily-Weather-Maps, retrieved April 4, 2012.
NOAA National Centers for Environmental Information, https://www.ncei.noaa.gov/ retrieved August 2-4 2011.
Oolman, Larry, University of Wyoming, College of Engineering. http://weather.uwyo.edu/upperair/sounding.html retrieved September 2nd, 2013.
Pennsylvania State University-National Weather Service's Weather and Research Site, published online July 19, 2010, retrieved April 15, 2018 from http://cms.met.psu.edu/sref/.
Pollina, J. B. et al, 2013: Climatology and meteorological evolution of major wildfire events over the northeast united states, Weather and Forecasting, 28 (1), 175-193.
Robinson , P.J., 2001: On the definition of a heat wave. Journal of applied Meteorology, 40, 762-773.
Solecki, W.D. et al, 2005: Mitigation of the heat island effect in urban New Jersey. Glob Environ Change Part B: Environ Hazards 6 (1), 39–49.
United States Census Bureau, American Housing Survey (AHS), https://www.census.gov/programs-surveys/ahs/data.All.html, retrieved April 17 2012.
United States Environmental Protection Agency, 2012, https://www.epa.gov/heat-islands, retrieved online July 6, 2012.
WPC’s Surface Analysis Archive, http://www.wpc.ncep.noaa.gov/archives/web_pages/sfc/sfc_archive.php, retrieved April 4, 2012.
Wunderground, https://www.wunderground.com/history/airport/KNYC retrieved May 2, 2012.
Yarnal, B. 1993: Synoptic climatology in environmental analysis: a primer. Belhaven Press, London.


 Coastal Flooding
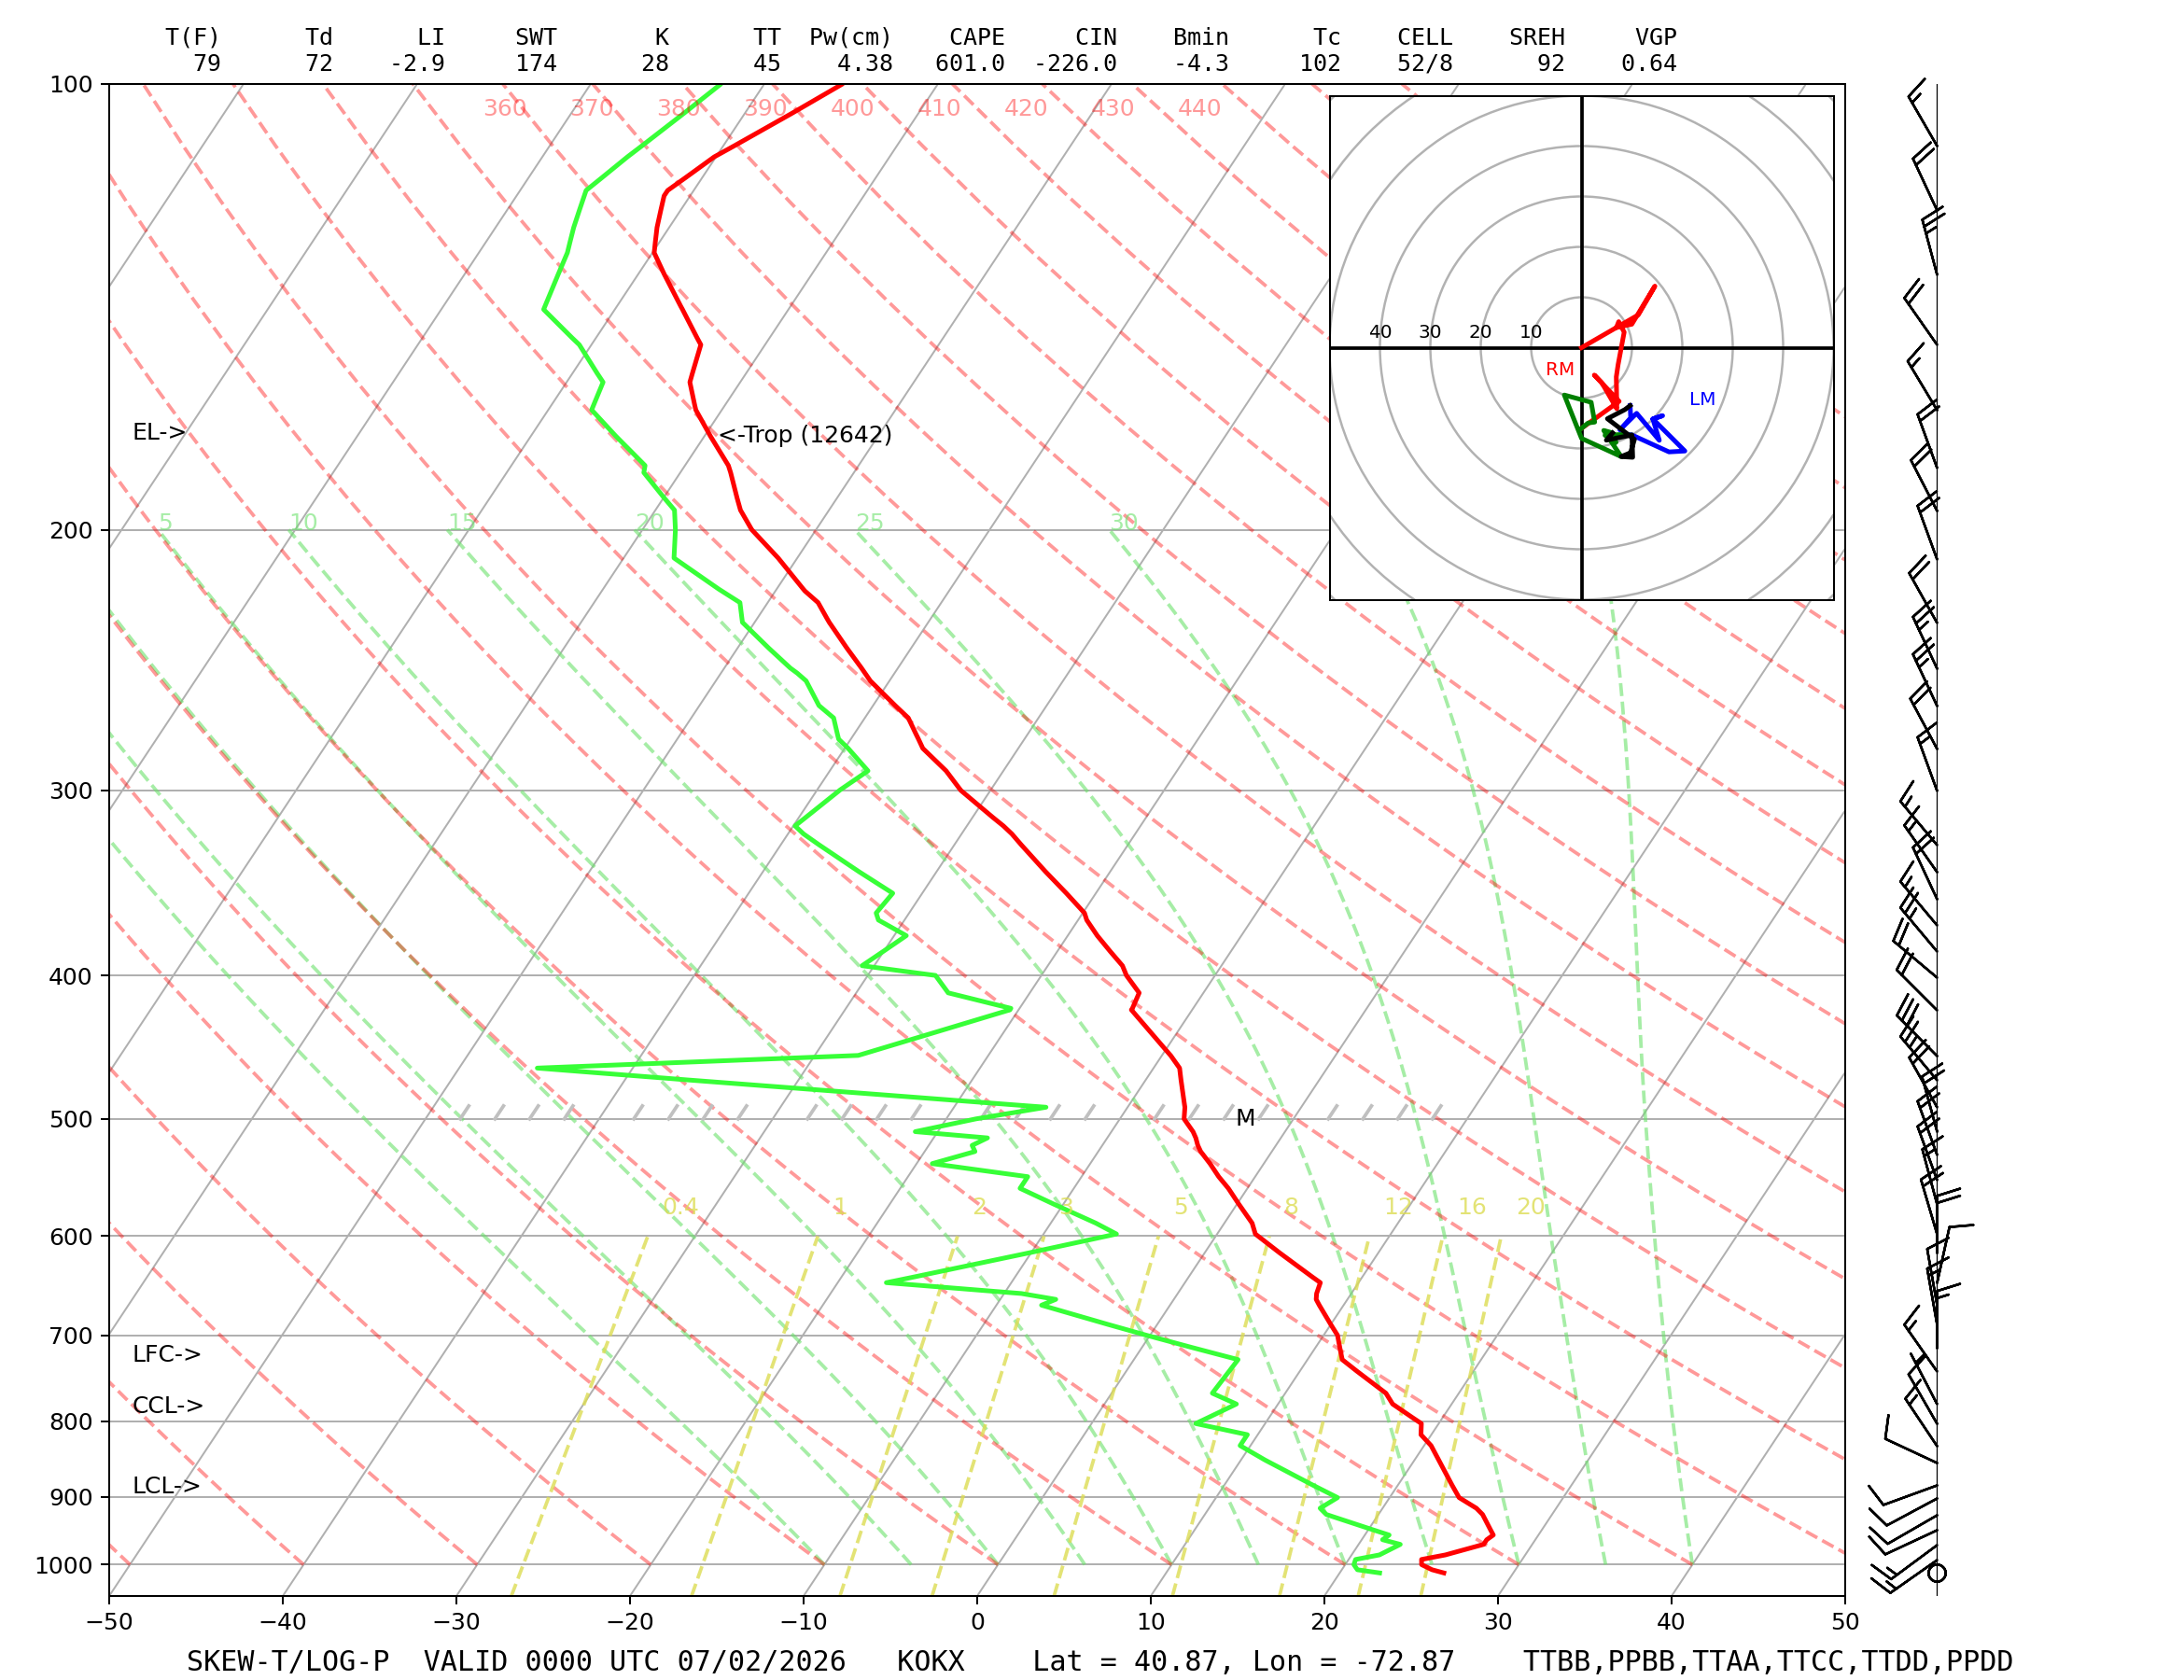