The potential for heavy snow at higher elevations in the western U.S. will continue for many spots through the weekend. In the meantime, the eastern half of the continental U.S. will transition to above normal temperatures ahead of a pair of cold fronts next week that will bring readings back to closer to normal as we approach Thanksgiving Day. Read More >
New York, NY
Weather Forecast Office
 |
 |
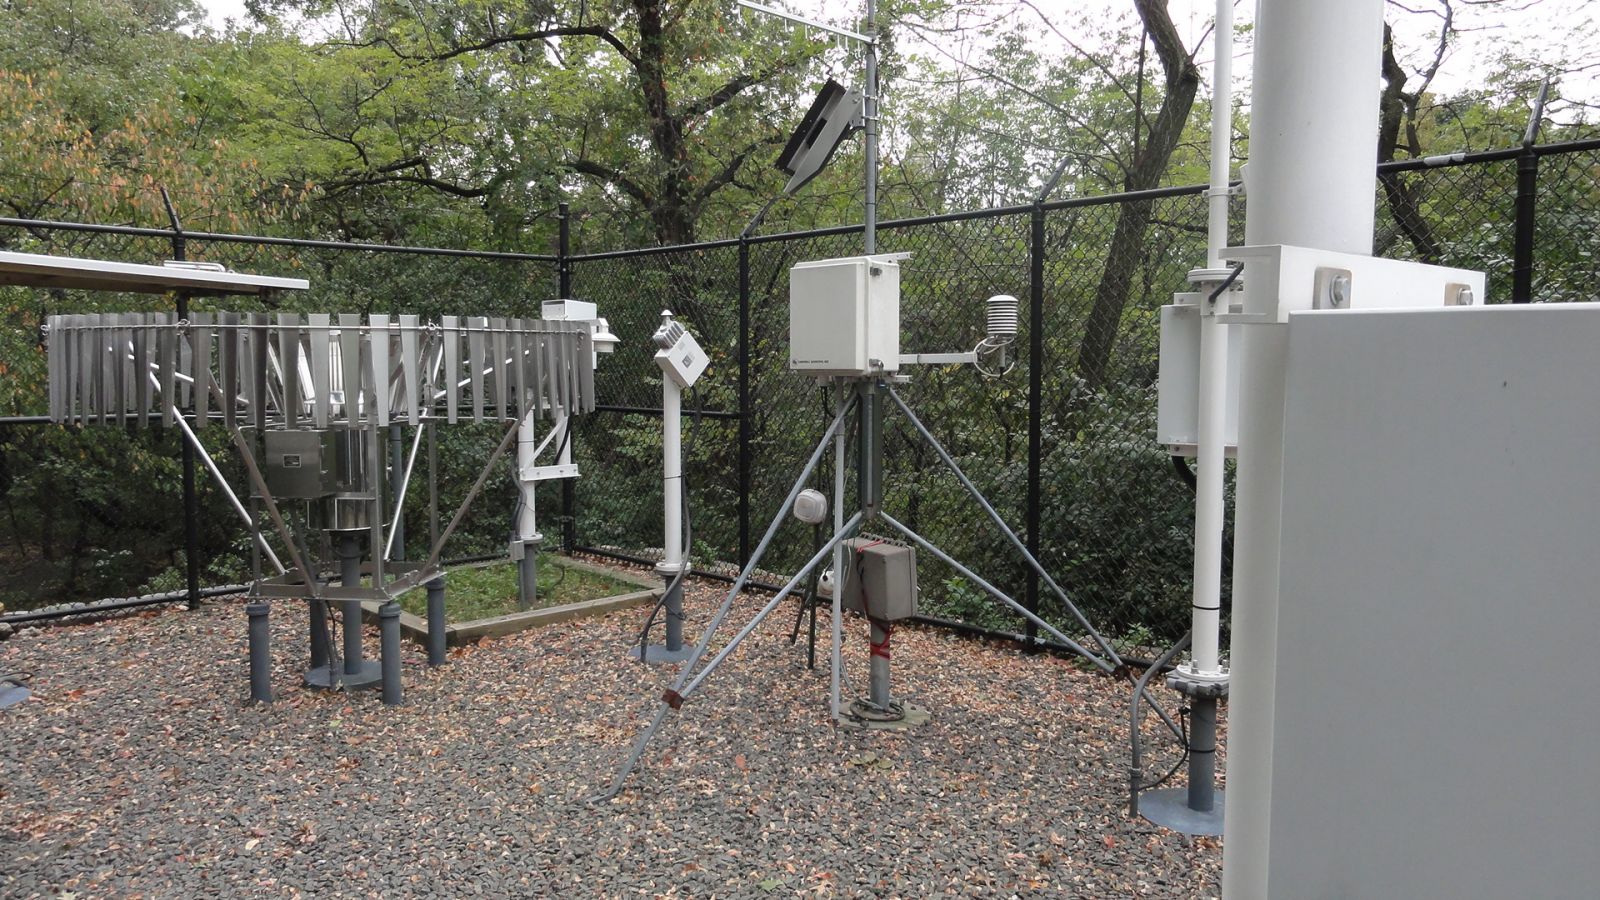
History of New York City Weather Observations
|
Central Park Observations
|
Dates
|
|
Arsenal Building 5th Ave (between 63rd & 64th)
|
1868 to 1920
|
|
Belvedere Castle Transverse Rd (near 79th & 81st)
|
1920 to present
|
|
Other New York City Observations
|
|
|
Fort Columbus on Governors Island*
|
1836 to 1854
|
|
162nd Street in Washington Heights*
|
1845 to 1870
|
|
The Cooper Union at Cooper Square*
|
1870 to 1877
|
|
Board of Underwriting Building at 49 Wall Street
|
1870 to 1871
|
|
Equitable Life Insurance Building at 120 Broadway
|
1871 to 1895
|
|
Manhattan Life Insurance Building at 66 Broadway
|
1895 to 1898
|
|
American Surety Building at 100 Broadway
|
1898 to 1911
|
|
Whitehall Building at 17 Battery Place
|
1911 to 1960
|
|
RCA/GE Building at 30 Rockefeller Plaza
|
1960 to 1995
|
| Click here to access southern Manhattan Data | |
|
Source: National Weather Service Data Archive |
|
Climatological Data
Move mouse over menu button to load specific data
Monthly Almanacs
Daily climatological data can be analyzed to produce averages and records. This information is included in our monthly almanacs. The almanacs also contain times of sunrise and sunset and daily records of precipitation and snowfall.
Daily, Monthly, Seasonal and Annual Climate Reports
The Daily Climate Report (CLI) is produced twice a day, at around 4:30 pm and 1:30 am. The 4:30 PM report contains data from 12:00 am EST (1:00 am EDT) to 4:00 PM local time and is referred to as "preliminary" data. The 1:30 am "daily" report contains 24 hours of data starting at 12:00 am EST (1:00 am EDT) the previous day.
Monthly reports are produced after each month has completed. Seasonal reports cover a three month period: Dec-Feb for Winter, Mar-May for Spring, Jun-Aug for Summer, and Sep-Nov for Fall.
Climate/Past Weather
Local Past Weather
Recent and Past Rainfall
Local Normals, Extremes and Records
Tropical Cyclone Reports
Current Conditions
Observations (List)
Observations (Map)
Marine Obs (Map)
Local Storm Report
Public Information Statement
Office Programs
Air Quality
Aviation Weather
Coastal Flooding
Co-op Observers
Fire Weather
Heat
Hydrology/Freshwater Flooding
Marine Weather
Outreach
Severe Weather
SKYWARN
Tropical Weather
Tsunami
Winter Weather
Upper Air
Weather Safety/Preparedness
Weather Ready Nation
Storm Ready
NOAA Weather Radio
Pubs/Brochures/Booklets
More Safety Links
US Dept of Commerce
National Oceanic and Atmospheric Administration
National Weather Service
New York, NY
175 Brookhaven Avenue
Upton, NY 11973
631-924-0517
Comments? Questions? Please Contact Us.


 Coastal Flooding