Mark A. Rose & Bobby Boyd
National Weather Service/Weather Forecast Office
Old Hickory, Tennessee
1. Introduction
During the afternoon of 20 June 1998, scattered convection across middle Tennessee produced sporadic severe winds and hail, and several areas of downburst-related outflow. A line of thunderstorms east of Nashville produced a westward-moving outflow boundary that moved across the metropolitan area. During the late afternoon, an innocuous, eastward-moving thunderstorm north of the city intersected the outflow boundary. It began a dramatic turn to the right, and exhibited rapid development. The storm took on severe storm reflectivity characteristics after intercepting the boundary, and produced widespread significant wind damage across the northern and eastern sections of the Nashville metropolitan area.
An analysis of the storm's evolution, using WSR-88D reflectivity and Doppler velocity imagery from Old Hickory (KOHX), was conducted. The influence of a westward-moving outflow boundary was observed to modify the storm's environment as it developed and produced intensification from a typical non-severe thunderstorm into a damaging, microburst-producing cell. The storm relative helicity increased fivefold as it developed a distinct inbound/outbound couplet.
2. Synopsis and Storm Overview
The synoptic environment on the morning of 20 June 1998 was characterized by surface high pressure (1017 mb) centered near the Great Smoky Mountains National Park, with weak surface winds over middle Tennessee. A weak 500 mb ridge was situated over the same area, with a weak (10-15 knot) northwest flow.
The 1200 UTC atmospheric sounding taken at Nashville (OHX) on 20 June indicated a stable environment. The surface-based lifted index was 0, and a large negative area extended from the surface to above 700 mb. Of note, the height of the wet-bulb zero was optimal for hail, at 3184 m (~10400 ft) above ground level (AGL). A 0-3 km SRH of 37 m2s-2 indicated a weakly sheared low-level environment. The sounding also revealed a delta theta-e of 21 K, where delta theta-e is the difference between the surface theta-e and the minimum theta-e aloft (Atkins and Wakimoto 1991). In this case, the surface theta-e was 337 K, and the minimum theta-e aloft (at 734 mb) was 316 K. Atkins and Wakimoto (1991) suggest that environments exhibiting a delta theta-e greater than 20 K are most conducive to microburst generation, whereas environments with delta theta-e less than 13 K are generally not conducive.
During the pre-dawn hours of 20 June, an area of convection moved across portions of western Kentucky and northwest Tennessee. This convection moved into middle Tennessee, affecting areas west of Nashville, and produced a large area of outflow. Convection redeveloped during the early afternoon in the vicinity of this outflow, and, aided by the afternoon heat, intensified quickly. The initial severe thunderstorm warning for this cluster of storms was issued at 1740 UTC, with subsequent warnings following quickly. (Overall, twenty-six severe weather warnings were issued by the Nashville office on 20 June -- 20 severe thunderstorm warnings, 4 tornado, and 2 flash flood.)
By mid afternoon, a line of thunderstorms east of Nashville had produced an outflow boundary (figures 1a-1b), which moved westward for several hours at 10 to 15 mph. When viewing the boundary using WSR-88D reflectivity imagery, it disappeared into the ground clutter after entering the Nashville metropolitan area shortly after 2106 UTC. However, a review of the surface observations taken at the Nashville International Airport (OHX) indicated the boundary likely passed the observation site, located in southeast Nashville, before 2153 UTC. At 2053 UTC, a line of towering cumulus was noted to the east through south, and was likely located along the boundary. The 2153 UTC observation indicated a wind shift from the southwest to southeast. The 2253 UTC observation noted that winds had veered back to the south.
Modifying the hodograph with values from the WSR-88D Velocity Azimuth Display (VAD) Wind Profile at 2333 UTC gave a 0-3 km SRH of 318 m2s-2 (using the default 0-3 km storm motion of 306o at 17 kts), indicating that significant modification of the low level wind profile had occurred since 1200 UTC (when the SRH was only 37 m2s-2).
3. Environmental and Storm Characteristics - Discussion
Table 1 gives a scan-by-scan summary of mean cloud layer flow, storm motion, 0-3 km SRH (using the storm motion and the 2333 UTC wind profile), the height of the maximum reflectivity, and the height above ground of each 0.5o scan. Mean cloud layer flow was calculated by averaging velocity data at several points along the VAD Wind Profile. (Insufficient data at 2328 UTC resulted from loss of data during change to auxiliary power at the Radar Data Acquisition (RDA).) The storm motion for each scan was derived using the WSR-88D identified storm centroid over three successive volume scans up to the current scan. Also, damage reports are listed throughout the table, with each entry correlated with the nearest volume scan.
The storm's evolution is shown by WSR-88D reflectivity imagery, beginning with the storm located near Clarksville (northwest of Nashville) (See figures 2a-2h.) The data in table 1 begin at 2229 UTC. (It was decided to use the 2333 UTC VAD Wind Profile as the default since it falls near the midpoint of the scan segment shown in table 1.) Please note again that SRH values presented in table 1 were calculated using the storm motion coincident with each scan, whereas the SRH values presented in section 2 were calculated using default storm motion.
| Table 1. WSR-88D and Environmental Characteristics | |||||
|---|---|---|---|---|---|
| Time (UTC) | Mean Cloud Layer Flow | Storm Motion | SRH (m2s-2) | Height of the maximum reflectivity (kft) | Height (AGL) of 0.5o scan (kft) at the storm location |
| 2229 | Insufficient Data | 271o/33 kts | 90 | 16.8 | 3.5 |
| 2235 | Insufficient Data | 275o/30 kts | 130 | 9.3 | 3.2 |
| 2240 | Insufficient Data | 288o/28 kts | 200 | 19.7 | 3.0 |
| 2246 | Insufficient Data | 296o/25 kts | 260 | 18.2 | 2.8 |
| 2252 | 240o/25 kts | 302o/28 kts | 270 | 9.7 | 2.5 |
| 2258 | 245o/25 kts | 298o/23 kts | 270 | 25.1 | 2.3 |
| 2304 | 240o/25 kts | 298o/23 kts | 270 | 6.0 | 2.1 |
| 2310 | 245o/30 kts | 305o/23 kts | 300 | 12.1 | 1.9 |
| 2316 | 255o/30 kts | 314o/23 kts | 350 | 17.8 | 1.8 |
| 2322 | 265o/30 kts | 318o/20 kts | 370 | 7.2 | 1.7 |
| 2328 (a) | Insufficient Data | 329o/20 kts | 420 | 25.0 | 1.5 |
| 2333 | 270o/30 kts | 332o/25 kts | 450 | 15.8 | 1.4 |
| 2339 | 270o/30 kts | 315o/25 kts | 360 | 6.6 | 1.2 |
| 2344 | 270o/25 kts | 306o/23 kts | 310 | 5.0 | 1.1 |
| 2350 | 270o/25 kts | 290o/21 kts | 230 | 11.9 | 1.0 |
| 2356 (b) | 270o/25 kts | 297o/21 kts | 270 | 5.9 | 0.9 |
| 0002 (c) | 260o/25 kts | 303o/23 kts | 300 | 6.3 | 0.8 |
| 0008 | 265o/25 kts | 304o/27 kts | 290 | 6.3 | 0.9 |
| 0014 | 260o/25 kts | 300o/27 kts | 270 | 9.2 | 1.1 |
| 0020 (d) | 265o/25 kts | 298o/20 kts | 280 | 10.9 | 1.2 |
| 0026 | 270o/25 kts | 291o/17 kts | 260 | 5.7 | 1.4 |
(a) Trees down over southeast Robertson County (2330 UTC)
(b) Numerous trees and power lines down, and some damage to homes in Hendersonville (Sumner County) (2357 UTC)
(c) Numerous trees down across western Wilson County (0000 UTC)
(d) Campers overturned at a campground west of Lebanon (Wilson County) (0020 UTC)
The storm exhibited a movement nearly due east before it intersected the outflow boundary east of Clarksville (Montgomery County) sometime between 2240 and 2250 UTC. The storm then began to turn right as it exhibited rapid intensification. At 2252 UTC, the WSR-88D exhibited weak storm velocity convergence (SVC) in the 5 to 11 kft (AGL) layer (Falk et. al. 1998). The magnitude of SVC had increased considerably by 2258 UTC. After 2258 UTC, a strong low-level reflectivity gradient formed along the storm's forward flank, indicating the location of a strong updraft (Lemon 1980). Using storm relative motion (SRM) imagery, the SVC at 2.4o, 3.4o, and 4.3o (6.8, 9.1, and 11.2 kft) was 42 kts. (Calculations of SVC are always taken along a radial.) At 2304 UTC, utilizing base velocity data, the storm showed a distinct 0.5o velocity pattern exhibiting pure divergence, indicating a gust front had developed (figure 3a). (It was decided to display base velocity instead of storm relative motion, since base velocity gives a more authentic estimate of the strength and motion of winds experienced near the surface.) At 1.5o (1300 m AGL), a reversal in the velocity field was detected, showing pure convergence (figure 3b), and indicating downburst potential within the storm. Magnitudes of the inbound base velocities continued to intensify as the storm's gust front surged east and southeast (figures 4a and 4b).
Between 2258 and 2316 UTC, the storm's most pronounced period of intensification, SRM data never indicated cyclonic rotation. Almost without exception, the predominant mid-level feature during this period was pure convergence (figures 5a and 5b). In fact, despite the high SRH values shown in Table 1, the storm failed to exhibit a vortex during its life cycle. Please note, however, that due to the close proximity of the storm to the RDA, meaningful velocity information was unavailable after 2316 UTC above the first three or four elevation angles.
Meanwhile, SVC calculations for the 2304 UTC scan at the 2.4o, 3.4o, and 4.3o elevation angles were almost identical to those of the previous scan (42, 42, and 44 kts). Values for the 2310 UTC scan remained consistent (42, 52, and 42 kts), with the SVC at the 3.4o slice exhibiting the only meaningful deviation. Inbound velocities at 0.5o (500 m AGL) reached 48 to 57 kts at 2316 UTC. Note the forward (southeastward) propagating region of outflow had strengthened, while the rearward (northwestward) component had weakened, as indicated by the inbound/outbound velocity signatures. These features indicate the bulk of the surface outflow strength was in the direction of the mid-level winds -- a feature consistent with the downward transport of higher momentum, the primary catalyst in wet microburst generation (Rose 1996). (Wet microbursts occur primarily in moist environments over the southeast United States.)
The storm produced wind damage over southeast Robertson County around 2330 UTC (Storm Data). By then, the SRH had increased to 300 m2s-2. Significant wind damage was reported in Hendersonville (southwest Sumner County) 27 minutes later. The storm subsequently moved into Wilson County. Between 0000 and 0020 UTC, widespread wind damage was reported across western Wilson County as the gust front pushed southeastward (figure 6). At about the same time, the storm exhibited a secondary peak in 0-3 km SRH (300 m2s-2). Afterward, the storm weakened and began to turn left, toward the east-southeast.
4. Discussion
The role of outflow boundaries in convection initiation has been well documented (Maddox et. al. 1980, Przybylinski et. al. 1993, Markowski et. al. 1998, Wakimoto et. al. 1998, Atkins and Weisman 1998). Indeed, the effects of merging outflow boundaries, or cases where a thunderstorm collides with a stationary boundary, are well known. Except for the development of convection over central and southern Florida, the documentation of a westward-moving outflow boundary interacting with an isolated cell is quite rare. The effects of this type of boundary are likely more dramatic, given the enhanced convergence provided by the angle of the colliding boundary and eastward-moving thunderstorm. In this case, such an angle would have very nearly been 180o, which thereby maximized the convergence. Other documented cases where two such opposing flows have met include Blottman and Padavona (1998), Holmes (1998), and Thompson and Edwards (2001). In each case, a thunderstorm complex intersecting a westward-moving outflow boundary not only intensified the storm's updraft, but also enhanced rotation within the storm. In this case, cyclonic or anticyclonic rotation was absent.
In the case presented here, the thunderstorm was innocuous before intersecting the outflow boundary. Upon collision, the storm updraft intensified, leading to 1) a stronger low-level reflectivity gradient along the storm's forward flank, 2) increased echo top and maximum reflectivity height, and 3) presence of strong low- to mid-level storm radial convergence along the storm's leading edge during the period of intensification. Once the storm collapsed, it turned back to the left, once again following the mean cloud layer flow, which was of a westerly direction. The SRH decreased correspondingly.
5. Conclusions
Because surface (low-level) winds were light, a westward moving outflow boundary developed from earlier convection. The effects of westward moving outflow boundaries on convection initiation are often more pronounced than with eastward-moving boundaries. The review presented here documents the collision of an innocuous thunderstorm with the remnants of a westward-moving boundary, which set off a chain of events that transformed the storm into a microburst producer. Also of particular note are the WSR-88D reflectivity and velocity characteristics of the downburst and swaths of damaging winds, including a divergent velocity couplet at low-levels (0.5o), coupled with a convergent couplet aloft, and bowing of the small convective line segment.
Meteorologists should be aware of the potential effects of westward-moving outflow boundaries, especially when they may intersect convection exhibiting a strong eastward component of motion. Previous research also indicates the results of such a combination can be dangerous.
Acknowledgements
The authors thank the following persons for their reviews and suggestions regarding this manuscript: Darrell Massie and John Gordon, Senior Forecasters, and Henry Steigerwaldt, Science and Operations Officer, Weather Forecast Office, Old Hickory, Tennessee. Thanks also go to Jeff Craven, co-editor, Electronic Journal of Operational Meteorology, as well as an anonymous reviewer, whose numerous comments and suggestions significantly improved this manuscript. A special thanks also goes to Mr. Steigerwaldt for his assistance with WATADS software, used to capture the WSR-88D imagery used in this presentation.
REFERENCES
Atkins, N.T., and R.M. Wakimoto, 1991: Wet microburst activity over the southeastern United States: Implications for forecasting. Wea. and Forecasting, 6, 470-482.
__________, and M.L. Weisman, 1998: The influence of pre-existing boundaries on supercell evolution. Preprints, 19th Conf. Severe Local Storms, Minneapolis, MN, AMS (Boston), 334-337.
Blottman, P.F. and D.J. Padavona, 1998: The June 4th 1995 multiple simultaneous landspouts. Preprints, 19th Conf. on Severel Local Storms, Minneapolis, MN, AMS (Boston), 173-176.
Falk, K., 1997: Techniques for issuing severe thunderstorm and tornado warnings with the WSR-88D Doppler radar. Technical Memorandum SR-185.
__________, L. Harrison, and J. Elmore, 1998: Preliminary downburst climatology and warning guidelines from a single cell thunderstorm database. Technical Attachment SR/SSD 98-31.
Holmes, R., 1998: The EROS hailstorm: July 13, 1997. National Weather Service Sioux Falls, SD.
Lemon, L.R., 1980: Severe thunderstorm radar identification techniques and warning criteria. NOAA Technical Memorandum, NWS NSSFC-3, Kansas City, 35 pp.
Maddox, R.A., L.R. Hoxit, and C.F. Chappell, 1980: A study of tornadic thunderstorm interactions with thermal boundaries. Mon. Wea. Rev., 108, 322-336.
Markowski, P.M., E.N. Rasmussen, and J.M. Straka, 1998: The occurrence of tornadoes in supercells interacting with boundaries during VORTEX-95. Wea. and Forecasting, 13, 852-859.
Przybylinski, R.W., J.T. Snow, E.M. Agee, and J.T. Curran, 1993: The use of volumetric radar data to identify supercells: A case study of June 2, 1990. In Proceedings, Tornado Symposium III. (C. Church, ed.) Amer. Geophys. Union.
Rose, M.A., 1996: Downbursts. Nat'l. Wea. Digest, 21:1, 21-25.
Thompson, R.L. and R. Edwards, 2001: An overview of environmental conditions and forecast implication of the 3 May 1999 tornado outbreak. Accepted to Wea. Forecasting.
Wakimoto, R.M., C.-H. Liu, and H.-Q. Cai, 1998: The Garden City, Kansas storm during VORTEX-95. Part I. Overview of the storm's life cycle and mesocyclogenesis. Mon. Wea. Rev., 126, 372-392.
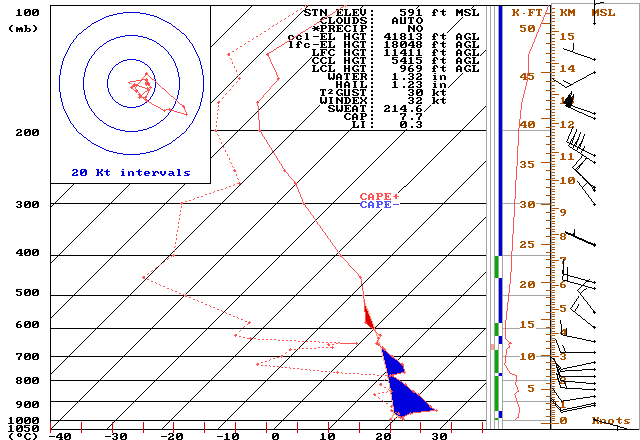
Sounding
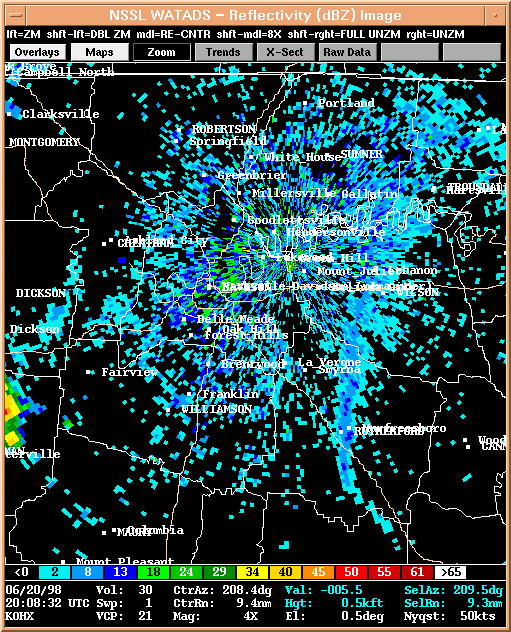
Figure 1a. KOHX WSR-88D 0.5o base reflectivity image taken at 2008 UTC. Note the westward moving outflow boundary extending from east of Gallatin, in Sumner County, to south of Murfreesboro, in Rutherford County.
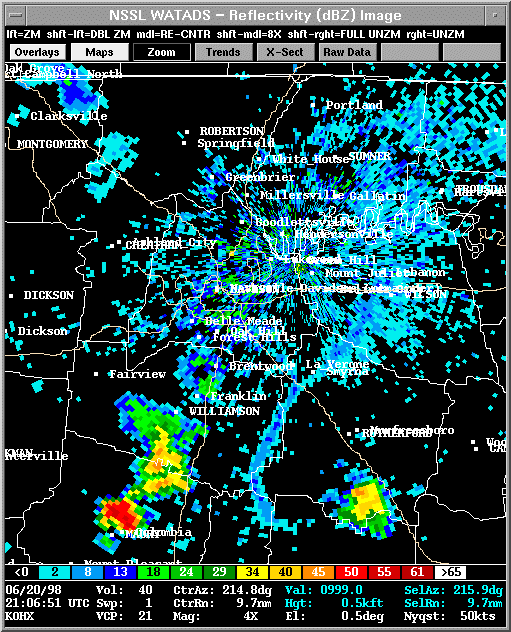
Figure 1b. KOHX WSR-88D 0.5o base reflectivity image taken at 2106 UTC. The southern extent of the outflow boundary has accelerated westward, exhibiting a bow-like structure. The northern extent is not clearly discernible in the ground clutter, but is likely between Lebanon and Mount Juliet in Wilson County.
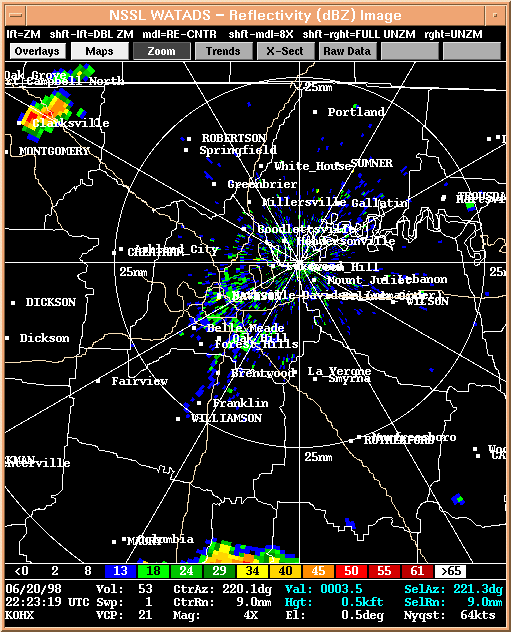
Figure 2a. KOHX WSR-88D 0.5o base reflectivity image taken at 2223 UTC.
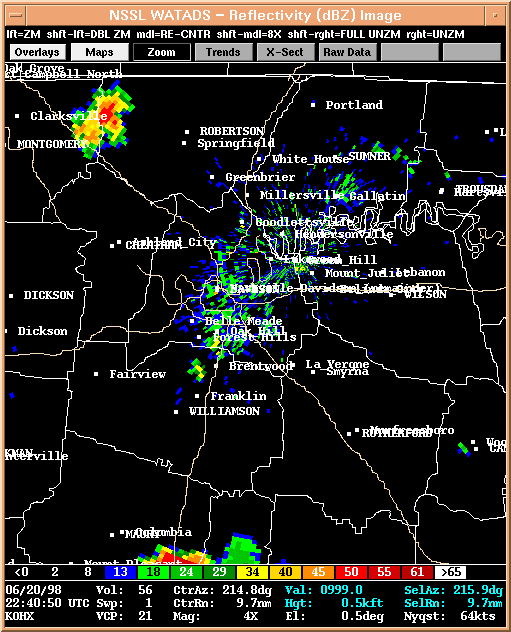
Figure 2b. KOHX WSR-88D 0.5o base reflectivity image taken at 2240 UTC.
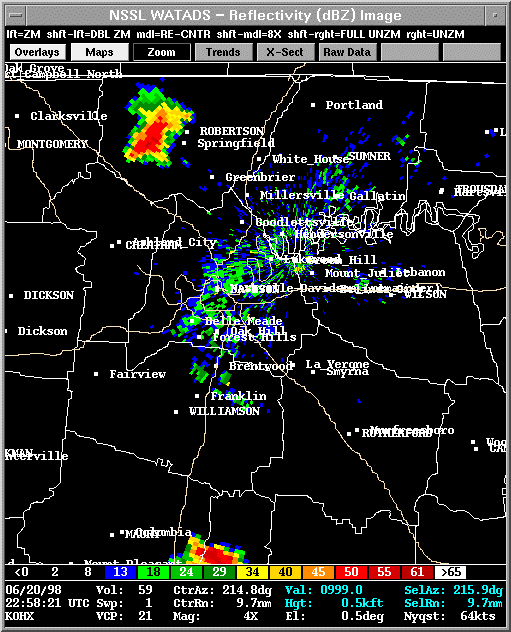
Figure 2c. KOHX WSR-88D 0.5o base reflectivity image taken at 2258 UTC.
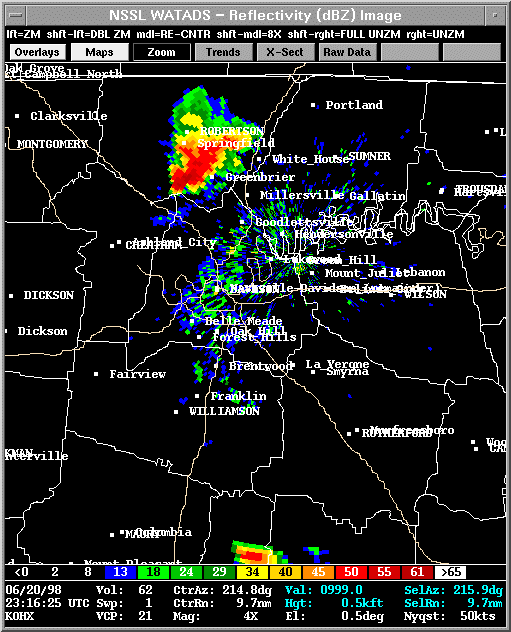
Figure 2d. KOHX WSR-88D 0.5o base reflectivity image taken at 2316 UTC.
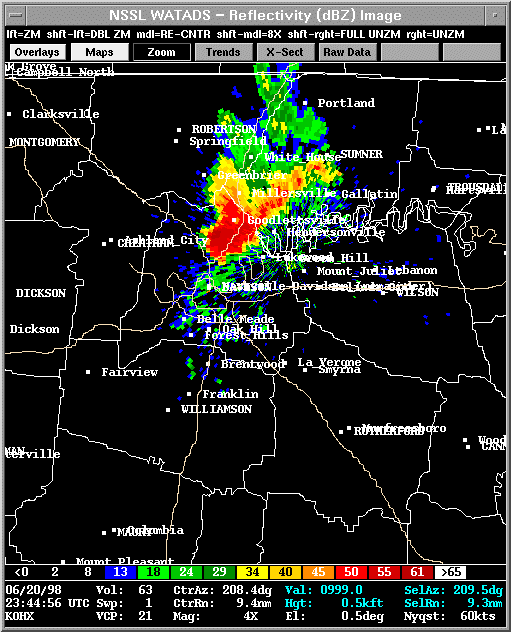
Figure 2e. KOHX WSR-88D 0.5o base reflectivity image taken at 2344 UTC.
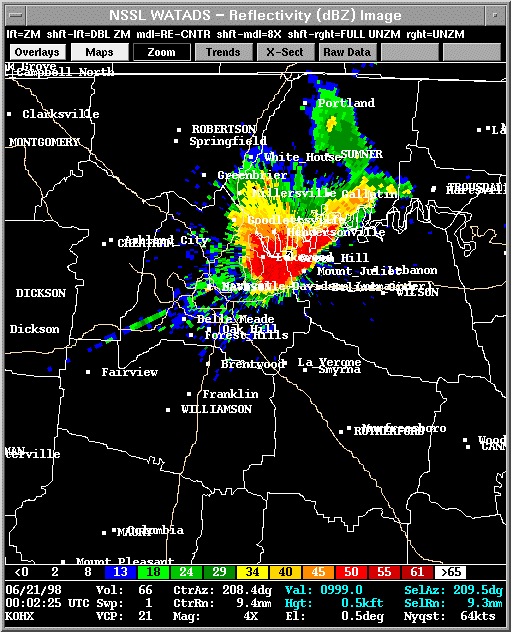
Figure 2f. KOHX WSR-88D 0.5o base reflectivity image taken at 0002 UTC.
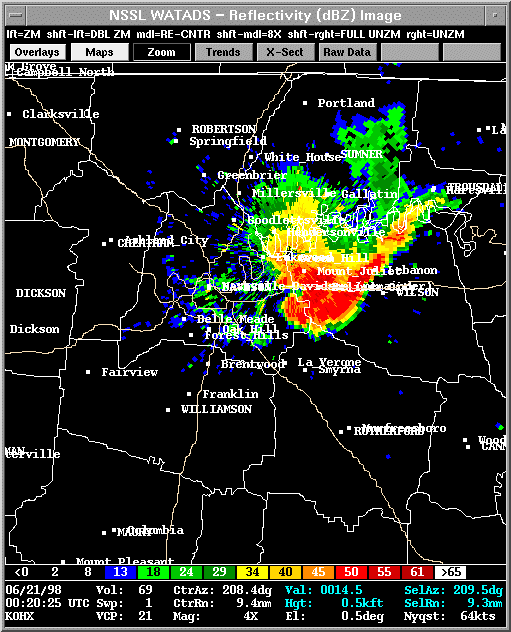
Figure 2g. KOHX WSR-88D 0.5o base reflectivity image taken at 0020 UTC.
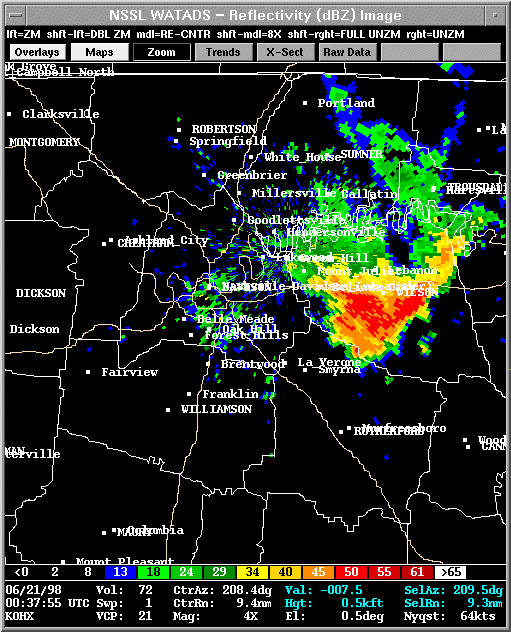
Figure 2h. KOHX WSR-88D 0.5o base reflectivity image taken at 0037 UTC.
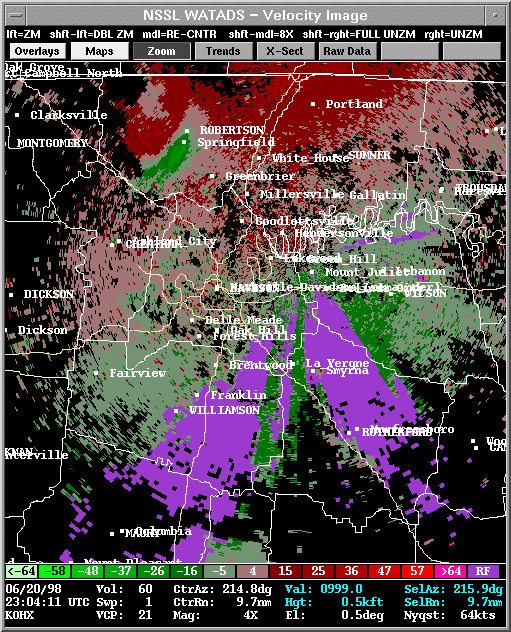
Figure 3a. KOHX WSR-88D 0.5o base velocity image taken at 2304 UTC. Note the region of pure divergence near Springfield, indicative of surface outflow associated with a downburst. Height (AGL) of 0.5o scan at storm location is 2.1 kft.
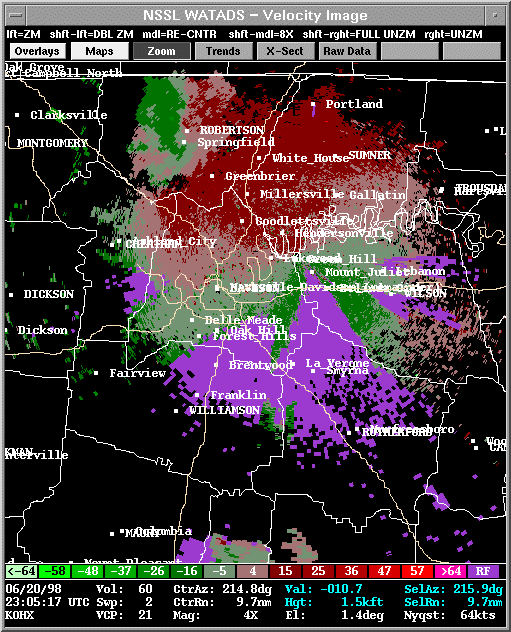
Figure 3b. KOHX WSR-88D 1.5o base velocity image taken at 2304 UTC. Note the region of convergence above the surface outflow shown in the previous slide. Height of 1.5o scan at storm location is 4.4 kft.
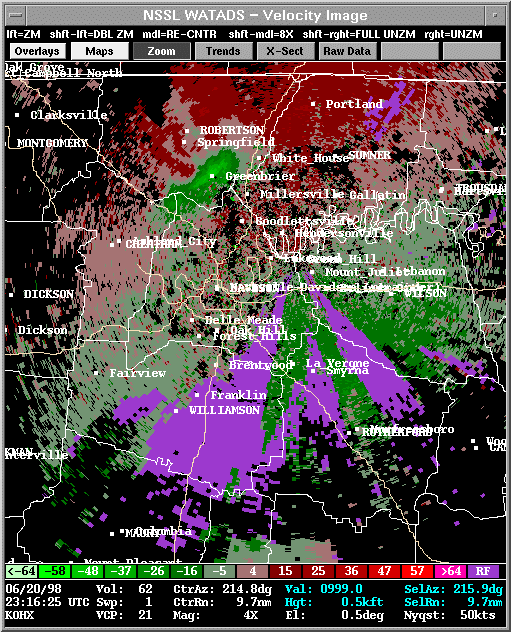
Figure 4a. KOHX WSR-88D 0.5o base velocity image taken at 2316 UTC. Note that the forward (southeastward) propagating region of outflow has strengthened, while the rearward (northwestward) component has weakened. Wind damage was reported in this area (southeast Robertson County) at 2330 UTC, but likely occurred a few minutes earlier. Wind damage was reported at Hendersonville, several miles downstream, a short time later. Height (AGL) of 0.5o scan at storm location is 1.8 kft.
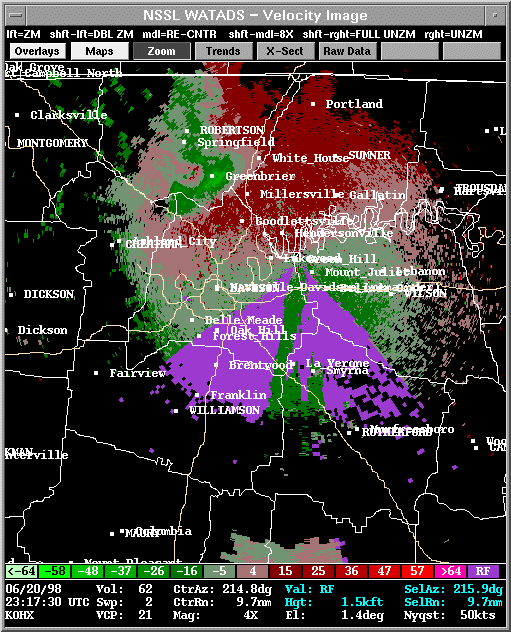
Figure 4b. KOHX WSR-88D 1.5o base velocity image taken at 2317 UTC. Again, note the region of pure convergence, this time much stronger and more concentrated, above the surface gust front. Height of 1.5o scan at storm location is 3.6 kft.
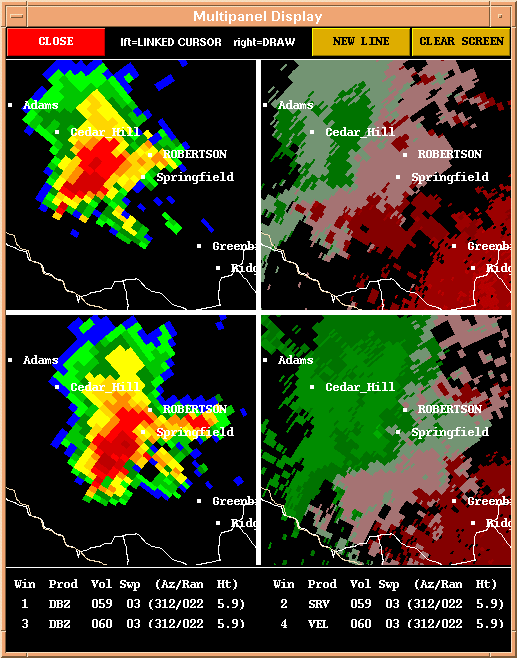
Figure 5a. KOHX WSR-88D 2.4o 4-panel. Panel 1 (upper left) is reflectivity taken at 2258 UTC. Panel 2 (upper right) is storm relative motion at 2258 UTC. Panel 3 (lower left) is reflectivity at 2304 UTC. Panel 4 (lower right) is storm relative motion at 2304 UTC.
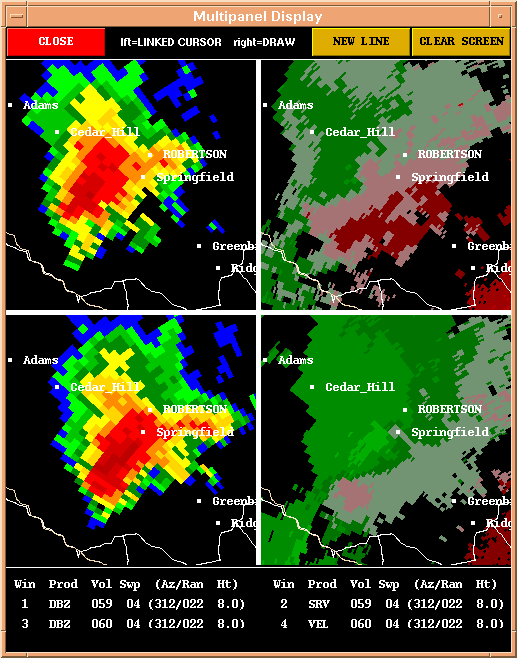
Figure 5b. Same as figure 5a, except for 3.4o.
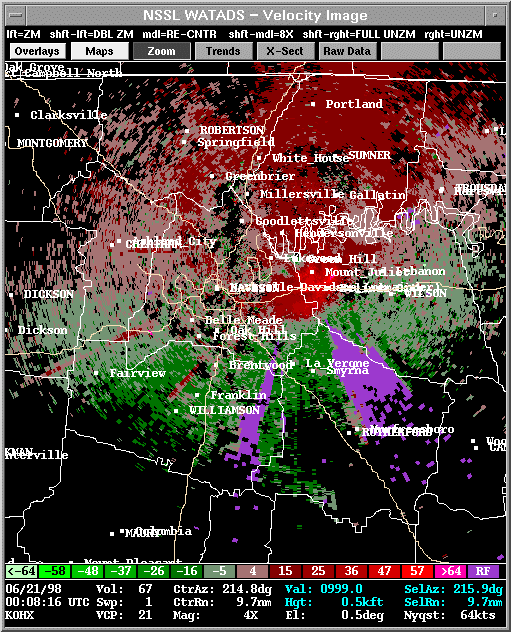
Figure 6. KOHX WSR-88D 0.5o base velocity image taken at 0008 UTC. Note the continuation of the gust front past Mount Juliet (Wilson County). This area was perhaps the hardest hit, with wind damage reported between 0000 UTC and 0020 UTC across western Wilson County. Height (AGL) of 0.5o scan at storm location is 0.9 kft.

