Timothy W. Troutman
NOAA/National Weather Service
Melbourne, FL
Mark A. Rose
NOAA/National Weather Service
Nashville, TN
L. Michael Trapasso
Western Kentucky University
Bowling Green, KY
1. Introduction
During the early morning of 20 April 1996, a line of severe thunderstorms moved across middle Tennessee, causing extensive wind damage. The potential for this type of widespread wind event can be recognized, with early recognition being used to inform the public of impending severe weather. The issuance of a special weather statement (SPS) by the National Weather Service Office in Nashville, TN (OHX) at 2159 UTC 19 April, approximately eight hours in advance of onset of this event, gave local emergency managers, media, spotters, and the public time to prepare.
A derecho is defined by Johns and Hirt (1987) as a widespread convectively induced windstorm that includes a family of downburst clusters produced by an extratropical mesoscale convective system. There are two different types of derechos: progressive and serial. The progressive pattern is characterized by a short, curved squall line oriented nearly perpendicular to the mean wind direction. The serial pattern is characterized by a squall line oriented nearly parallel to the mean wind direction.
Parameters described by Johns and Hirt (1987) have been used on several occasions at OHX in forecasting bow echo potential. Duke and Rogash (1992) have also outlined typical warm season derecho characteristics. The transition season derecho of 20 April is compared to the typical warm season event, and to the Johns/Hirt checklist in order to determine applicability. Use of this checklist, which was derived for long-lived bow echoes occurring from May-August, was considered appropriate. The application of these parameters to model data alerted forecasters at OHX to the possibility of a widespread wind event.
2. Severe Weather Statistics and WSR-88D Perspective Involving Definition of Derecho Type
The 20 April long-lived bow echo event was part of a widespread severe weather outbreak that began during the afternoon of 19 April in eastern Iowa, Illinois, and southeast Missouri. By 0500 UTC 20 April, thunderstorms extended from western Kentucky through northwest Tennessee, Arkansas, and into northeast Texas. These thunderstorms eventually moved into middle Tennessee, and evolved into a bow echo.
This event affected 18 states. Eighty-one tornadoes were reported, along with 265 damaging wind and 311 large hail events, resulting in one death and 133 injuries (Storm Data 1996).
Johns and Hirt (1987) developed criteria used to determine the applicability of the term "derecho" to specific cases. This criteria was further defined in Przybylinski's (1995) study.
1) There must be an area of concentrated reports of convectively induced wind damage or wind gusts of at least 50 knots. This area must have a major axis length of at least 400 km (~250 nm).
2) Severe weather reports must show either a pattern of chronological progression as a singular swath (progressive) or as a series of swaths (serial).
3) In the damage area, there must be at least three reports separated by at least 64 km (40 nm) of either F1 damage (Fujita 1971) and/or convective gusts of at least 65 knots.
4) No more than three hours can elapse between successive wind events.
In middle Tennessee, the bow echo of 20 April caused widespread wind and hail damage, minor flash flooding, and two tornadoes (F0 and F2), which occurred along the leading edge. WSR-88D imagery and storm data reports from the event revealed the four main criteria listed above were met.
Initially, the WSR-88D image from 0822 UTC 20 April (Fig. 1) indicated an acceleration of the line of thunderstorms, especially along the southern portion of the line. Przybylinski and DeCaire (1985) identified four types of echo patterns associated with reflectivity signatures involving bow echoes occurring during the late spring and early summer. Analysis of the echo patterns associated with this bowing line segment appears to fit the definition of the type 1 pattern.
By 1002 UTC (Fig. 2), the line of storms had moved through the metropolitan Nashville area with scattered reports of wind damage along the northern portion of the line. The southwest edge of the bowing line segment had rapidly decreased in intensity and size.
By 1100 UTC (not shown), the southwest portion of the line indicated rapid re-development. The WSR-88D base reflectivity image for 1217 UTC (Fig. 3) shows at least two weak echo channels as the line segment continued to accelerate, with each bowing line segment up 100 km long and associated with a weak meso-circulation near the comma head. The strong low-level reflectivity gradient along the leading edge of the bowing segment signified the location of the updraft center.
Numerous rear inflow notches (RIN) were located along several trailing edges of the bowing line segment, indicating that a region of evaporatively cooled and lower theta-e air was being channeled toward the leading edge of the bowing line segment (Przybylinski and Schmocker 1993). The RIN's supported Przybylinski's (1995) evidence that a strong low-level reflectivity gradient along the leading edge often signifies the location where damaging downburst winds are occurring. Indeed, areas where RIN's were present did report damaging winds in excess of 65 knots (Storm Data 1996).
An F2 tornado also occurred along the bowing line segment. Studies by Wakimoto (1983) and Przybylinski (1988) have shown that in strong dynamic environments, bow echoes embedded within a larger squall line can produce significant wind damage and tornadoes. As in the cases described by Johns (1993), the 20 April event provided an excellent example of a tornado-producing circulation being located within the comma-head portion of the bow (Moller et al. 1990; Przybylinski et al. 1993). Przybylinski (1995) noted that tornadoes to F4 intensity have occurred within comma-head features along extensive, destructive bow echo line segments (Wakimoto 1983; Przybylinski 1988; Smith and Partacz 1985).
The 1402 UTC base reflectivity image (Fig. 4) showed further development of RIN's within the bowing line segment. The bow echo continued its forward movement through southern middle Tennessee, producing widespread wind damage across middle and east Tennessee and into south central North Carolina (Storm Data 1996). The four criteria initially developed by Johns and Hirt (1987) to identify derechos were met by the 20 April event. The path of this transition season derecho exceeded 400 miles in length from initial development around 1000 UTC 20 April to the last report of wind damage around 2100 UTC. The severe weather reports exhibited a non-random pattern of occurrence with the damage resulting in a series of swaths, which would classify this derecho as "serial," and associated with a "dynamic" pattern as termed by Johns (1993). This serial definition is further supported by the bow echo movement of 30 knots or less in a direction nearly perpendicular to the mean wind. The amount and consistency of damaging wind reports during the long-lived bow echo's life (77) during the 11-hour time period on 20 April satisfied the other two derecho criteria.
3. Environment of 20 April 1996
The following parameters were based on 12-hour forecasts by the 0000 UTC 20 April Eta model, which was chosen for this study because it best depicted the placement of surface features.
A strong surface cold front was forecast to move east through the lower Ohio and Tennessee Valleys by the morning of 20 April. During the previous evening, the cold front moved through Missouri and Arkansas, and was nearly parallel to the 240o flow at 500 millibars (mb). Derecho development was closely associated with warm advection. Johns et al. (1990) confirmed that low-level warm advection is generally associated with derecho genesis. The Eta model forecast warm advection at both 850 and 700 mb, particularly over eastern middle Tennessee, where the bow echo eventually reached its greatest intensity.
Johns (1993) identified weak dynamic versus strong dynamic widespread damaging windstorms. Duke and Rogash (1992) also identified the dynamic derecho pattern by a vigorous mid-level trough and associated cold front. Because this bow echo was associated with a vigorous mid-level trough and strong surface cold front, it can be classified as having a "dynamic" pattern. Johns (1993) defined the dynamic pattern as "typically associated with a strong, migrating low pressure system and has many characteristics of the 'classic' great plains tornado outbreak pattern." Johns (1990) and Duke and Rogash (1992) further suggested that the low-level jet in a dynamic pattern is usually more parallel to the mid- and upper-level jets.
The estimated lower mid-tropospheric wind speed (ELWS) derived from the 12-hour forecast was 45 knots. Johns (1984) and Johns and Hirt (1987) defined the lower mid-troposphere as that layer which exists between approximately 8 kilofeet (kft) and 18 kft. A simple method for estimating the wind speed (or relative humidity) within this layer is to average the wind speeds (or relative humidities) at 700 and 500 mb. The 12-hour forecast estimated lower mid-tropospheric relative humidity (ELRH) was less than 70 percent, suggesting widespread mid-level dry air intrusion. Between 0000 UTC and 1200 UTC, a 500 mb height fall of 20 meters was forecast.
Because of changes in surface conditions due to warm air and moisture advection, the 0000 UTC sounding at OHX was modified at 0800 UTC. The sounding modification yielded a very unstable atmosphere. The lifted index (LI) had decreased from -5 to -6, and the convective available potential energy (CAPE) had increased from 1060 J kg-1 to 1516 J kg-1. The Bulk-Richardson number (BRN) had also increased from 13 to 32.
The wind field was modified using the WSR-88D Velocity Azimuth Display Wind Profile (VWP) from 0800 UTC, some 40 minutes before the leading edge of the bow echo reached the radar site. The modified hodograph indicated 70o of directional wind shear within the lowest 2500 meters, and exhibited a sharp right curve, which indicates veering of the shear vector (Doswell 1991a; Johns and Doswell 1992).
CAPE values and significant speed, and, less importantly, vertical wind shear in the low-levels also favor long-lived or steady-state squall line thunderstorms (Weisman and Klemp 1984). Quantitative directional shear values exhibited positive shear of 14.6 in the 0-2 km layer, and 8.2 in the 0-3 km layer. The total shear in the 0-3 km layer was 0.0094 s-1, and 0.0058 s-1 in the 0-6 km layer. The 0-2 km storm relative helicity (SRH) was 373 m2s-2, and 389 m2s-2 in the 0-3 km layer. The 0-6 km SRH was 218 m2s-2. Davies-Jones et al. (1990) found that most strong and violent tornadoes are associated with 0-3 km SRH's greater than 300 m2s-2.
4. The Johns/Hirt Method of Derecho Identification and Peculiarities of Transition Season Derechos
Johns and Hirt (1987) outlined a methodology which may be used to identify environments conducive to derecho genesis. The methodology is outlined below and was applied to the 0000 UTC 20 April 12-hour Eta forecast conditions across middle Tennessee. Answers particular to the forecast environmental conditions at 1200 UTC 20 April are in parentheses.
Part A). If the following five conditions exist within the area of interest, proceed to Part B. Otherwise, derecho development is unlikely.
1) Is the 500 mb flow from 240o or greater? (Yes);
2) Does a quasi-stationary surface boundary exist nearly parallel to the 500 mb flow? (No);
3) Is there warm advection at 850 mb within 200 nm? (Yes);
4) Is there warm advection at 700 mb within 200 nm? (Yes);
5) Are the ELWS at least 25 knots? (Yes).
Part B). If the following three conditions exist within the area of interest, proceed to Part C. Otherwise, proceed to Part D.
1) Are the maximum 500 mb height falls at least 60 meters (or at least 50 meters at 0000 UTC)? (No);
2) Are the SPC LI's -6 or lower? (Yes);
3) Is the ELRH less than 80%? (Yes).
Part C). If the following two conditions exist within the area of interest, proceed to Part D. Otherwise, derecho development is unlikely.
1) Are the SPC LI's -8 or lower? (Yes);
2) Is the ELRH less than 70%? (Yes).
Part D). Do the values satisfying the criteria for LI's and ELWS exist downwind along the quasi-stationary boundary for a distance of at least 250 nm? (Yes) If yes, then conditions are favorable for derecho genesis.
In addition to the methods discussed above, Duke and Rogash (1992) have outlined several characteristics of warm-season derecho-producing environments to which the 20 April environment has been compared. Although a few of the parameters between the 20 April environment and the typical warm-season derecho-producing environment differ, a majority of the parameters do agree. Therefore, the Johns/Hirt method of derecho identification largely agrees with the parameters listed by Duke and Rogash. This shows that both the Johns/Hirt and Duke/Rogash parameters can be used with some accuracy when identifying the potential of a long-lived bow echo event during the transition season. The data for the 20 April environment were derived from a combination of sources, specifically area surface and upper air observations, the 0000 UTC 20 April OHX sounding, and the 0000 UTC Eta model. Typical warm season environmental characteristics are listed below. Characteristics particular to the 20 April environment are listed in parentheses.
1). Surface characteristics include an east-west oriented front with highest moisture pooled along and south of the boundary with the maximum located near the midpoint of the derecho track. Winds are typically light and from the south or southwest, and theta-e values are greater than 360K along much of the derecho path. (There was a strong surface cold front, southwest-to-northeast, with relative humidities greater than 80% surrounding the derecho genesis region. Surface winds were south to southwest at 15-20 knots, and theta-e values were greater than 330K with a ridge along the genesis region.)
2). At 850 mb, moisture is normally pooled along the derecho track with highest values near the midpoint. Warm advection is also greatest over the genesis region with weaker advection east along the derecho track. (Moisture was pooled along the genesis region with greatest values southwest of the derecho track. Warm advection was greatest east along the track with weaker advection over the genesis region.)
3). At 700 mb, T-Td=14oC at midpoint, with warm advection the greatest over the genesis area and weaker advection east along the track. (T-Td= 15oC at OHX, with greatest warm advection east along the track and weaker advection over the genesis region.)
4). At 500 mb, the approaching trough is typically weak, with little moisture, T-Td=22oC at midpoint. Temperatures are normally -10oC, with wind speeds 21 m s-1. (The approaching trough was strong, with little moisture, T-Td=19oC at OHX. Temperatures were -14oC, with wind speeds 25 m s-1.)
5). Dynamical characteristics include Convective Available Potential Energy (CAPE) of 2400 J kg-1 over the genesis area, and 4500 J kg-1 at the midpoint. Level of free convection slopes downward from the genesis region toward the midpoint. The Bulk-Richardson number (BRN) indicates support for bow echo formation. (CAPE was 2640 J kg-1 at OHX. Level of free convection was sloped downward from west of the genesis region to the midpoint. The BRN indicated support for bow echo formation.)
6). Bow echo movement is typically along the 850/700 mb thermal gradients, toward the thermal ridge. (Movement was along the 850/700 mb thermal gradients, toward the thermal ridge.)
5. Conclusions
Although the 20 April 1996 derecho was classified as "dynamic," and was not necessarily typical of warm-season derechos with every respect, the characteristics of the environment in which it formed correlated well with parameters suggested by Johns and Hirt (1987). These parameters, analyzed before bow echo formation, alerted forecasters at OHX to the possibility of severe weather. The issuance of an SPS gave local emergency managers, media, spotters, and residents up to eight hours to prepare for the event. The use of the Johns/Hirt parameters served as a good first indicator when analyzing derecho potential. Once the first determination is made, forecasters should then examine the wind field and instability parameters to determine the possible storm type. Derechos in middle Tennessee are rare (about one per year), and can by no means be forecast with a high degree of accuracy. The environments which are particular to their formation can be recognized and the potential for a long-lived damaging wind event can be identified several hours in advance.
6. References
Davies-Jones, R., D. Burgess, and M. Foster, 1990: Test of helicity as a tornado forecast parameter. Preprints, 16th Conf. on Severe Local Storms, Kananaskis Park, Alberta, Canada, Amer. Meteor. Soc., 588-592.
Doswell, C., 1991a: A review for forecasters on the applications of hodographs to forecasting severe thunderstorms. Natl. Wea. Dig., 16, 1, 2-16.
Duke, J., and J. Rogash, 1992: Multiscale review of the development and early evolution of the 9 April 1991 derecho. Wea. Forecasting., 7, 623-635.
Fujita, T., 1971: Proposed characterization of tornadoes and hurricanes by area and intensity. SMRP Research Paper No. 91, Department of Geophysical Sciences, University of Chicago, 42 pp. [Available from the Department of Geophysical Sciences, University of Chicago, Chicago, IL 60637].
Johns, R., 1984: A synoptic climatology of northwest flow severe weather outbreaks. Part II: Meteorological parameters and synoptic patterns. Mon. Wea. Rev., 112, 449-464.
__________, and W. Hirt, 1987: Derecho's: Widespread convectively induced windstorms. Wea. Forecasting., 2, 32-49.
__________, K. Howard, and R. Maddox, 1990: Conditions associated with long-lived derecho's- an examination of the large-scale environment. Preprints, 16th Conf. on Severe Local Storms, Alberta, CN, Amer. Meteor. Soc., 408-413.
__________, and C. Doswell, 1992: Severe local storms forecasting. Wea. Forecasting, 2, 32-49.
__________, 1993: NOTES AND CORRESPONDENCE: Meteorological conditions associated with bow echo development in convective storms. Wea. Forecasting., 8, 294-299.
Moller, A., C. Doswell, and R. Przybylinski, 1990: High precipitation supercells: A conceptual model and documentation. Preprints, 16th Conf. on Severe Local Storms, Kananaskis Park, Alberta, Canada, Amer. Meteor. Soc., 52-57.
National Oceanic and Atmospheric Administration, 1996: Storm Data, 38, No. 4, National Climatic Data Center, Asheville, NC.
Przybylinski, R. and D. DeCaire, 1985: Radar signatures associated with the derecho, a type of mesoscale convective system. Preprints, 14th Conf. on Severe Local Storms, Indianapolis, IN, Amer. Meteor. Soc., 228-231.
__________, 1988: Radar signatures associated with the 10 March 1986 tornado outbreak over central Indiana. Preprints, 15th Conf. on Severe Local Storms, Baltimore, MD, Amer. Meteor. Soc., 253-256.
Przybylinski, R.W., J.T. Snow, E.M. Agee, and J.T. Curran, 1993: The use of volumetric radar data to identify supercells: A case study of June 2, 1990. In Proceedings, Tornado Symposium III. (C. Church, ed.) Amer. Geophys. Union.
__________, J. Snow, E. Agree, and J. Curran, 1993: The use of volumetric radar data to identify supercells. A case study of June 2, 1990. The tornado: Its structure, dynamics, prediction, and hazards. Geophys. Monogr., No. 79, Amer. Geophys. Union, 241-250.
__________, 1995: The bow echo: Observations, numerical simulations, and severe weather detection methods. Wea. Forecasting, 10, 203-218.
Smith, B., and J. Partacz, 1985: Bow echo induced tornado at Minneapolis on 26 April 1984. Preprints, 14th Conf. Severe Local Storms, Indianapolis, IN, Amer. Meteor. Soc., 81-84.
Wakimoto, R., 1983: The West Bend Wisconsin storm of 4 April 1981. A problem in operational meteorology. Mon. Wea. Rev., 111, 181-189.
Weisman, M., and J. Klemp, 1984: The structure and classification of numerically simulated convective storms in a directionally varying wind shear. Mon. Wea. Rev., 112, 2479-2498.
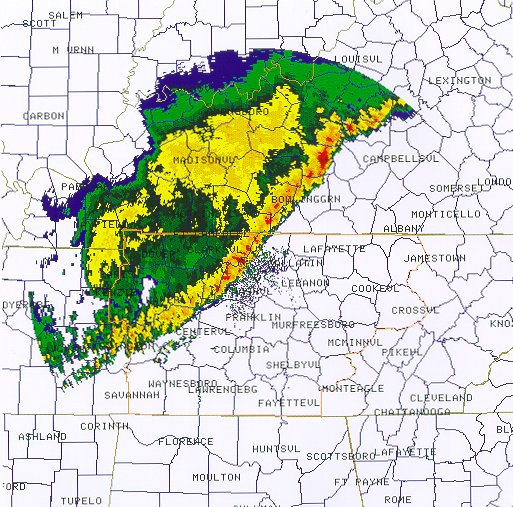
Figure 1
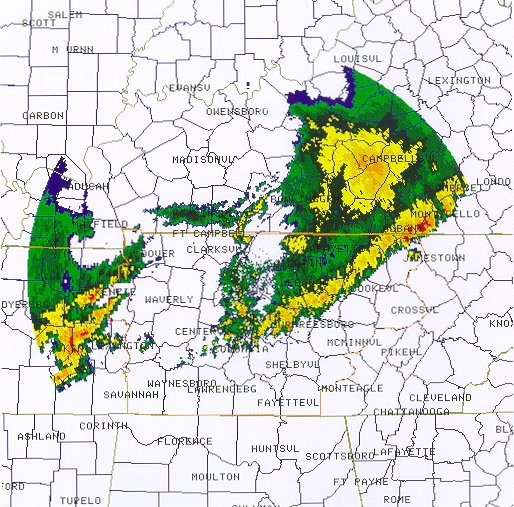
Figure 2
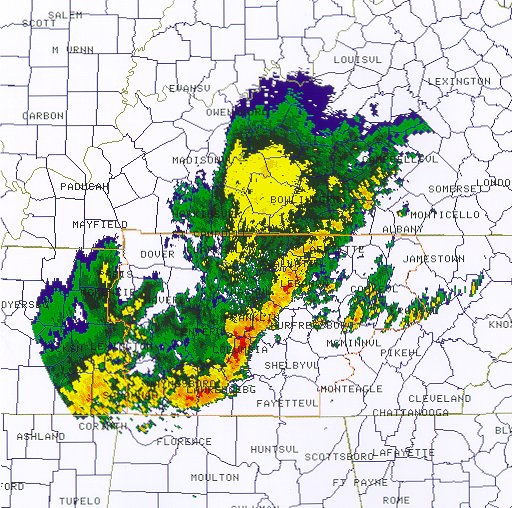
Figure 3
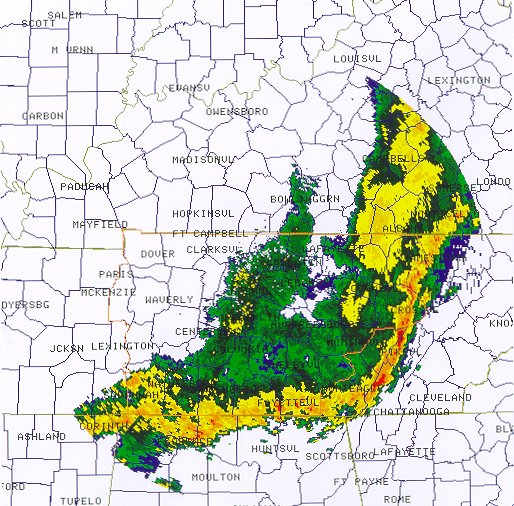
Figure 4

