Overview of NOAA’s Great Lakes Ice Products
Each winter, ice forms on the Great Lakes, typically beginning in the northern bays of Lake Superior in late November. Several NOAA offices produce seasonal Great Lakes ice products. As part of the National Weather Service’s (NWS) contribution to the tri-agency U.S. National Ice Center (USNIC), the Ice Services Branch of the Ocean Prediction Center produces outlooks; tailored environmental products for various government agencies, including the U.S. Coast Guard; and a daily analysis of ice conditions across the Lakes. The NWS Weather Forecast Office in Cleveland, OH produces ice freeze-up and break-out outlooks and weekly ice forecasts throughout the winter. The Great Lakes Environmental Research Laboratory supports Great Lakes research and model development, monitors the longer-term trends in ice coverage across the region, and maintains an archive of Great Lakes ice information.
Ice coverage has significant impacts on commercial shipping, research, and recreation across the Great Lakes. The U.S. and Canadian Coast Guards work with commercial vessels to ensure continued transport of goods across the region. Accurate, timely ice information is needed for planning and is essential for safe navigation when ice is present. Years with higher than normal ice coverage can lead to a reduction of millions of tons of cargo moved across the Lakes during winter and spring.1 Additionally, NOAA’s Great Lakes ice products are used by researchers working in the field or studying ice cover variability.
Drivers of Ice Cover Variability
Ice coverage on the Great Lakes is highly variable year to year, with maximum ice coverage ranging from 95% to 12%.
 |
|
Figure 1: Great Lakes maximum ice coverage from 1973 to 2024 |
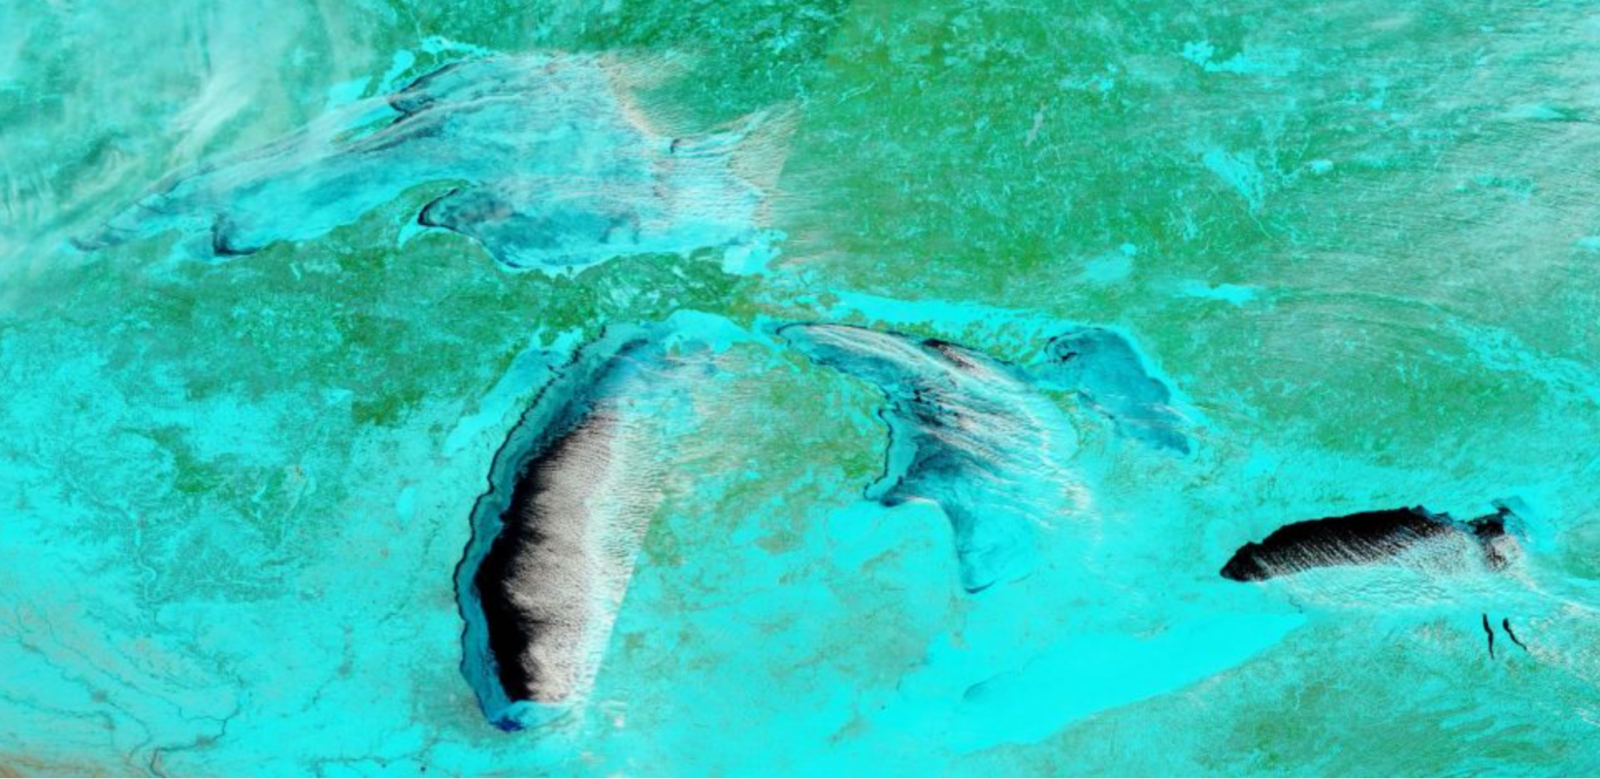
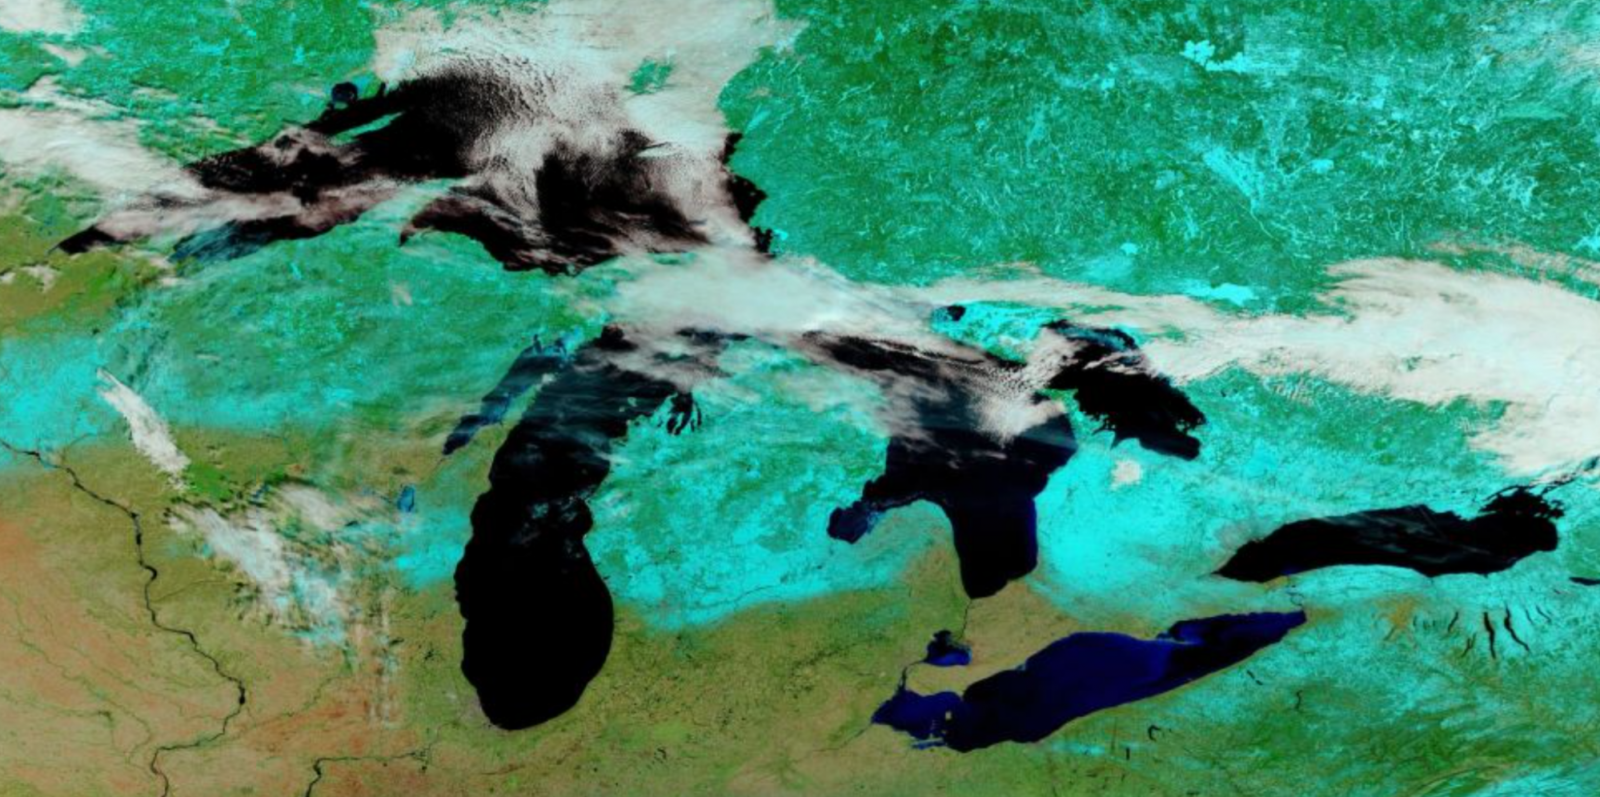
This variability is driven by large-scale climate patterns, which affect the position of the jet stream. The positioning of the jet stream largely dictates the source (and temperature) of air masses that move over the Great Lakes region. The satellite images below show the difference between above- and below-average ice seasons. Snow and ice appears blue, clouds appear white, and water appears black in this satellite imagery.
 |
 |
| Figure 2: MODIS satellite imagery of the Great Lakes during a year with above average ice cover (Feb. 23, 2015, left) and below average ice cover (Feb. 20, 2024, right). Source: NASA Worldview | |
2023-24 Season Overview
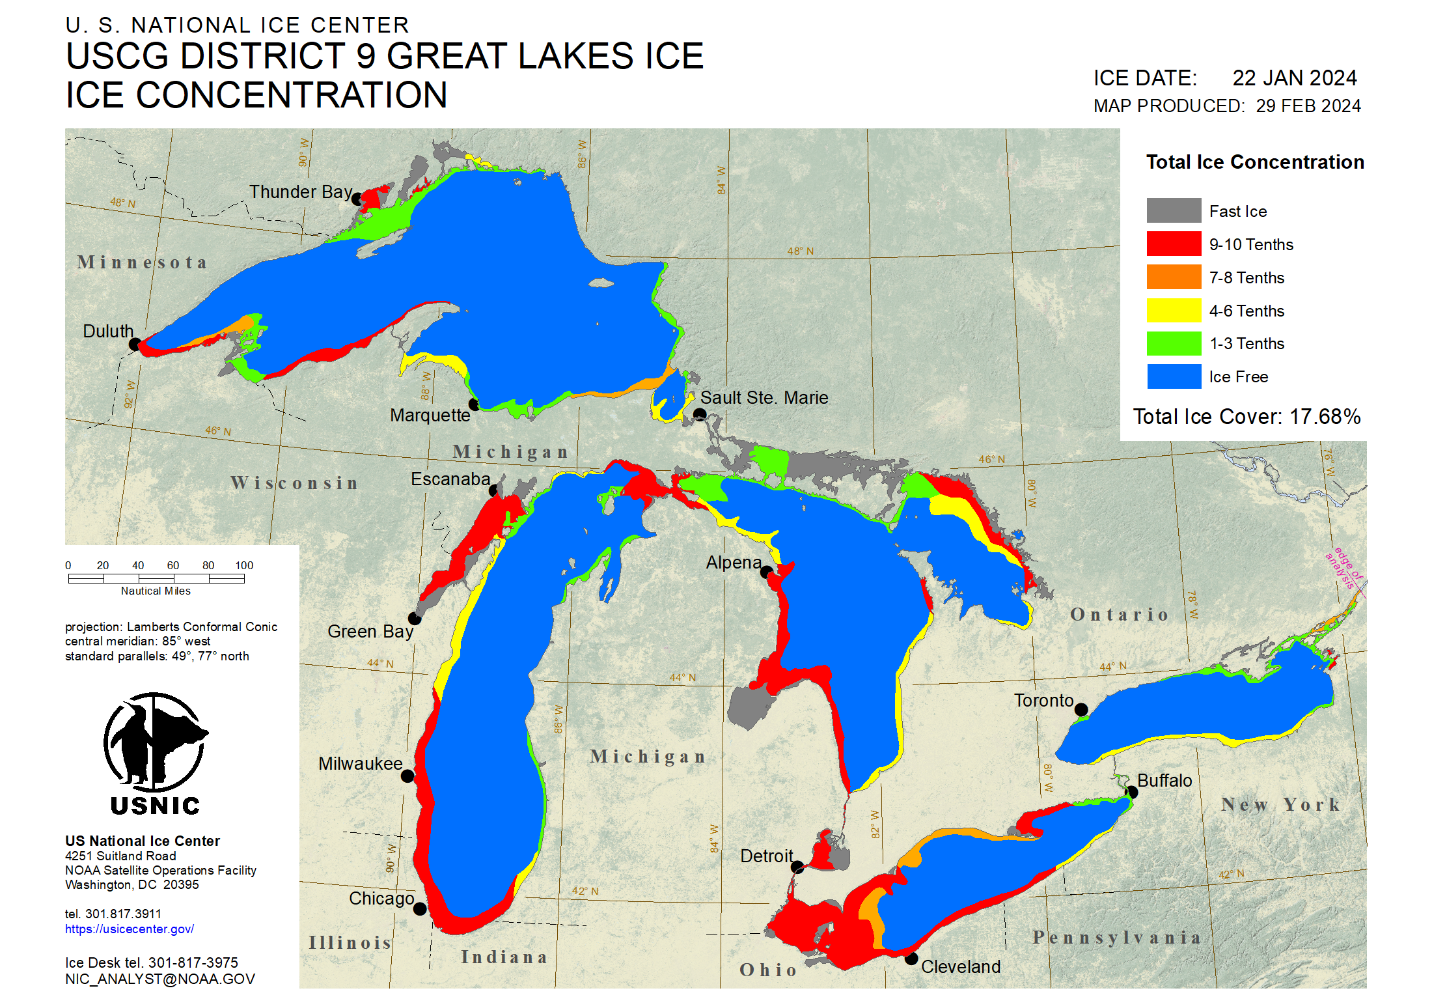
Winter 2023-24 was abnormally warm over the Great Lakes region, which led to extremely low ice coverage across the five Lakes. The maximum ice extent of 17.68% (Figure 3) occurred on January 22, which was both significantly lower than average and occurred approximately one month earlier than normal.2 Since 1973, the date of maximum ice coverage has occurred in January on only three occasions: January 22, 2024, January 22, 2012, and January 15, 1999. Additionally, seasonal average ice cover for winter 2023-24 was the lowest on record. Great Lakes ice coverage was calculated from the USNIC’s analysis of ice conditions across the five Lakes. USNIC analysts utilize GIS software to create daily ice charts using a variety of satellite imagery sources, in-situ observations, and model data.
 |
| Figure 3: Great Lakes ice coverage on January 22, 2024, as analyzed by the U.S. National Ice Center |
Impacts of Low Ice Coverage During Winter 2023-24
The abnormally low coverage impacted many groups operating in the region. The National Parks Service conducts a survey of wolf and moose populations on Isle Royale in Lake Superior every winter. However, the 2024 survey was abandoned due to a lack of thick, stable shore-fastened ice needed to land ski planes.3 This was the first time the project had been abandoned in decades.
In contrast, the low ice cover is a benefit for commercial shipping, as the lack of ice means waterways are open for longer periods of time without needing the assistance of icebreakers. Typically, the Soo locks at Sault Ste. Marie close on January 15 and reopen on March 25. In 2024, low ice coverage allowed the locks to reopen early, and the Great Lakes commercial fleet was able to get a head start on the 2024 shipping season hauling iron ore, grain, salt, concrete, and other key resources for the U.S. economy.4
The timing of ice formation also impacts buoys on the Great Lakes. The USCG removes buoys from the Great Lakes annually to prevent damage due to icing. In warmer winters, buoys can remain out on the Lakes longer. In 2023, the buoys remained out until late November and early December, providing additional data to mariners and supporting safety of life at sea.
References