
Moderate to heavy rain with a flooding risk will continue for northern and central California, with heavy mountain snow in the Sierras, southern Cascades, and northern Rockies through Friday. A series of winter storms will track from the Upper Midwest to off the Northeast U.S. coast into next week bringing rounds of moderate to locally heavy rain south of their track and ice and snow to the north. Read More >
U.S. Senator Jerry Moran (R-Kansas), a member of the Senate Committee on Commerce, Science, and Transportation, visited the Aviation Weather Center November 26. Robert Maxson, Director of the Aviation Weather center, led a tour of the facility. Jesse Sparks, Lead Forecaster, provided a briefing of the Forecast Operations. The tour included a visit to the Aviation Services Branch Testbed where the Senator was able to meet several of the research and development meteorologists.
Senator Moran serves as chairman of the Appropriations Subcommittee on Commerce, Justice, Science, and Related Agencies. This allows him to lead the funding decisions that impact several agencies including the Department of Commerce. Senator Moran has cosponsored legislation to ensure that there are enough air traffic controllers to accommodate the increasing staffing needs at FAA air traffic control facilities and at the 256 airports that participate in the FAA’s Contract Tower Program. The legislation allows controllers who retire from federal service to work as controllers at smaller contract tower airports without their federal annuity supplement being reduced or eliminated entirely.
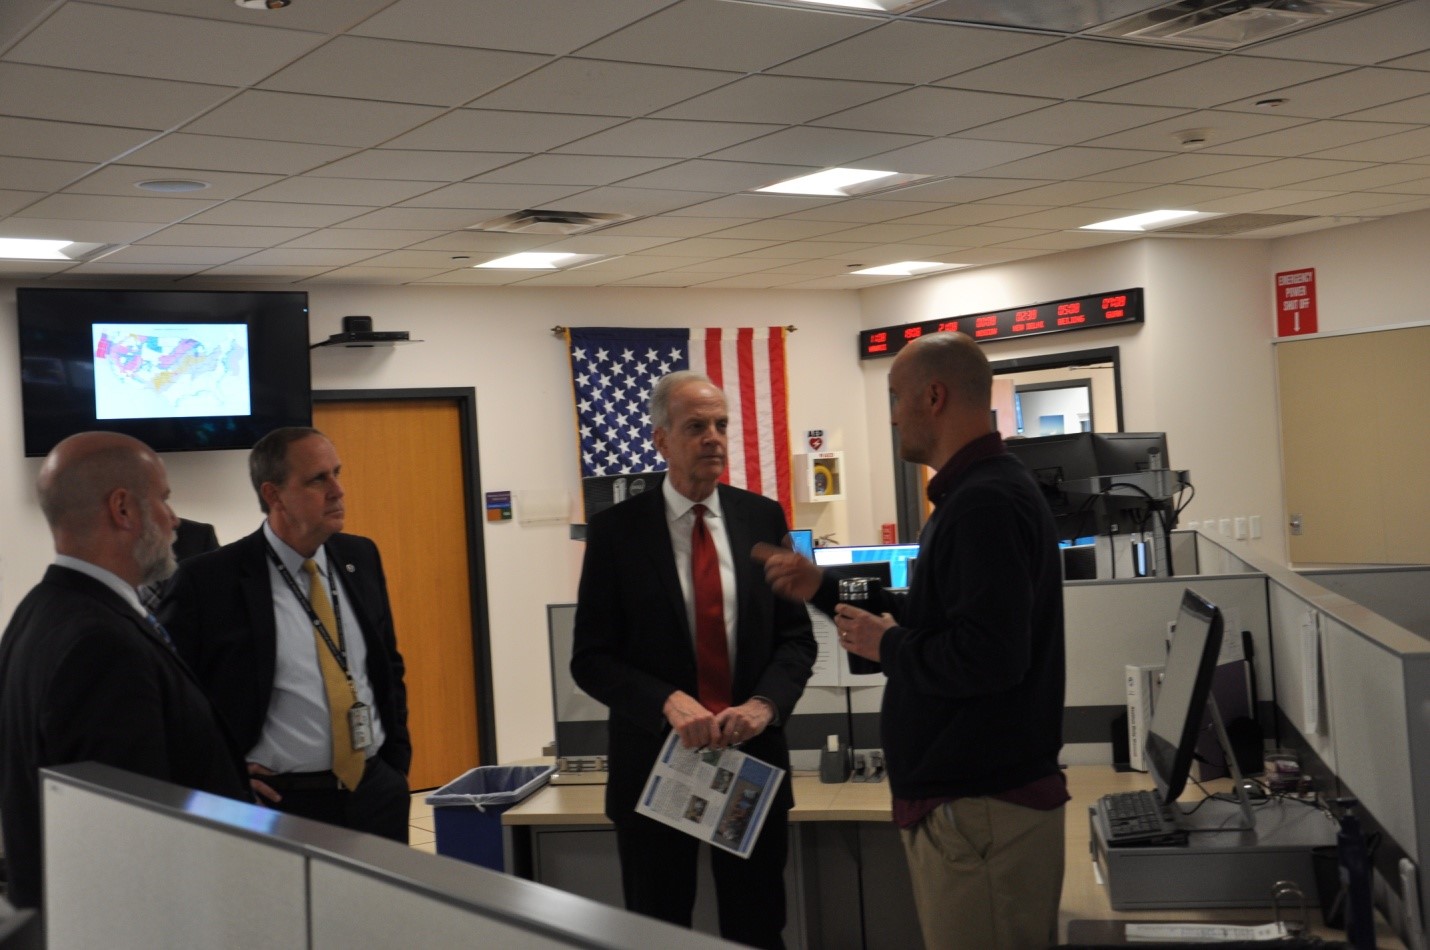
Left to right: Matt Strahan (International Operations Branch Chief, AWC), Robert Maxson (Director Aviation Weather Center), Senator Jerry Moran(R-Kansas), and Jesse Sparks (Lead Meteorologist Aviation Weather Center)
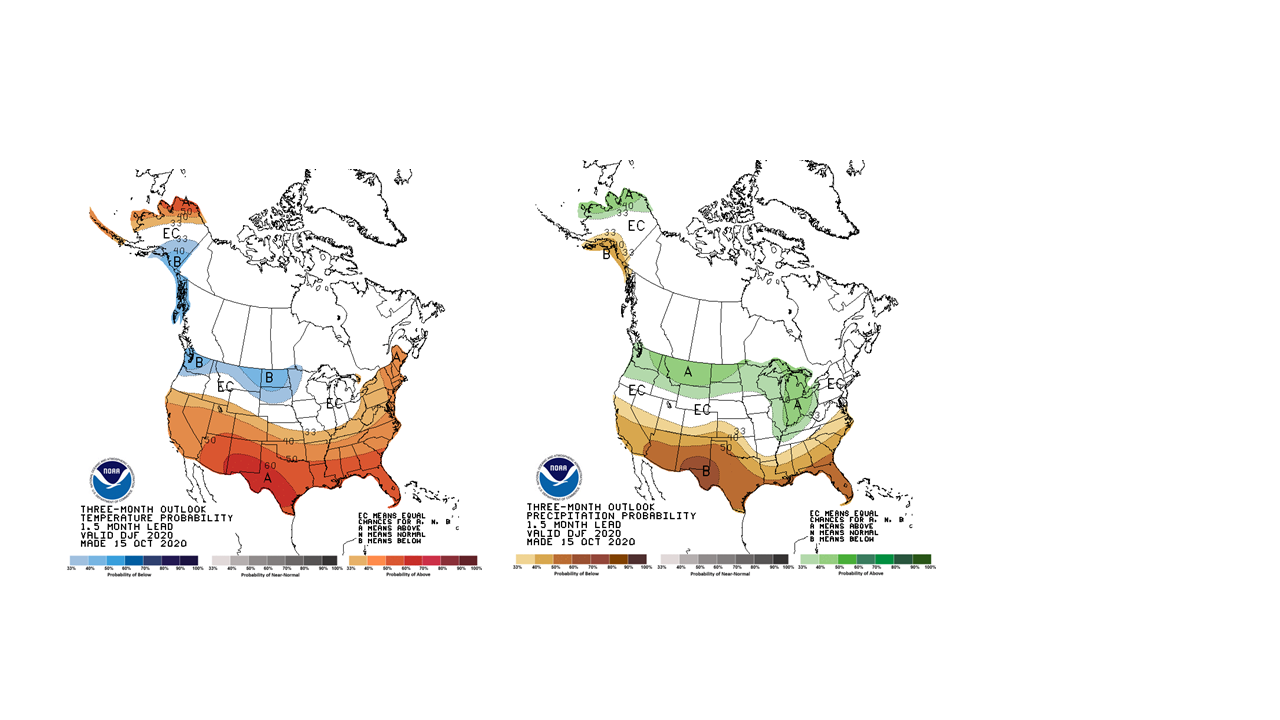
The Climate Prediction Center issued the Winter Outlook for December 2019 – February 2020 via a press teleconference and press release on October 17, 2019. The temperature outlook favors a warmer-than-normal winter over Alaska, Hawaii, and large parts of the remaining lower 48 from the West across the South and up the eastern seaboard. No part of the U.S. is favored to have below-average temperatures this winter, with the northern Plains, Upper Mississippi Valley, and the western Great Lakes having equal chances of below-, near-, or above-average temperatures. Although below-average temperatures are not favored, cold weather is still likely and some areas could experience a colder-than-average winter.
The winter precipitation outlook favors wetter-than-average conditions in Alaska and Hawaii, along with portions of the Northern Plains, Upper Mississippi Valley, the Great Lakes and parts of the Mid-Atlantic and Northeast. Drier-than-average conditions are most likely for Louisiana, parts of Texas, Mississippi, Arkansas and Oklahoma as well areas of northern and central California.
Abnormally dry conditions were present across much of the Southern U.S. at the start of the winter, with the areas of most severe drought observed in the Four Corners region of the Southwest, central Texas and parts of the Southeast. Drought is expected to improve in portions of the Southeast, Mid-Atlantic, Alaska and Hawaii, while persisting in central Texas and the Southwest and developing in parts of central California.
The press release with a link to a winter outlook video can be found here:
https://www.noaa.gov/media-release/winter-outlook-warmer-than-average-for-many-wetter-in-north
December 2019 – February 2020 Outlooks for temperature (left) and precipitation (right).
On December 16, 2019, NCEP Central Operations (NCO) implemented a new application, SPADES, onto the Integrated Dissemination Program (IDP) systems housed in data centers in College Park, MD and Boulder, CO. Implementation onto IDP means that an application is run on a robust, centralized computing system with 24x7 monitoring and support that enables the application to meet the requirements of the NWS customers and partners.
SPADES, the Satellite Product Analysis and Distribution Enterprise System, acquires Level 1B space weather products in real time from the GOES-16 satellite and processes this data to produce Level 2 space weather products in NetCDF and FITS format. These products are then delivered by IDP to the NWS’ Space Weather Prediction Center (SWPC) for use in their forecast operations. The products can also be shared with other partners as appropriate. An upcoming upgrade of SPADES will add processing of output from the GOES-17 satellite as well.
The path to implementation for SPADES followed NCO’s rigorous IDP onboarding process. This months-long effort includes working closely with developers from SWPC and NOAA NCEI’s National Geophysical Data Center (NGDC) to ensure the application adhered to NCO’s coding standards and could be integrated into the larger IDP environment. Staff of NCO’s Implementation and Data Services Branch set up all necessary infrastructure and data pathways, and the Onboarding Team installed the code and conducted functionality and IT stability tests. They also coordinated with the developers and SWPC to ensure the output data was correct. All of this work resulted in the successful initial implementation of SPADES in December.
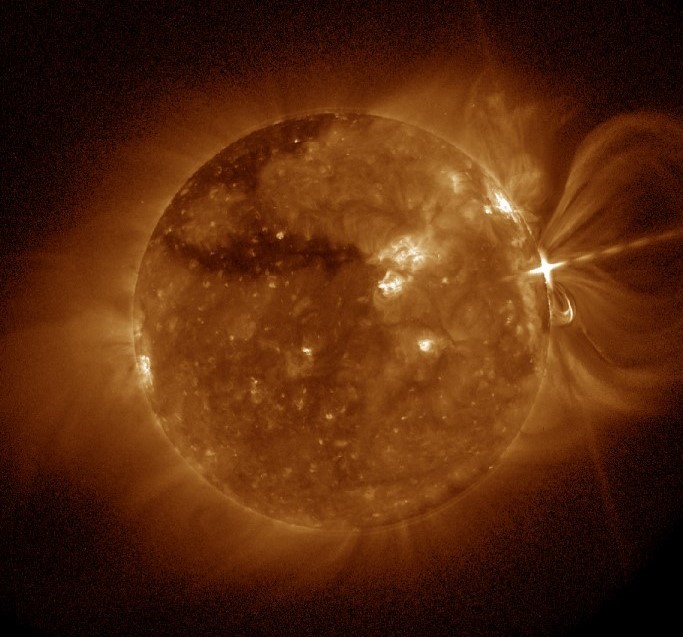
Image of the sun as shown by GOES-16-based SUVI imagery Photo credit Seaton & Darnell, 2018.
NHC Director Ken Graham traveled to the other side of the globe in October, representing NOAA at the 30th anniversary celebration of the Regional Specialized Meteorological Center (RSMC) in Tokyo, Japan.
Regional Specialized Meteorological Centers are established by the World Meteorological Organization (WMO). There are seven such centers worldwide, including the National Hurricane Center in Miami, Fla. In 1988, the WMO assigned the Japan Meteorological Agency as an RSMC for the Northwestern Pacific. The next year, the RSMC Tokyo-Typhoon Center was established within the headquarters office. It’s responsible for the forecasting and dissemination of tropical in the Northwest Pacific region, which includes the Celebes Sea, the Sulu Sea, the South China Sea, the East China Sea, the Yellow Sea, the Sea of Japan and the Sea of Okhotsk.
.jpg)
Director Ken Graham presents a plaque on behalf of NHC to Itara Kaga, Deputy Director of the Japan Meteorological Agency, during a ceremony in Tokyo, Japan, on October 10, 2019. Photo credit: NOAA Communications​
The ink is barely dry on the 2019 hurricane season, but planning and preparation is already underway for the 2020 season. It begins with the annual NOAA Hurricane Conference, hosted in Miami by the National Hurricane Center on December 3-6. The 4-day meetings included representatives of several branches of the National Weather Service at the national and regional levels, both on-site and via go-to-meeting. Among the many items on the agenda, attendees discussed experiments and potential tropical product and service changes in 2020, and feedback from external partners.
.jpg)
The annual NOAA Hurricane Conference at NHC in Miami, Fla. December 3, 2019. Photo credit: NOAA Communications
Commencement of Space Weather Services within ICAO
Regulated services for space weather under the International Civil Aviation Organization (ICAO) commenced on 7 November 2019. This impact-based space weather advisory service is implemented by a joint operation of three global SWX centers: the NOAA Space Weather Prediction Center, PECASUS consortium, and ACFJ consortium, with each center providing the service for 2 weeks in turn. PECASUS is led by the Finnish Meteorological Institute and is comprised of ICAO member states Finland, Belgium, United Kingdom, Austria, Germany, Italy, Netherlands, Poland, Cyprus, and South Africa. ACFJ is comprised of ICAO member states Australia, Canada, Japan, and France. In this service model, one center is always on duty while the two other centers are providing back-up service. These services cover likely space weather impacts to high-frequency communications, satellite communications, navigation, and radiation exposure for passengers and crew. The ICAO press release provides additional information on these services.

Image Credit: NASA
The Weather Prediction Center (WPC) recently debuted two new experimental products to add context to winter weather forecasts across the contiguous United States -- the Winter Storm Outlook (WSO) and the Winter Storm Severity Index (WSSI).
The WSO presents the probability of exceeding local warning criteria for hazardous snow and ice accumulations over the next three days. It is a cooperative effort among WPC and local Weather Forecast Office (WFO) forecasters, and will lead to greater consistency in the issuance of Winter Storm Watches and unified messaging ahead of significant winter storms. The WSO is another step toward the NWS goal of improving collaborative and probabilistic winter forecast products.
As a parallel experiment to the WSO, the WSSI is being tested to determine its utility in assessing impacts from winter storms. Winter storm impacts are not entirely related to specific warning criteria, and thus WSSI utilizes a multivariate approach that includes components such as the weight of the snow, potential for blowing snow, and flash freezing, in addition to snow and ice accumulations. WSSI is a tool to help communicate a general level of potential societal impacts from winter storms.
Both products have been under internal development for several years and are now available for public use and comment. Feedback received online will be used to evaluate product development, and links to feedback forms are available on each web page.
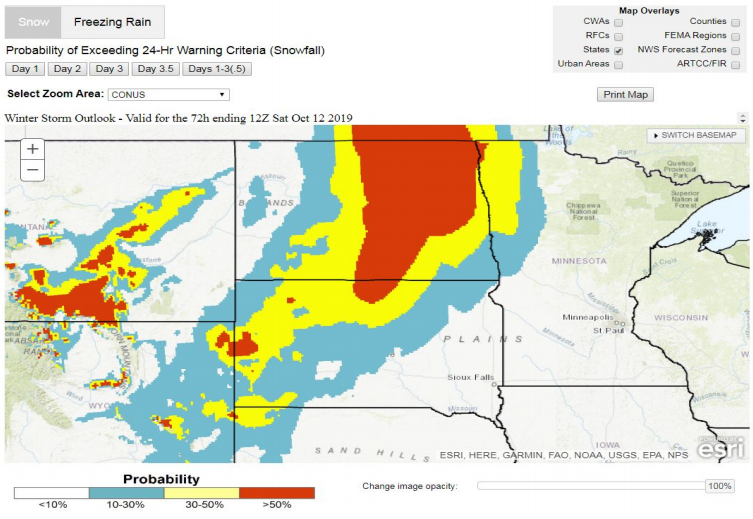
An example of the Winter Storm Outlook product from October 2019, and the surrounding web interface. Users can zoom and pan on the map, switch between the snow and ice probabilities, change the basemap, and add a variety of map overlays.​
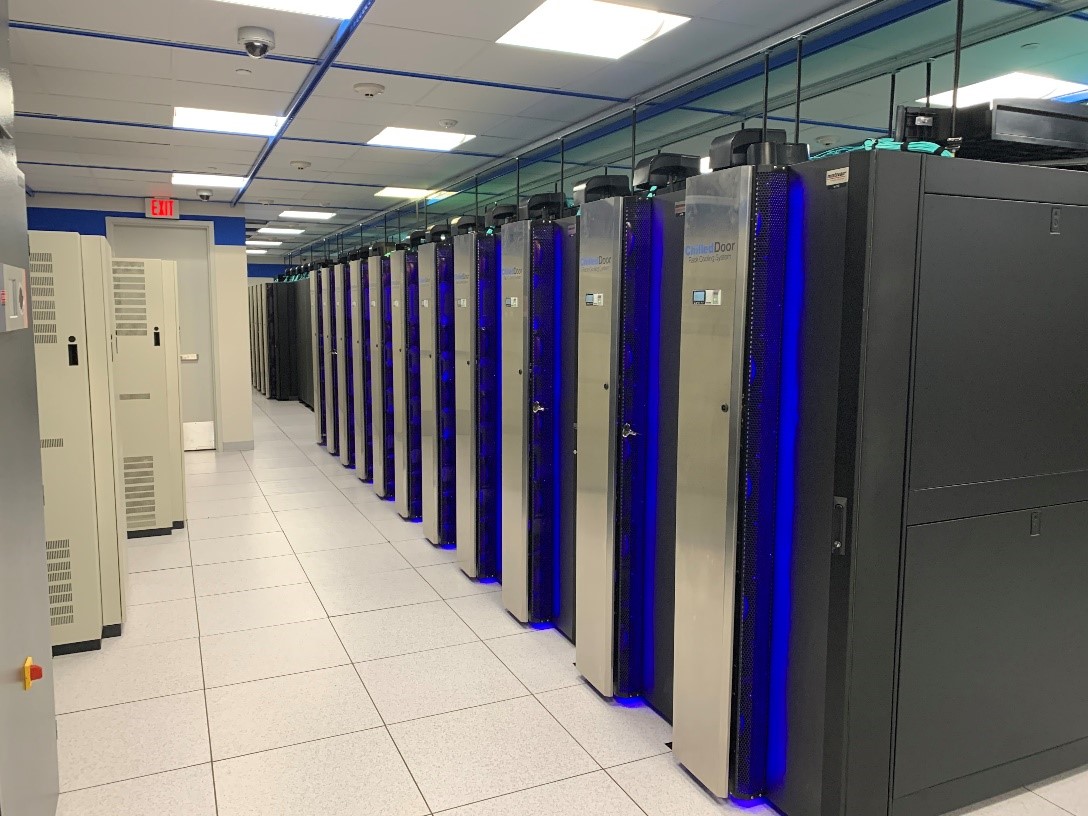
On February 14, 2020, NCEP Central Operations (NCO) awarded a new 10-year, $505 million contract to General Dynamics Information Technology (GDIT) to provide supercomputing resources as-a-service through NOAA’s Weather and Climate Operational Supercomputing System (WCOSS) program.
The systems will be designed, deployed and managed by GDIT and used to perform complex modeling of weather and climate patterns for use in generating forecast products supporting the National Weather Service. The single-award indefinite delivery, indefinite quantity (IDIQ) contract holds a total estimated value of $505 million. It includes a base period of eight years with one two-year option. Through this contract, GDIT will receive task orders related to high performance computing (HPC) deliverables, including an initial Phase 1 task order of $150 million with a period of performance February 14, 2020 to February 13, 2025.
The National Weather Service will expand their current computing power by more than 200 percent and continue to optimize their ability to provide accurate and timely weather forecasts. GDIT will deploy two HPC systems at two sites at Manassas, VA and Phoenix, AZ on separate electrical power grids to support the numerical weather prediction suite of models used in national weather forecasting.
The contract will provide two equal computing systems with one serving as the operational system and the other primarily used for development when serving as the backup. This will ensure operational readiness in the event that one system goes down, enabling the immediate transition of operations from one site to the other within minutes.
System Configuration (Per site)
NOAA NWS Cray supercomputers in Reston, VA.
The Climate Prediction Center (CPC), along with the Office of Water Prediction (OWP), issued the Spring Outlook via a press release, press teleconference, and video on March 19, 2020. The Spring Outlook identifies areas at risk of spring flooding and expectations for temperature, precipitation and drought from April through June. The temperature outlook favored warmer-than-average temperatures from coast-to-coast with the greatest chances in northern Alaska, across the central Great Basin southward into the Gulf States, and into the Southeast and portions of the Mid-Atlantic. No part of the country is favored to experience below-average temperatures this spring. Above-average precipitation is favored from the Northern Plains, southward through the lower Mississippi Valley across to the East Coast. Large parts of Alaska are also likely to experience above-average precipitation in the months ahead.
The seasonal flood outlook indicated widespread flooding during the spring, but did not expect it to be as severe or prolonged overall as the historic floods in 2019. Major to moderate flooding is likely in 23 states from the Northern Plains south to the Gulf Coast, with the most significant flood potential in parts of North Dakota, South Dakota and Minnesota. With soil moisture already at high levels across much of the central U.S., and many rivers running high in the central and eastern U.S., any heavy local rainfall could trigger flooding in these high-risk areas.
The press release with a link to a spring outlook video can be found here:
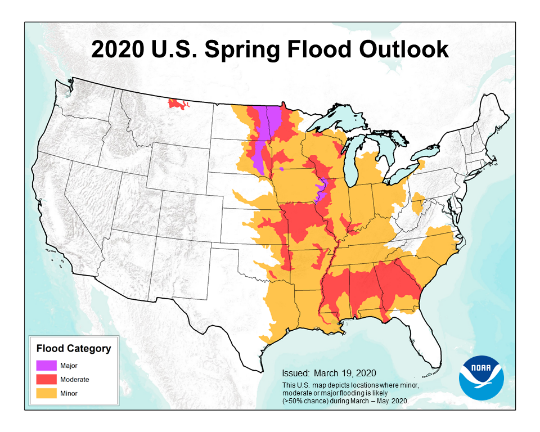
February – April Temperature Outlook (left), February – April Precipitation Outlook (middle), and March – May Flood Outlook (right).
The deadly impacts of storm surge are not confined to just the United States. It’s a problem anywhere these storms occur. With the success of its new products that include the Potential Storm Surge Flooding Map and the storm surge watch and warnings, the National Hurricane Center storm surge unit participated in a joint Caribbean WeatherReady Nations and Coastal Inundation meeting on January 22-24 in Barbados. Representatives of WMO RA-IV nations in the Caribbean region gathered there to discuss it using new coastal inundation mapping to improve resilience and disaster mitigation in their respective countries.
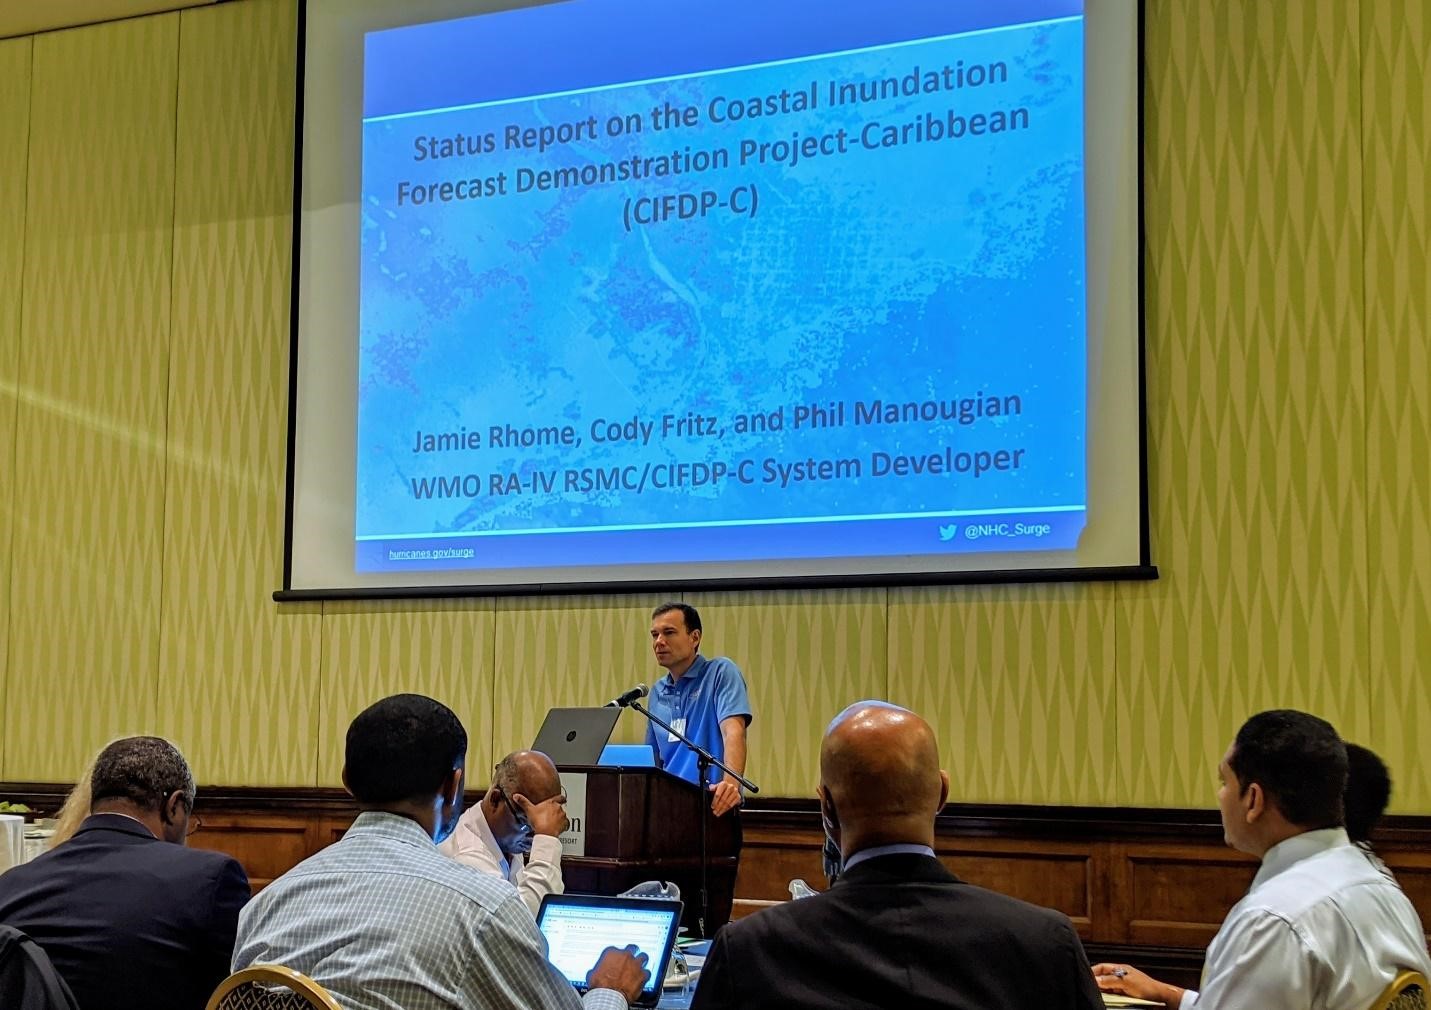
NHC storm surge team leader Jamie Rhome addresses the attendees of the Caribbean WeatherReady Nations and Coastal Inundation meeting in Barbados, January 23, 2020. Photo credit: NOAA Communications.
What do cruise ship captains, the U.S. Coast Guard, oil companies and Port Meteorological Officers have in common? Each has a critical stake in the weather and water conditions at sea.
To help them with this challenge, NHC again hosted the Mariners’ Decision Makers Workshop. The March 3-5 workshop drew more than 3 dozen attendees to the NHC seminar room for classroom instruction by several NHC hurricane specialists as well as several meteorologists from the NHC Tropical Analysis & Forecast Branch, describing the use of hurricane and marine forecast products.
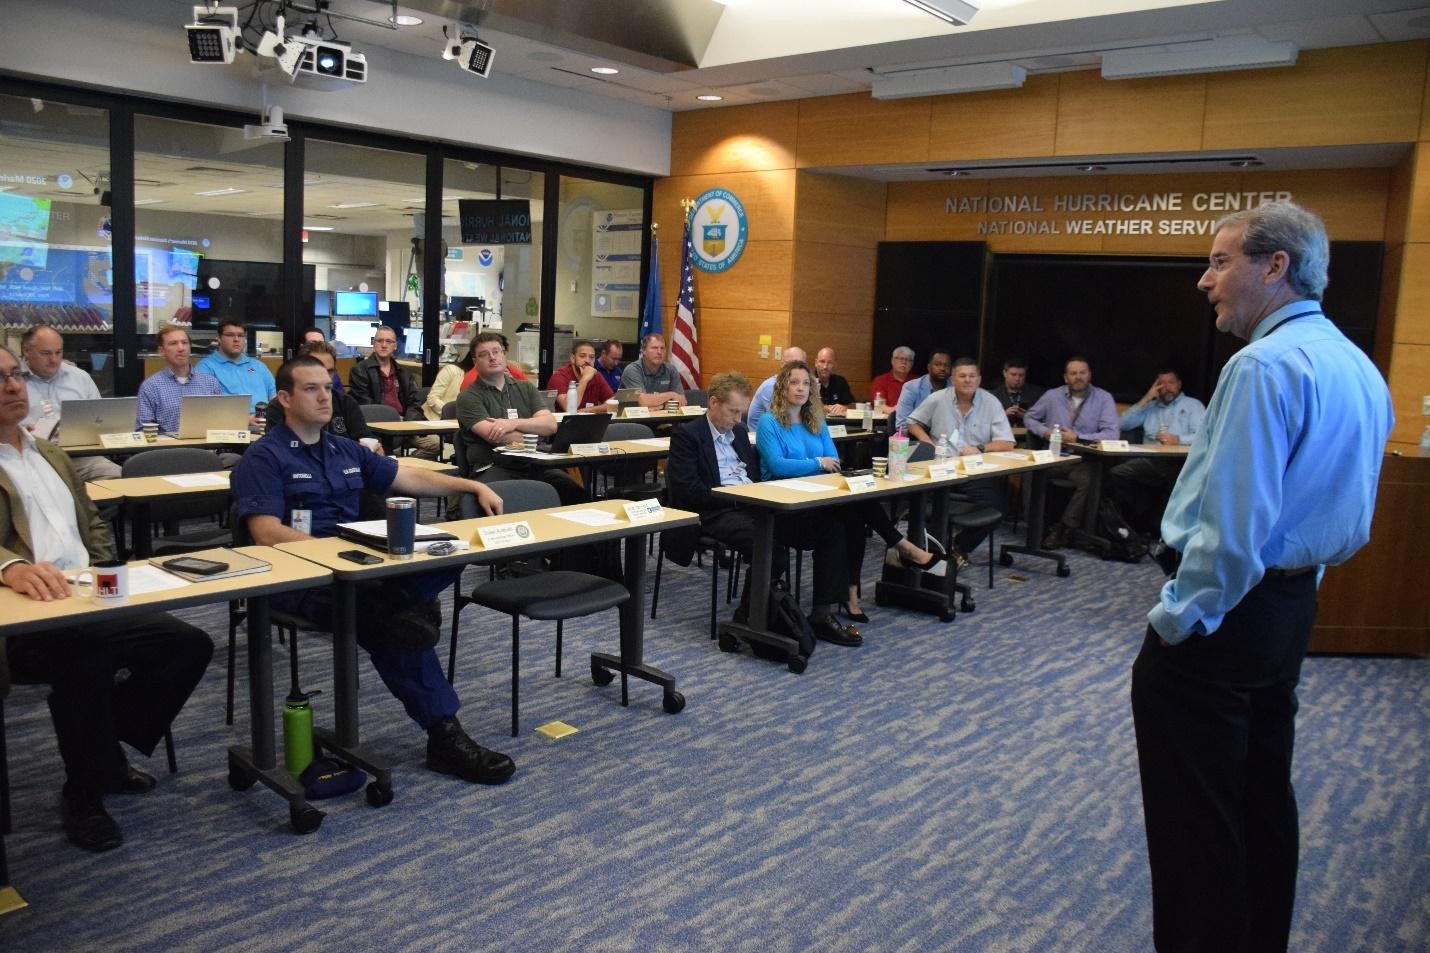
NHC Deputy Director Dr. Ed Rappaport addresses the attendees of the Mariners’ Decision Makers Workshop, Miami, Fla. March 3, 2020. Photo credit: NOAA Communications
NHC once again hosted the FEMA L-0324 course "Hurricane Preparedness for Decision Makers”. The intensive five-day course was presented during three different weeks in January and February. Two dozen emergency managers and decision makers from the coastal U.S states in the Northeast (Maine to Maryland), Southeast (Virginia to Florida) and Gulf of Mexico (Florida to Texas) each took part in comprehensive workshops in the use of NHC products, many taught by the NHC hurricane and storm surge specialists.
After four days of extensive training, the participants put their learned skills to the test in a tabletop exercise. It featured a fictional Hurricane Mallory strengthening and aiming at the U.S. East coast. Based on the potential impacts, the participants had to decide where and when to order coastal evacuations.
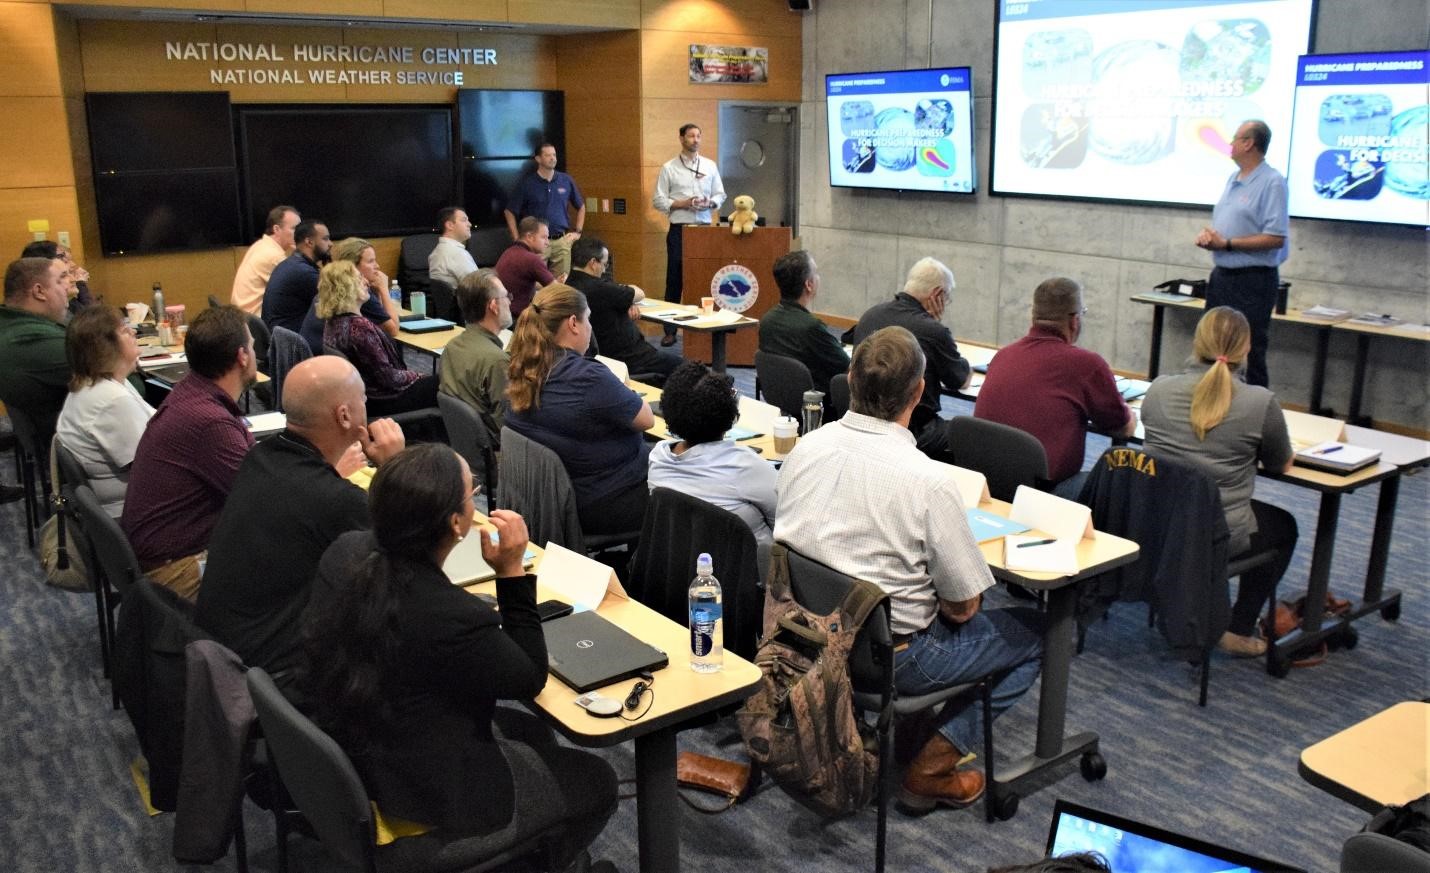
NHC Director Ken Graham address the two dozen participants from the Southeast U.S. who are about to take part in the FEMA L-0324 course. February 10, 2020 Photo credit: NOAA Communications
The International Women in Aviation Conference was held March 5-7 at Disney’s Coronado Springs Resort in Lake Buena Vista, FL. Women in Aviation International is a nonprofit organization dedicated to the encouragement and advancement of women in all aviation career fields and interests. This year a total attendance of nearly 4,500 included 142 international representatives from 31 countries.
The Meteorologist in Charge of the Denver Central Weather Service Unit joined representatives from the Aviation Weather Center. This provided a great opportunity to explain the various roles performed in the National Airspace System and the aviation services provided by the NWS. Since weather plays a vital role in aviation, various types of aviation careers were discussed with attendees. In addition, many weather questions were answered. A very common theme expressed by the attendees was an appreciation of the products and services provided by the National Weather Service.
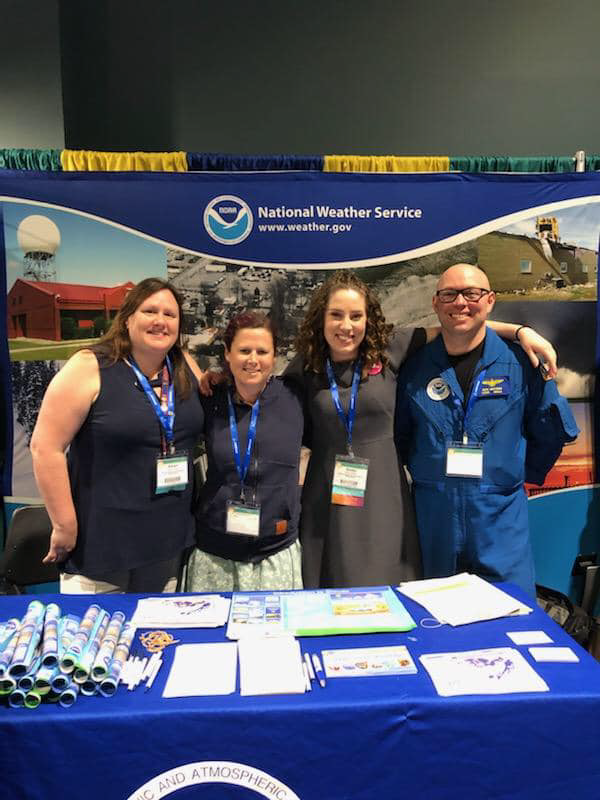
Left to Right: Karen Eagle; Meteorologist in Charge CWSU Denver, Katie Deroche; AWC Senior Aviation Forecaster, Emily Ireland; AWC Research/Development Meteorologist, LCDR Ron Moyers; Executive Officer, AWC
The NASA-NOAA Space Weather R2O2R Framework was completed and presented to representatives from the Executive Office of the President on February 27th during a meeting at NASA Headquarters. This meeting was requested by the Office of Management and Budget (OMB) and the National Security Council (NSC) , to get an update on agency progress to develop an R2O2R framework. This was a follow-up to the August 2019 meeting held at NASA Goddard Space Flight Center (GSFC) to introduce an effective R2O2R process for space weather in response to multiple Executive directives. The R2O2R Framework was presented by SWPC Director, Clinton Wallace and NASA Heliophysics Science Division Director, Nicky Fox.
NOAA and NASA are jointly leading the Framework initiative to foster the collaborative transition of new and/or updated capabilities from a variety of sources including academia and commercial enterprises, into operations such that:
The Framework introduces the Space Weather Proving Grounds, with initial participation by NASA’s Community Coordinated Modeling Center (CCMC) and SWPC’s Space Weather Prediction Testbed.
.png)
Research to NOAA-Operations to Research Process
The Space Weather Prediction Center’s final report for the Commercial Weather Data Pilot (CWDP) Round 2 was submitted to NESDIS on February 21, 2020. The analysis was completed by the Univ. of Colorado Cooperative Institute for Research in Environmental Sciences (CIRES), NCEP Space Weather Prediction Center (SWPC), and NCAR Developmental Testbed Center (DTC). The results of this assessment are currently being studied and are expected to be released soon.
All signals from Global Navigation Satellite Systems (such as GPS) used for positioning, navigation and timing on Earth and in aircraft must travel through the ionosphere to reach us. When the ionosphere is disturbed due to space weather, the availability and accuracy of these signals is impacted. Products and services provided by SWPC rely on models of Earth’s ionosphere to inform customers, such as the global aviation industry, when disturbances occur.
As illustrated in the accompanying figure, a satellite orbiting close to Earth detects signals from a GNSS satellite after the signals pass through the ionosphere. By analyzing the signals, properties of the ionosphere are determined, such as the electron density and its level of disturbance. The CWDP report documents the assessment of the potential benefit from commercially provided radio occultation data when used in Earth-system data assimilation models. SWPC looks forward to the operational utilization of new sources of radio occultation data, including the recently launched COSMIC-2 constellation.
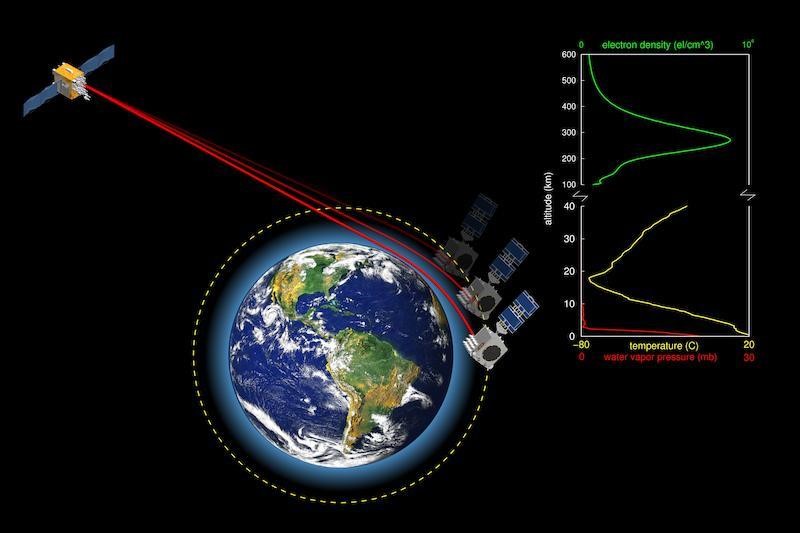
Figure credit: UCAR COSMIC Data Analysis and Archive Center
The Intermountain West Aviation Weather Safety Workshop was held May 29-30. Although originally scheduled to be held in Reno, Nevada this year, a virtual workshop was necessary due to the ongoing pandemic. Attendees included members of the Armed Forces, National Weather Service, Federal Aviation Administration, National Transportation Safety Board, several airlines, and civil air patrol. Pilot safety, aviation forecasting and meteorology, and case studies from past events that impact air traffic were listed on the two-day agenda. The first day was focused towards operational meteorologists and included several National Weather Service modeling presentations. Aviation Weather Center Senior Meteorologist Perry Dehne gave a presentation on a case study of the severe turbulence event over Utah on January 27, 2020. On that day a cross-barrier flow was established within a northwesterly wind regime across the area of interest. This pattern promoted the development of a significant mountain wave. The mountain wave that was created was a vertically propagating wave that eventually pushed through the tropopause. With the aid of higher resolution modeling it was demonstrated that important features such as hydraulic jumps were more evident. As high-resolution models provide additional detail in the future, it is hoped that a more proactive nature can be fostered with regard to mountain wave forecasting.
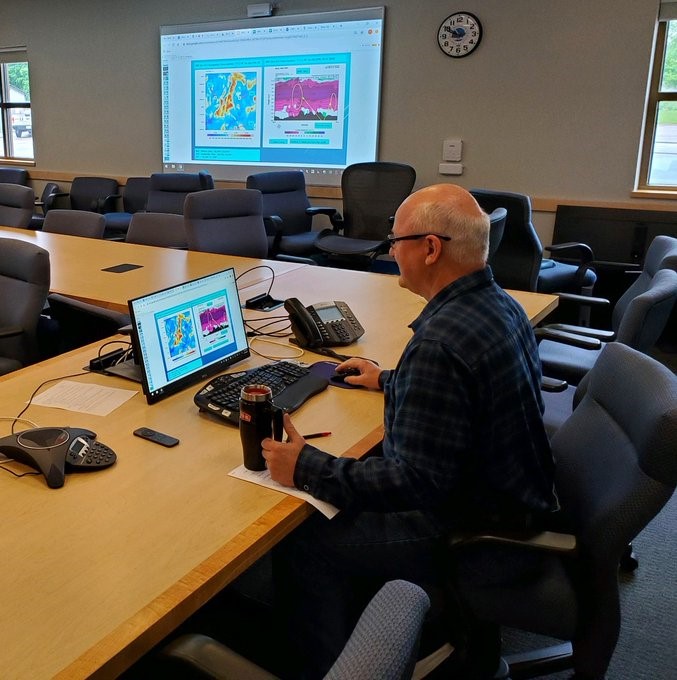
Perry Dehne, Aviation Weather Center Senior Aviation Meteorologist, prepares for virtual presentation on severe turbulence at the annual Intermountain West Aviation Weather Safety Workshop.
The Climate Prediction Center (CPC) issued its 2020 Atlantic hurricane season outlook on May 21st, calling for a 60% chance of an above-normal season, a 30% chance of a near-normal season and only a 10% chance of a below-normal season. This outlook is produced in collaboration with hurricane experts from the National Hurricane Center (NHC) and the Hurricane Research Division (HRD). The 2020 Atlantic hurricane season outlook was presented during a national press teleconference led by Wilbur Ross, Dept. of Commerce Secretary and Dr. Neil Jacobs, Acting NOAA Administrator. The CPC’s Dr. Gerry Bell (Lead Seasonal Forecaster) also spoke and then addressed scientific questions and did numerous media interviews.
NOAA predicted a likely range of 13 to 19 named storms (winds of 39 mph or higher), of which 6 to 10 could become hurricanes (winds of 74 mph or higher), including 3 to 6 major hurricanes (category 3, 4 or 5; with winds of 111 mph or higher). The combination of several climate factors is driving the strong likelihood for above-normal activity in the Atlantic this year. El Nino Southern Oscillation (ENSO) conditions are expected to either remain neutral or to trend toward La Nina, meaning there will not be an El Nino present to suppress hurricane activity. Also, warmer-than-average sea surface temperatures in the tropical Atlantic Ocean and Caribbean Sea, coupled with reduced vertical wind shear, weaker tropical Atlantic trade winds, and an enhanced west African monsoon all increase the likelihood for an above-normal Atlantic hurricane season. Similar conditions have been producing more active seasons since the current high-activity era began in 1995. NOAA will update its Atlantic Hurricane Season Outlook in early August.
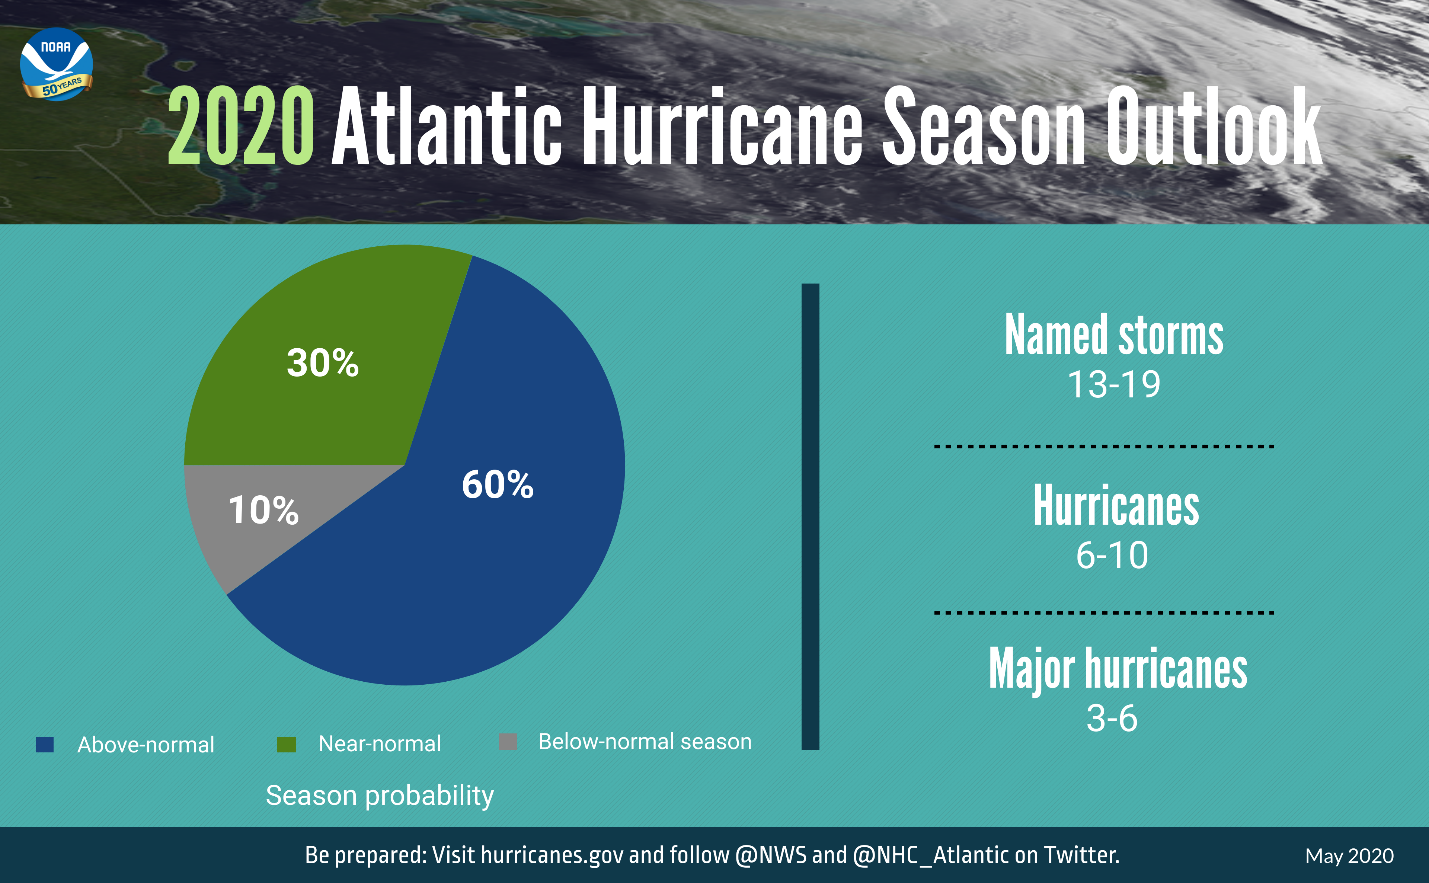
NOAA’s 2020 Atlantic hurricane season outlook issued May 21st, 2020. This probabilistic outlook reflects the expected seasonal
activity for the entire Atlantic basin, which includes the North Atlantic Ocean, Caribbean Sea, and Gulf of Mexico.
The outlook is not a seasonal landfall forecast, and it does not predict levels of activity for any particular region.
Environmental Modeling Center (EMC) Upgrades the Hurricanes in a Multi-scale Ocean-coupled
Non-hydrostatic (HMON) model for the 2020 Hurricane Season
NCEP implemented version 3.0 of HMON, developed by EMC scientists, on Tuesday June 9, 2020 at 1200 GMT. This upgrade is expected to improve track and intensity forecast skill for tropical cyclones in the North Atlantic, East Pacific and Central Pacific basins, as well as reducing the intensity bias and storm size errors. The 2020 HMON v3.0 system has been fully tested and compared with the forecast skill of 2019 operational HMON v2.1.3. Overall, it has shown improved skill in track and intensity forecasts for both North Atlantic (NATL) and Eastern Pacific (EPAC) basins. The 2020 HMON model includes the following enhancements: model vertical resolution has increased from 51 to 71 levels, the latest version of the HYCOM ocean model is now being used, the original IGBP (International Geosphere-Biosphere Programme) roughness length has been added, and the Nonhydrostatic Multiscale Model on the B-grid (NMMB) dynamic core was upgraded and includes several bug fixes. HMON is part of NCEP/EMC’s long-term strategy to develop a global hurricane forecast system incorporating multiple static and moving nests, with one- and two-way interaction, and coupled to other (ocean, wave, land, surge, inundation, etc.) models using the National Unified Operational Prediction Capability (NUOPC) infrastructure.
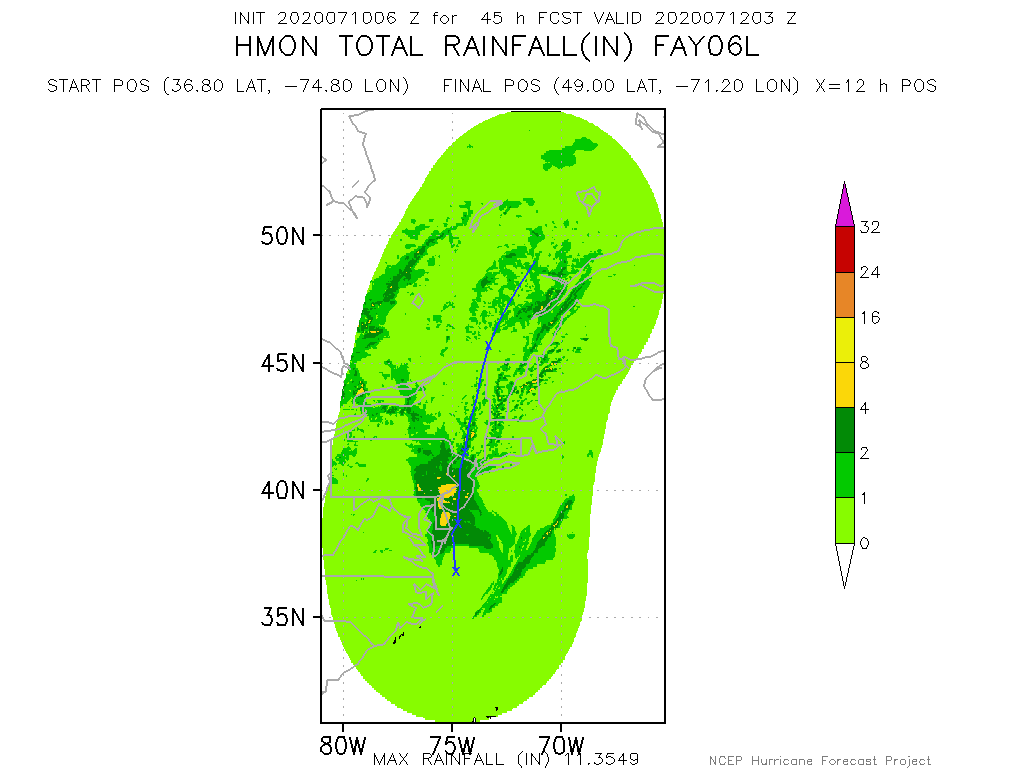
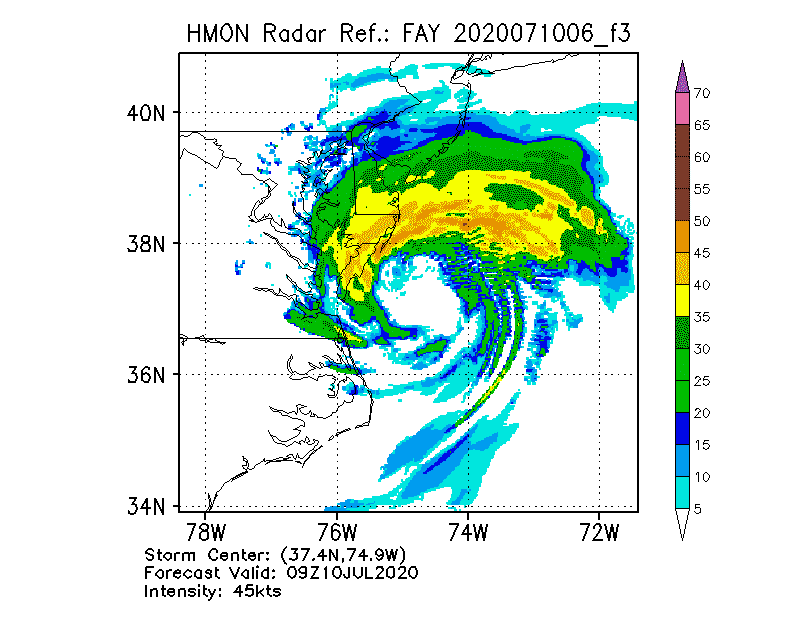
HMON model output for Tropical Storm Fay, from the 0600 GMT forecast run on July 10, 2020. The 45-hour forecast storm track and total rainfall for Fay, valid as of 0300 GMT on July 12, 2020, is on the left. The model 03-hour forecast of radar reflectivity for Fay, valid at 0900 GMT on July 10, 2020, is on the right. Graphics were produced by NCEP/EMC.
National Hurricane Center and WFO Miami lead VIP tour
It’s all about the mission and being ready for the 2020 hurricane season. That's the message from the National Hurricane Center and WFO Miami during a VIP tour of the facility on June 8th. Led by NHC Director Ken Graham, the guests, who were all masked and did their best to practice social distancing, included Acting Department of Homeland Security Secretary Chad Wolf, FEMA Administrator Pete Gaynor, USCG Commandant Admiral Karl Schultz, Florida Governor Ron DeSantis and Miami-Dade County Mayor Carlos Gimenez. Briefings took place by the respective team leaders and branch chiefs in six critical areas - the FEMA liaison office, the hurricane forecast operations area, storm surge unit, CARCAH, the Tropical Analysis and Forecast Branch (TAFB) and the NWS Miami forecast office. All came away impressed at the size of the staff and facility compared to the tremendous responsibility to our nation, especially during these challenging times.
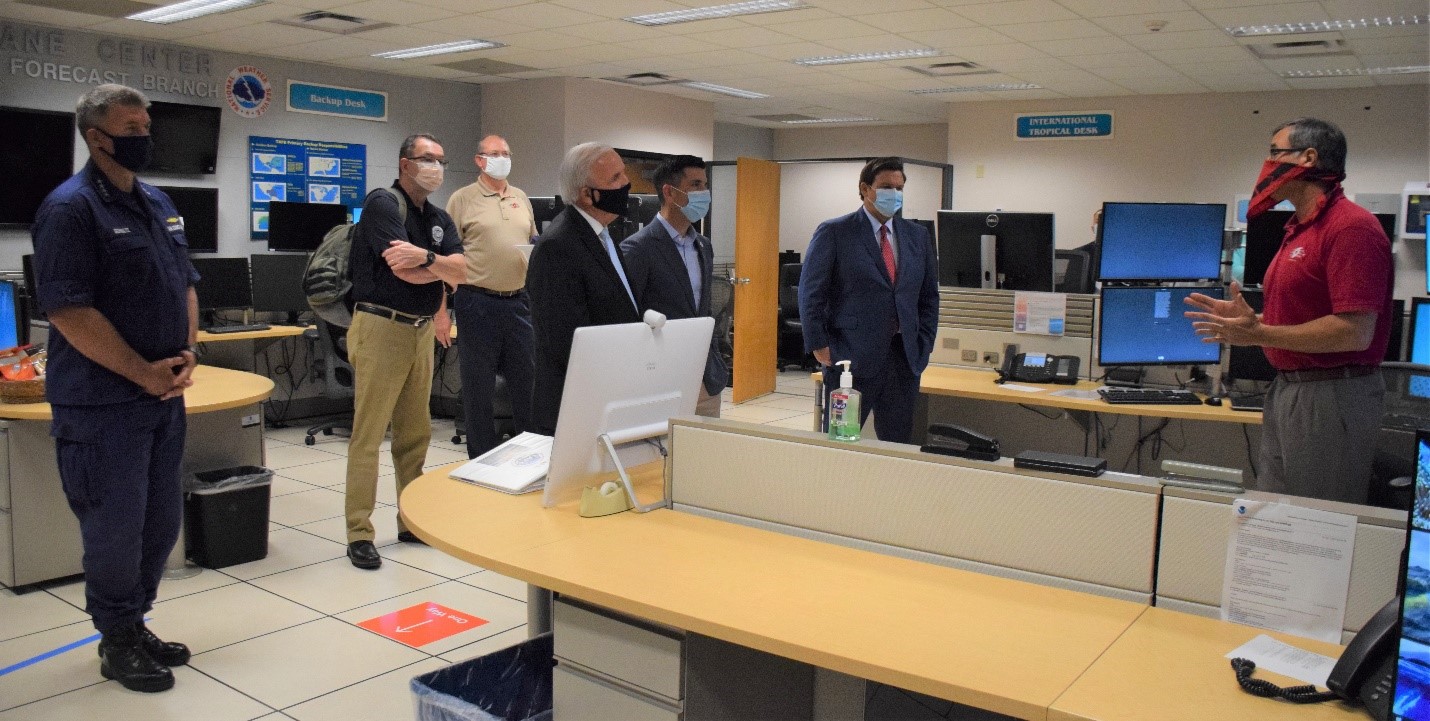
TAFB Branch Chief Dr Chris Landsea (right) explains the Marine Weather Program to USCG Admiral Schultz, FEMA Administrator Gaynor, Miami-Dade Mayor Gimenez, Acting DHS Secretary Wolf, and Fla. Gov. DeSantis, as NHC Director Ken Graham looks on. June 8, 2020 (Photo credit: Dennis Feltgen - NOAA Communications)
The National Hurricane Center works to keep staff and facility safe amid pandemic
The country depends on NOAA’s National Hurricane Center for tropical cyclone forecasts, watches, and warnings. We are ready for the 2020 season, just as we are every year. The COVID-19 pandemic saw NHC move from its in-person hurricane preparation outreach to a virtual world. The “Hurricane at Home school” webinars, Skype media availabilities, and other remote outreach to our partners ensured that our key hurricane messaging would be heard and understood.
Steps were taken beginning in March to protect the facility to ensure a safe environment for the staff. This includes the wearing of masks and following the guidelines on social distancing. We will continue to do our best to keep our staff safe and ready as the heart of the hurricane season approaches.
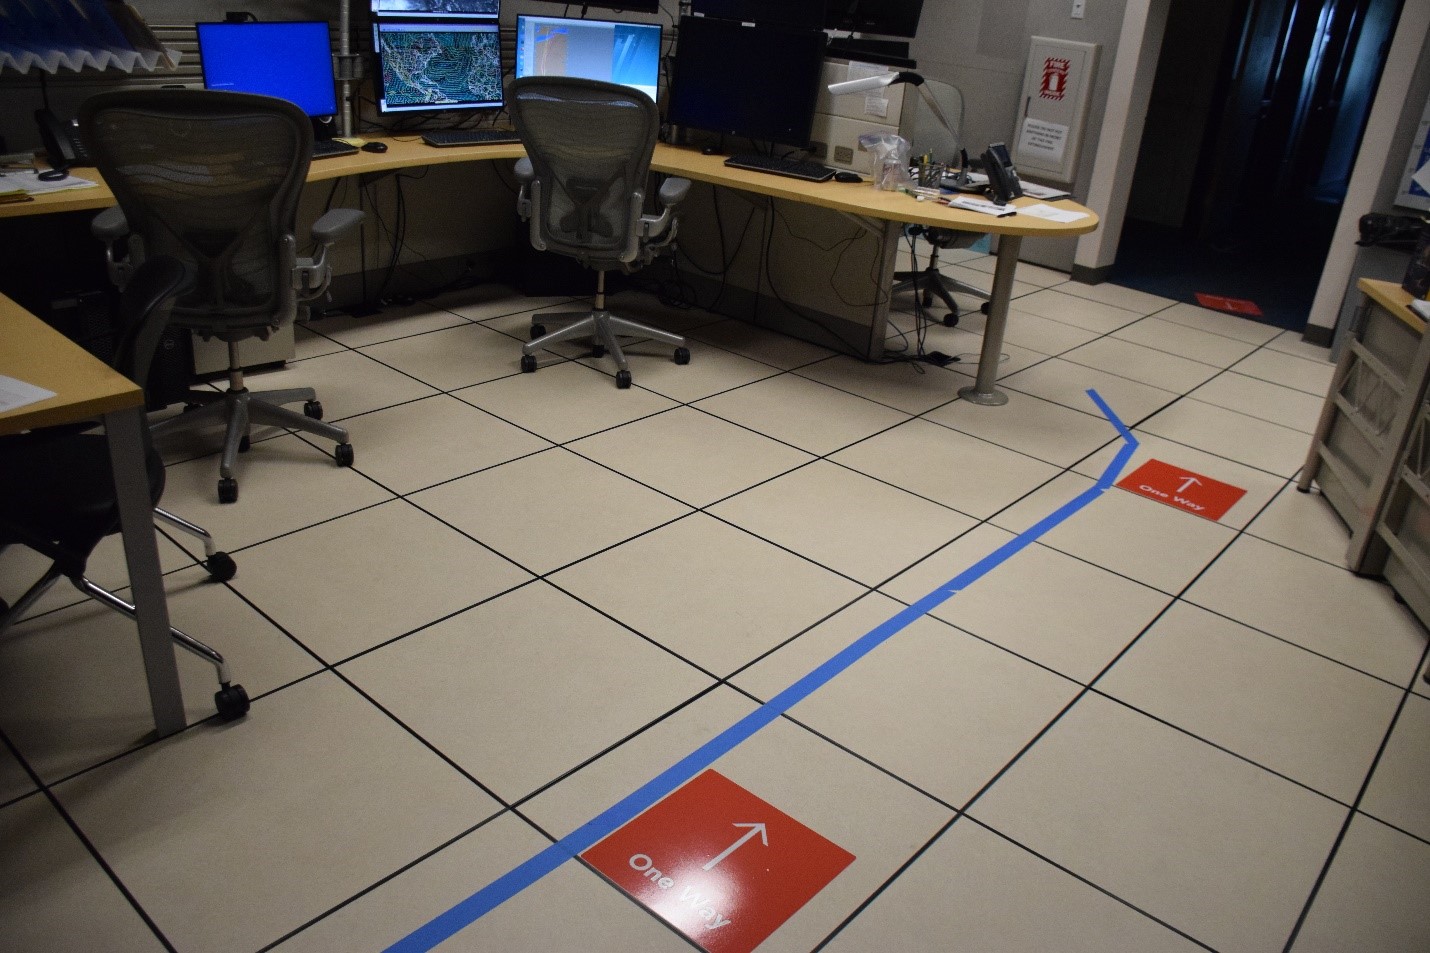
The NHC hurricane operations area is set up to practice social distancing to help keep the staff safe. (Photo credit: Dennis Feltgen - NOAA Communications)
NHC briefs U.S. Congresswoman ahead of the official start of hurricane season.
The 2020 hurricane season is not on hold and, in fact, began several weeks early. The COVID-19 pandemic has added extra challenges in preparing for what is forecast to an active hurricane season. That’s part of the messaging provided to U.S. Representative Debbie Wasserman Shultz (FL-23) during her annual hurricane season briefing and press event. With in-person meetings suspended for the foreseeable future, this year’s event was done virtually. NHC Director Ken Graham led the line-up of speakers, emphasizing the importance of knowing your personal vulnerability to the different impacts of wind and water, and getting your supplies now.
NHC Director Ken Graham, discusses the 2020 hurricane season with U.S. Representative Debbie Wasserman Shultz. May 29, 2020. (Photo credit: Dennis Feltgen - NOAA Communications)
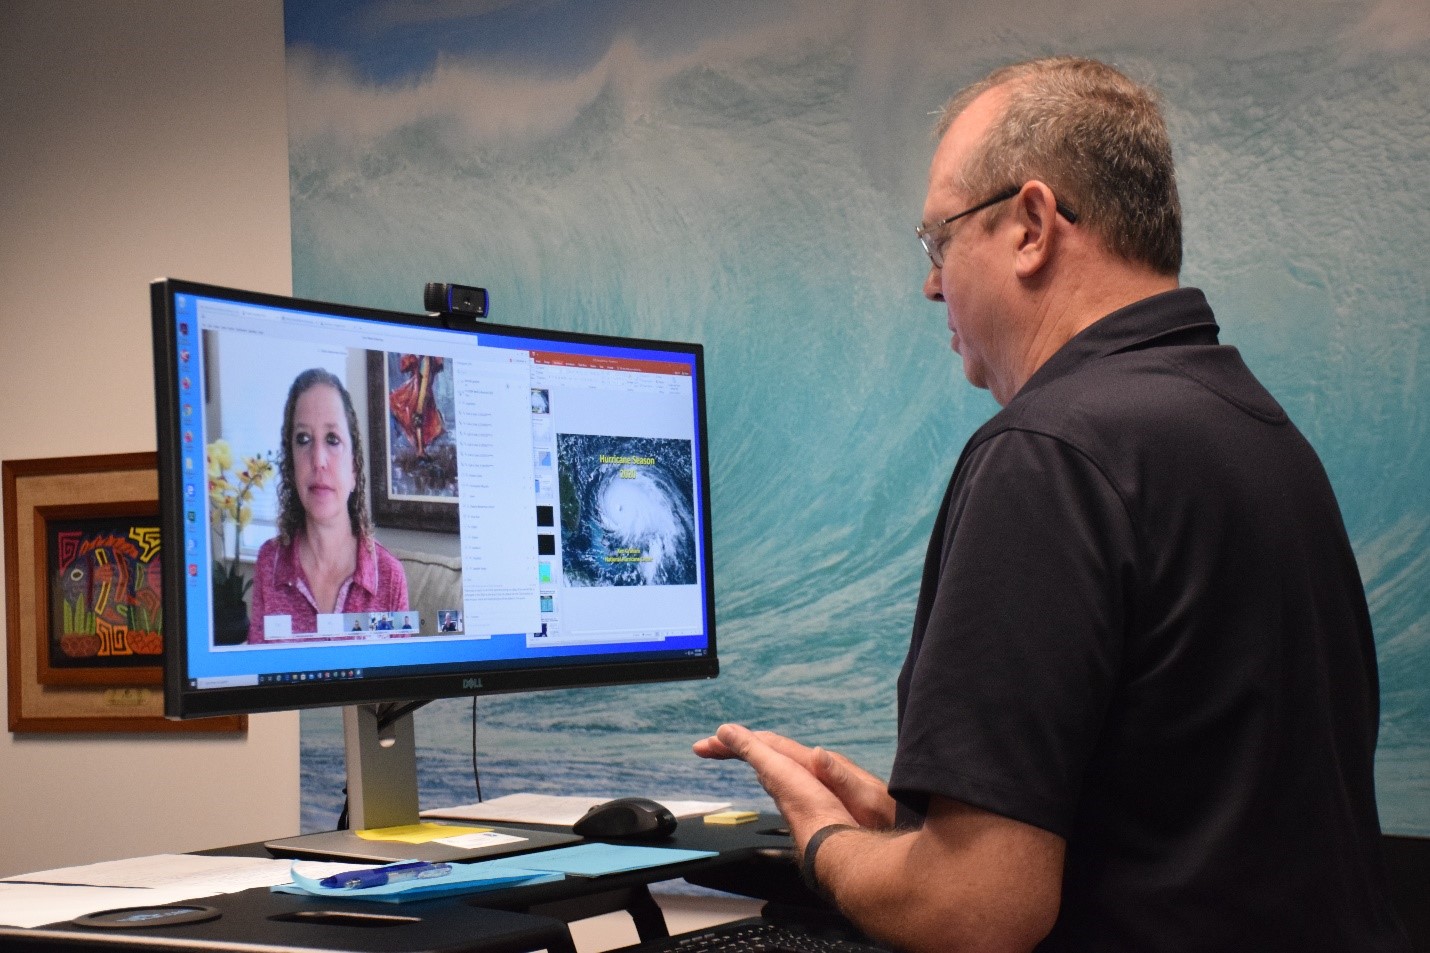
OPC Rallies for the Mariner as TS Fay Rolls up the East Coast
As Tropical Storm Fay transited up the eastern seaboard July 9 to 11, forecasters from OPC were busy coordinating warnings and forecasts with the NHC and applicable coastal WFOs. While laser focus is usually and appropriately given to land-based impacts, another customer in the offshore zones and high seas areas, oftentimes more numerous than a coastal community, is looking to OPC for delivery of that critical and timely weather information to guide their safety decisions.
There are over 150 products issued daily by the OPC, which include high seas and offshore forecasts of warnings, winds, and seas. In addition, Navigational Telex (NAVTEX) and broadcast messages produced by the OPC are relayed by the U.S. Coast Guard, and radiofax charts are produced that note the major weather features and expected maximum wind impact on the mariner out to five days. All of the tropical information included in these forecasts are coordinated closely with forecasters at the NHC, and the advisories hurricane specialists issue, to ensure consistency.
In support of one of OPC’s core partners, a decision support briefing was provided to the U.S. Coast Guard District 5 July 5 on low pressure over the southeast U.S. that had a chance of turning tropical in the days to come. Daily briefings were provided on Fay on July 9, 10, and 11 to improve U.S. Coast Guard situational awareness. All of the briefings were, in turn, shared by the U.S. Coast Guard with its marine contacts.
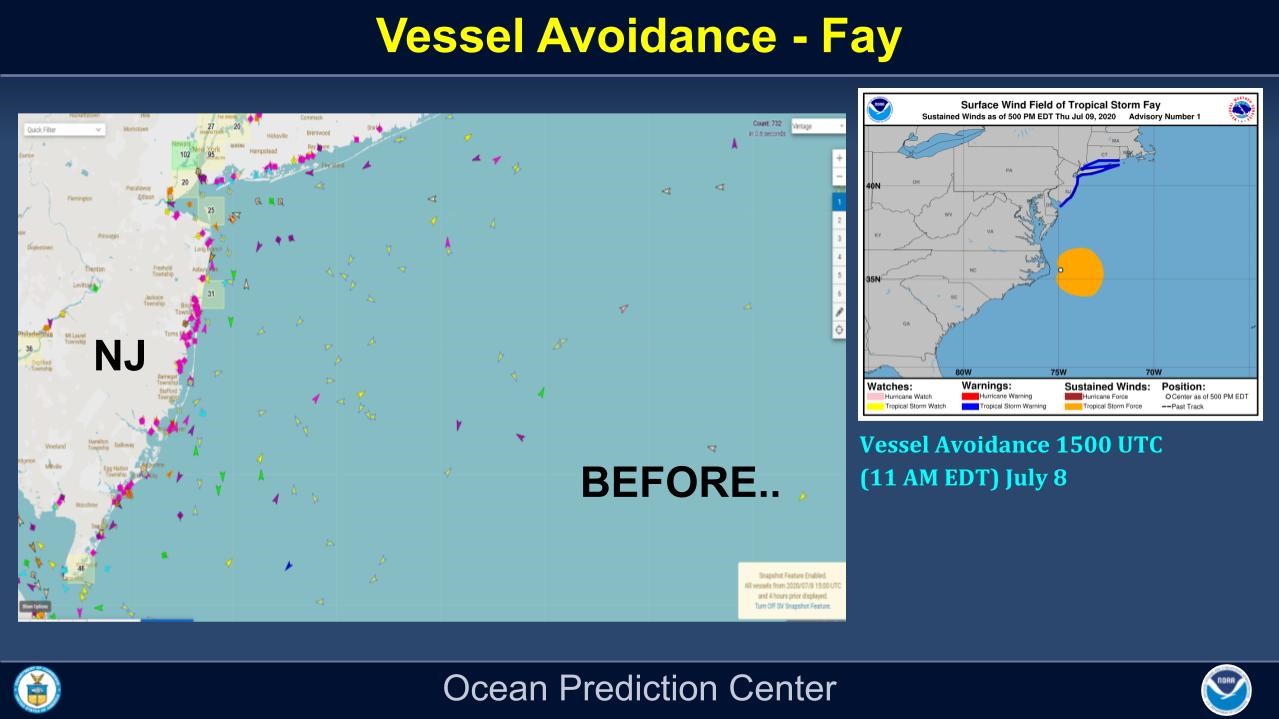
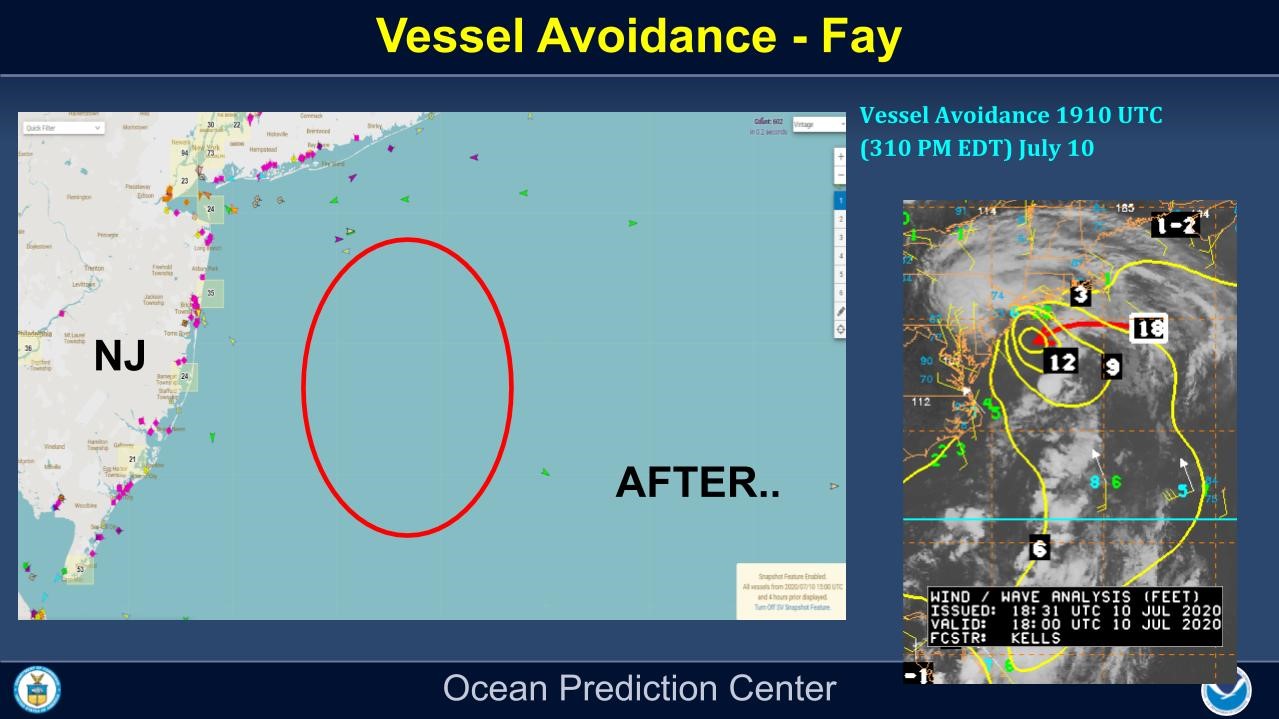
CAPTION: “Top: TS Fay and Marine Traffic on 8 July; Bottom: TS Fay and Marine Traffic on 10 July. Note the rapid clearing out of vessel traffic off the coast of New Jersey.”]
While there may be several means by which these vessels receive their marine weather information in the offshore zones or high seas areas, nearly all of it in the North Atlantic and the North Pacific originates at OPC. And for most, OPC is not only the originator but also the sole messenger, and despite decades-old transmission and delivery systems, mariners are not only quick to understand the warnings, but also to act on them. In the years ahead, and in partnership with other NWS offices and centers, OPC will be striving to modernize and transform the way mariners receive its warning services through the production of full-basin grids and receipt of warning polygons, graphics and grids via electronic navigation systems. These are not just good ideas, but also advance OPC's, and the entire NWS, role as a key service provider of the U.S. contribution to a global network of weather centers providing support to the International Maritime Organization’s Global Maritime Distress and Safety System, transmitting forecasts and hazardous weather warnings via the World Meteorological Organization’s Marine Broadcast System. These requirements are codified in amendments to the International Convention for the Safety of Life at Sea, the origin of which dates back to the 1912 Titanic disaster.
Storm Prediction Center Hosts Virtual Hazardous Weather Testbed Spring Forecasting Experiment
The annual Hazardous Weather Testbed (HWT) Spring Forecasting Experiment (SFE), organized and hosted by the Storm Prediction Center (SPC) and the National Severe Storms Laboratory (NSSL), was conducted virtually from 27 April to 29 May. Restrictions on travel and group gatherings precluded an in-person experiment this year; however, to maintain momentum in several areas of convection-allowing model (CAM) development, a quick shift to a fully remote experiment was executed with just a few weeks' notice. The 2020 HWT SFE focused on the next-day evaluation of CAM and CAM ensemble performance for severe convective weather. In addition, a limited number of National Weather Service (NWS) forecasters participated in online real-time afternoon forecasting activities focused on Warn-on-Forecast applications. While there are important aspects of the experiment that cannot be replicated online, the virtual HWT SFE was successful in meeting its scientific objectives and in bringing the community together to work on common problems of interest.
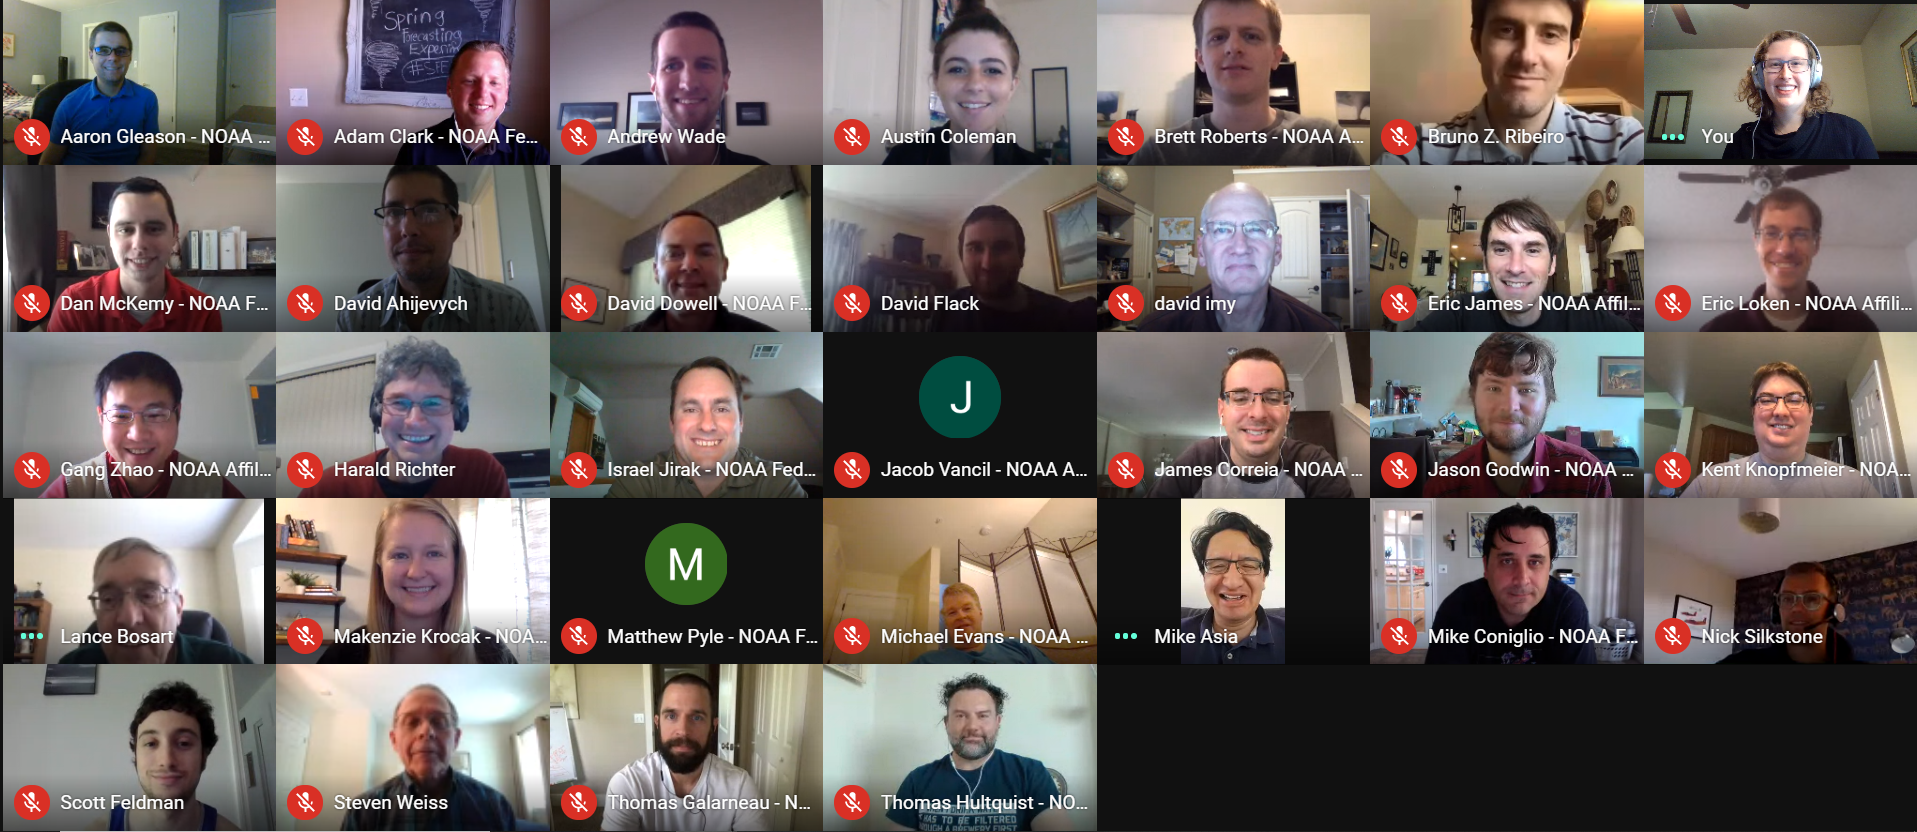
Participants from the fourth week of the 2020 HWT SFE held virtually from 27 April 2020 - 29 May 2020 with forecasters, model developers, academics, researchers, and students from across the world. Top Row (L to R): Aaron Gleason (SPC; Norman, OK), Adam Clark (NSSL; Norman, OK), Andy Wade (SPC/Cooperative Institute for Mesoscale Meteorolgical Studies [CIMMS]; Norman, OK), Austin Coleman (Texas Tech University; Lubbock, TX), Brett Roberts (SPC/NSSL/CIMMS; Norman, OK), Bruno Ribeiro (State University of New York [SUNY] - Albany; Albany, NY), and Burkely Gallo (SPC/CIMMS; Norman, OK). Second Row from Top (L to R): Dan McKemy (NWS Weather Forecast Office [WFO]; Louisville, KY), David Ahijevych (National Center for Atmospheric Research; Boulder, CO), David Dowell (Global Systems Laboratory [GSL]; Boulder, CO), David Fleck (Met Office; Exeter, UK), David Imy (Retired SPC; Norman, OK), Eric James (GSL; Boulder, CO), and Eric Loken (NSSL/CIMMS; Norman, OK). Third Row from Top (L to R): Gang Zhao (Environmental Modeling Center [EMC]; College Park, MD), Harald Richter (Bureau of Meteorology; Melbourne, Australia), Israel Jirak (SPC; Norman, OK), Jake Vancil (SPC/CIMMS; Norman, OK), Jimmy Correia (Weather Prediction Center; College Park, MD), Jason Godwin (NWS WFO; Fort Worth, TX), and Kent Knopfmeier (NSSL/CIMMS; Norman, OK). Fourth Row from Top (L to R): Lance Bosart (SUNY-Albany; Albany, NY), Kenzie Krocak (NSSL/CIMMS; Norman, OK), Matt Pyle (EMC; College Park, MD), Mike Evans (NWS WFO; Albany, NY), Mike Bush (Met Office; Exeter, UK), Mike Coniglio (NSSL; Norman, OK), and Nick Silkstone (Met Office; Exeter, UK). Bottom Row (L to R); Scott Feldman (SUNY-Albany; Albany, NY), Steve Weiss (Retired SPC; Glastonbury, CT), Tom Galarneau (NSSL/CIMMS; Norman, OK), and Tom Hultquist (NWS WFO; Minneapolis, MN).
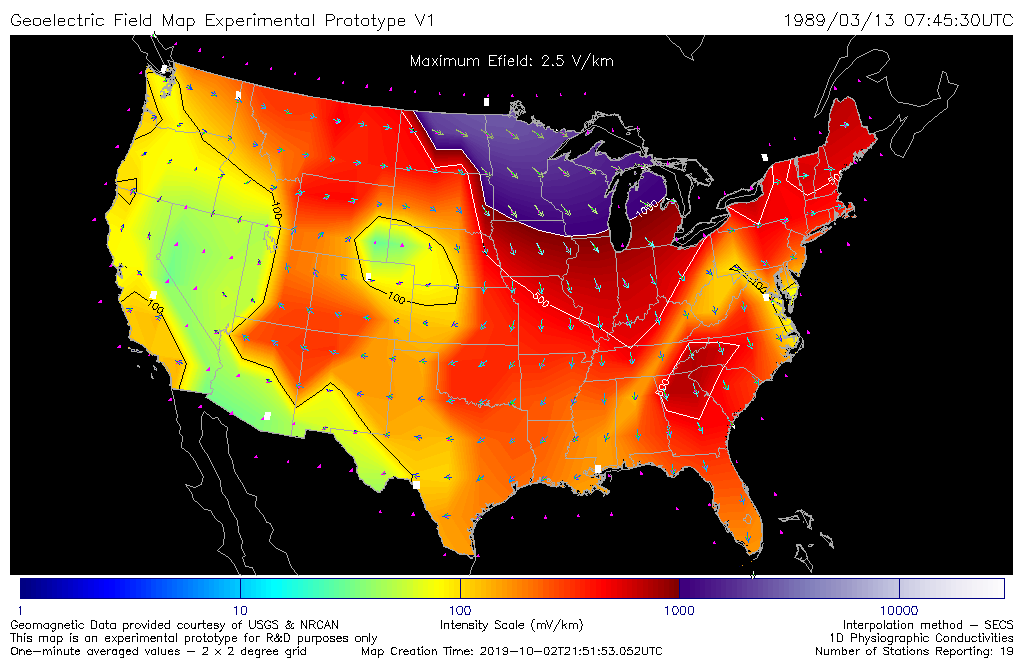
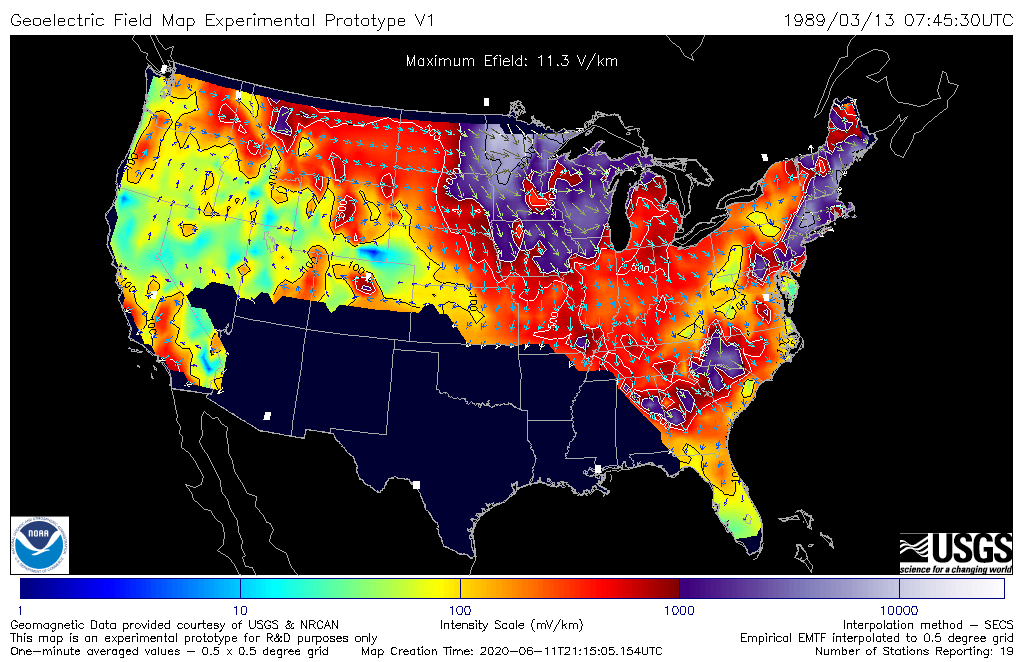
3D Regional Geoelectric Model Deployed to SWPC’s Experimental Web Page
On May 21, 2020, the Space Weather Prediction Center deployed an upgrade to the joint NOAA/USGS Regional Geoelectric Model to the SWPC experimental web page, which uses an improved description of Earth Conductivity. This is a preliminary implementation for final evaluation purposes before this version is deployed operationally by the end of September. The improved description was made possible by the incorporation of results from a large number of magnetotelluric (MT) surveys, which are publicly available thanks to the EMTF data service of IRIS (Incorporated Research Institutions for Seismology). The service provides electromagnetic transfer functions (EMTF’s) which can be used with a local magnetic time series to empirically calculate the surface geoelectric field. The transfer functions incorporate all the effects of the 3D earth conductivity structures at the survey location and can be combined to provide an empirical EMTF-3D model of the geoelectric field. Once the geoelectric field is known, the level of geomagnetically induced current (GIC) can be calculated in a power system. Knowledge of GIC in a power grid is the most direct way to determine the impact of a geomagnetic storm on the system.
The first version of this product, released in 2017, uses a collection of twenty 1D models (conductivity varying with depth), for various physiographic regions of the U.S. (Fernberg, 2011), based on a collation of the scientific literature up to that time, and have been widely used in industry standards and vulnerability studies. The MT survey results provide much improved spatial resolution of Earth Conductivity, with a nominal spacing of 70 km, covering 1084 locations over much of the lower 48 states. The EMTF’s also incorporate 3D Earth conductivity effects which are not possible using the 1D models. A side-by-side comparison of the two models over an interval of about 90 days (March 1989, July 2000, October 2003) found that about 20% of the 1D models correlated poorly with the EMTF-3D models, with most of the discrepancies along the eastern U.S. and parts of the southern U.S. These regions contain key U.S. electrical power infrastructure and users should find the newer results to be a significant improvement in assessing the impact of geomagnetic activity on their systems.
Shown below is a simulation comparing the 1D model (left) and the upgraded empirical EMTF-3D model (right). The maps are taken for one-time step during the extreme geomagnetic storm of March 13-14, 1989 that led to a power outage in the Hydro-Quebec system. The improved spatial resolution is immediately apparent. We also see the stronger E-field response regions along the east coast and across part of the southern U.S. The unfilled areas in the EMTF-3D model are locations where surveys have not yet been done; work to complete the surveys is ongoing and will be incorporated once results are publicly available.
Space Weather Observations for Operations Workshop
On 16-17 June, the National Academies of Sciences, Engineering, and Medicine held a NOAA-sponsored virtual workshop to consider options for continuity and future enhancements of the U.S. space weather operational observations infrastructure. The March 2019 National Space Weather Strategy and Action Plan requires the Federal government to ensure a baseline observational capability, and improve observations for characterizing and improving space weather prediction.
NOAA and other federal agencies provided details on current space weather capabilities to help identify gaps and future needs for space weather products and services. Leadership of the Space Weather Operations, Research, and Mitigation (SWORM) working group summarized U.S. National level plans focused on strategic goals and actions that will help drive advances in observational capability and improve the quality of space-weather products and services. Representatives from both government agencies and industry discussed details of the importance of observations to support priority initiatives such as human space exploration; space traffic management and space situational awareness; commercial aviation, satellite operations, and electricity supply.
Sessions on strategic knowledge and observation gaps focused on the five regions of space weather development: solar, interplanetary, magnetospheric, ionospheric, and ground. Presentations addressed an array of efforts that ranged from the far side of the Sun measurements to observations at the Lagrange 1, 4, and 5 points, to the near-Earth particle environment, to ionospheric and thermospheric measurements gaps. The workshop also explored emerging opportunities offered by small satellites and smallsat constellations, and the emerging capabilities in the commercial sector, including hosted payloads and the practicality of commercial data buys.
Aviation Weather Center Tests Convective Sigmet on Advanced Weather Interactive Processing System
Amanda Terborg (CIRA Development Meteorologist), Bill Cottrill (AWC Senior Meteorologist), Ryan Solomon (AWC SOO), and Jeff Wetter (AWC Meteorologist) assist with the live parallel test of Convective Sigmet production on AWIPS.
On September 9-10, Aviation Weather Center meteorologists, in collaboration with the Aviation Services Branch and AWIPS (Advanced Weather Interactive Processing System) Program Office, conducted a live parallel test of Convective Sigmet functionality on AWIPS. This is part of the ongoing migration from the National Center version of AWIPS (NAWIPS) to AWIPS 2. Jeff Wetter and Andy Fisher performed a simulated shift for the two-day test, using the AWIPS 2 software to issue products in a test mode. Simultaneously, Jeremiah Pyle and Gregory Harris worked the operational shifts; producing and transmitting the real time products. Ryan Solomon, Larry Hinson, Bill Cottrill, and Amanda Terborg were on hand to help with resolution and documentation of problems. In addition, the Aviation Program Office participated through the use of a laptop telcon. The test was successful in finding several software limitations, but also in demonstrating the viability of the new system to perform Convective Sigmet operations. This effort is part of the Multi-phase Transition Strategy which includes Implementation, Readiness and Testing, and Transition.
Climate Prediction Center Issues 2020-21 Winter Outlook
The Climate Prediction Center issued the Winter Outlook for December 2020 – February 2021 via a press teleconference and press release on October 15, 2020. With La Niña developing during the summer, and expected to persist at least through the winter both the temperature and precipitation outlooks are consistent with typical La Niña impacts, which includes a characteristic warmer, drier south and cooler, wetter north.
Specifically, warmer than normal conditions are favored across the southern two-thirds of the continental U.S., along the East Coast, in Hawaii and in western and northern Alaska. In contrast, below average temperatures are favored along the northern tier of the country, from Minnesota to the Pacific Northwest and in southeastern Alaska. Elsewhere, there is no tilt in the odd to above, near, or below average temperature this winter.
The winter precipitation outlook favors wetter than average conditions across most of the northern United States, extending from the Pacific Northwest, eastward to the eastern Great Lakes, and the Ohio Valley, in Hawaii and also in northern Alaska. Drier than normal conditions are most likely across the entire southern U.S. and in southern Alaska.
Heading into winter, the big story this year is likely to be drought. An almost non-existent monsoon season resulted in extreme to exceptional drought in parts of the Southwest extending from west Texas to Colorado and Utah, with significant drought also prevailing westward through Nevada, northern California, and the Pacific NW. Drought is also present in parts of the Northeast, Ohio Valley, Hawaii, and Alaska. Drought is expected to persist in much of this region, particularly in the western half of the nation, in the Ohio Valley and in parts of the Northeast and is likely to develop in California, the central and southern Plains, and in southern GA and Northern Florida. Drought conditions are expected to improve in the northern Rockies, Pacific Northwest, New England, Alaska, and Hawaii.
The press release with a link to a winter outlook video can be found here:
https://www.noaa.gov/media-release/us-winter-outlook-cooler-north-warmer-south-with-ongoing-la-nina
December 2020 – February 2021 Outlooks for temperature (left) and precipitation (right).
Environmental Modeling Center (EMC) Upgrades the Hurricane Weather and Research Forecast (HWRF) model for the 2020 Hurricane Season
NCEP implemented the 2020 HWRF upgrade developed by EMC scientists on Wednesday, July 22, 2020 at 1200 GMT. This upgrade is expected to improve track and intensity forecast skill for tropical cyclones in all ocean basins worldwide. The 2020 HWRF system has been fully tested and compared against the forecast skill of 2019 operational HWRF v12.4.4. Overall, it has shown improved skill in track and intensity forecasts for both North Atlantic (NATL) and Eastern Pacific (EPAC) basins. The 2020 HWRF model includes the following new enhancements: high-resolution land-sea masks for the moving nests, using three-hourly (instead of six-hourly) lateral boundary conditions from GFS, assimilating NEXRAD radial winds from coastal radar sites, assimilating additional satellite observations used in GFS (GOES-16, -17; SNPP, NOAA-20), and initializing the NATL ocean basin with Real-Time Ocean Forecast System (RTOFS) data instead of climatology. The 2020 HWRF also uses a newer version HYCOM for ocean coupling for JTWC basins and update the ocean lateral boundary condition specification, and the unified Ferrier-Aligo microphysics scheme (consistent with the versions used in HMON and NAM) with bug fixes. This upgrade continues decade-long trend of improving HWRF forecast accuracy with support from the HFIP program.
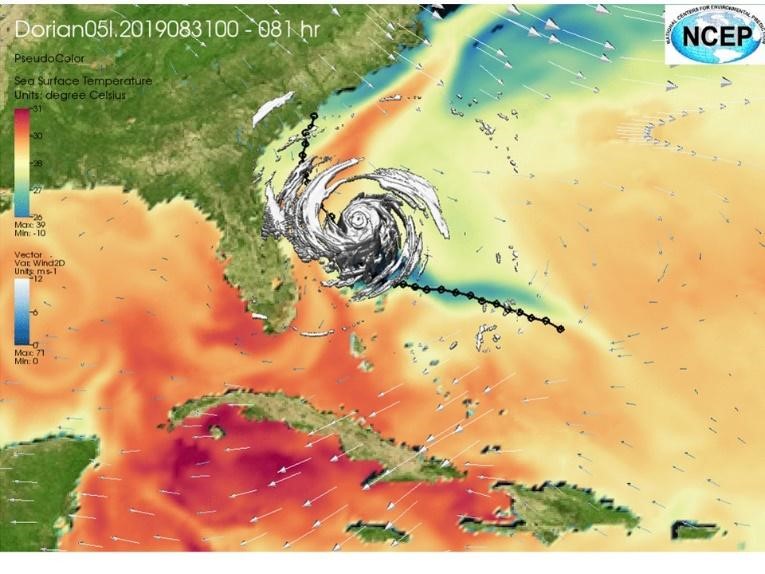
HWRF model output from a retrospective run for Hurricane Dorian, from the 0600 GMT forecast on August 31, 2019. The 81-hour forecast shows Dorian’s vector 2D winds (m/s) and the sea surface temperatures (°C). The forecast run accurately depicted Dorian slowing/stalling over the Bahamas before turning N/NW. Graphics were produced by NCEP/EMC.
Environmental Modeling Center (EMC) Upgrades the two-dimensional Real Time Mesoscale Analysis (RTMA), UnRestricted Mesoscale Analysis (URMA), and the Precipitation Analysis for 2020
NCEP implemented the 2020 RTMA/URMA version 2.8 and Precipitation Analysis upgrade developed by EMC scientists in coordination with stakeholders on Tuesday, July 28, 2020 at 1200 GMT. This upgrade is the last implementation for the 2-D RTMA/URMA, and the next upgrade will be a 3-D system in 2023. Highlights of the RTMA/URMA upgrade include: a similarity theory adjustment for the assimilation of near-surface winds to account for non-standard anemometer heights in mesonet observations, extending the significant wave height analysis to the Great Lakes and Guam, re-tuning the sky cover analysis, a new temperature downscaling for Guam (HiresW Smartinit), Hawaii and Puerto Rico (NAM Smartinit), adding new wind downscaling for CONUS and Alaska (HRRR Smartinit), and doubling the resolution of the Puerto Rico grid from to 1.25 km to match NDFD. The Precipitation Analysis was improved by dropping the legacy Stage II precipitation analysis, using radar-only Multi-Radar Multi-Sensor QPE instead of first-run Stage II/IV for precipitation RTMA, adding 6h/24h snowfall analysis from the National Operational Hydrologic Remote Sensing Center (NOHRSC) to the precipitation URMA, improving the CONUS offshore precipitation analysis by adding a Whittaker blending function to seamlessly merge precipitation datasets.
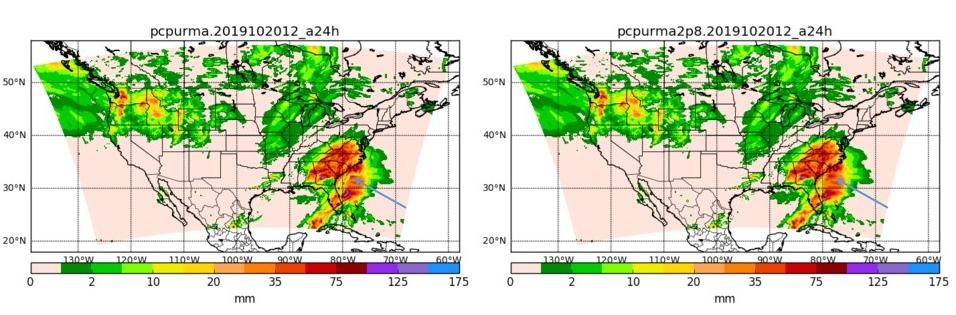
RTMA/URMA analysis of 24-hr precipitation ending at 1200 GMT on October 20, 2019. The analysis from the RTMA/URMA V2.7 is on the left, and the new RTMA/URMA V2.8 analysis is on the right. The new blending function in V2.8 removes a discontinuity between the on-shore and off-shore precipitation datasets. Graphics were produced by NCEP/EMC.
Environmental Modeling Center (EMC) Upgrades the Global Ensemble Forecast System
NCEP implemented the GEFS version 12.0 upgrade developed by EMC scientists on Wednesday, September 23, 2020 at 1200 GMT. The GEFSv12 upgrade includes implementation of Finite Volume Cubed Sphere (FV3) dynamical core, and integration of wave (GWESv3.0.9) and aerosol (NGACv2.5.1) components via coupling following the Unified Forecast System (UFS) framework. The GEFS physical parameterization schemes were upgraded to match the GFSv15.1 including new Geophysical Fluid Dynamics Laboratory (GFDL) microphysics. The ensemble was also expanded from 21 (20 perturbed and 1 unperturbed/control) to 31 (30 perturbed and 1 unperturbed/control) members, and model horizontal resolution was increased to 0.25 degree (~25 km) and maintains the same resolution throughout the forecast period for the atmosphere. Once a day at the 00Z cycle, the forecast length extends to 35 days with the same 31 ensemble members and uniform horizontal resolution, in order to provide weeks 3-4 forecast guidance. During testing, the upgraded GEFS enabled improved severe weather forecasts, including hurricane track and intensity, precipitation, wave heights, and aerosol for all regions across the globe. GEFS will also improve the prediction of week-two tropical cyclone activity, which will help forecasters improve the skill of the Global Tropics Hazard Outlook.
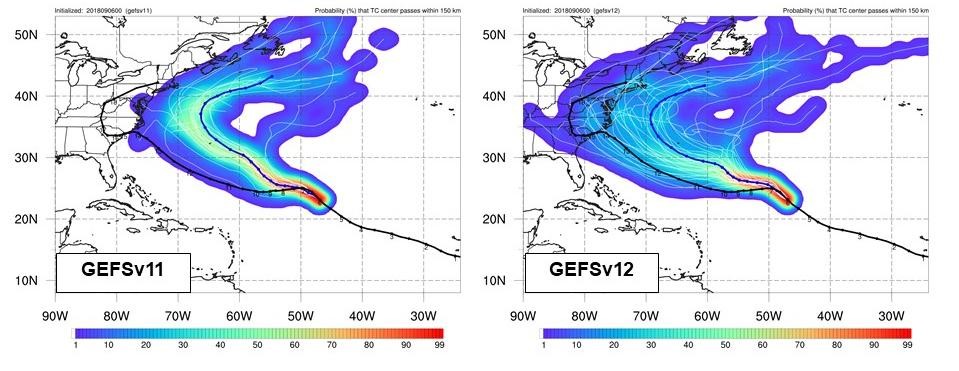
Comparison of GEFS tropical cyclone track forecasts for Hurricane Florence, for a forecast initialized on 00Z on September 6, 2018. The ensemble control is the blue track and the actual track of Florence is in black. The new GEFS (on the right) has improved ensemble spread over the previous GEFS (on the left), where Florence’s track was outside the envelope of possible ensemble solutions. Graphics were produced by NCEP/EMC.
National Hurricane Center has three media pools in just two months
The U.S. was struck by three landfalling hurricanes August and September – Isaias, Laura and Sally. NHC’s mission is the protection of life and property, achieved through advance warnings. A critical element of that is via partners in the media. For more than 20 years, NHC has operated a television media pool during U.S. landfalling hurricanes, providing live interviews to the networks and those local stations in the watch and warning areas.
A media pool went into full operation for each of these three hurricanes. This year, due to the pandemic, no on-site media was permitted except for the pool photographer and pool producer. NHC Director Ken Graham wore a mask for all interviews, as did all other personnel in the facility per CDC and NOAA guidelines. Temperatures checks were taken each day upon entry to the building. With some local broadcast meteorologists working from home, NHC offered evening Skype interviews with Deputy Director Dr. Ed Rappaport. NHC also provided Facebook Live broadcasts four times daily during the media pool, achieving nearly four million views during these hurricanes.

Network pool producer Sarah Chakales (right) and network pool photographer Steve Greenbaum on duty with NHC Director Ken Graham during the media pool for Hurricane Laura, August 24, 2020. (Photo credit: Dennis Feltgen, NOAA Communications)
NHC Deputy Director Dr. Ed Rappaport sets up a media Skype interview regarding Hurricane Laura from his office, August 25, 2020. (Photo credit: Dennis Feltgen, NOAA Communications)
NHC Director Ken Graham provides one of four daily Facebook Live briefings regarding Hurricane Laura as NOAA Communications Officer Dennis Feltgen shoots the video, August 25, 2020. (Photo credit: NOAA Communications)
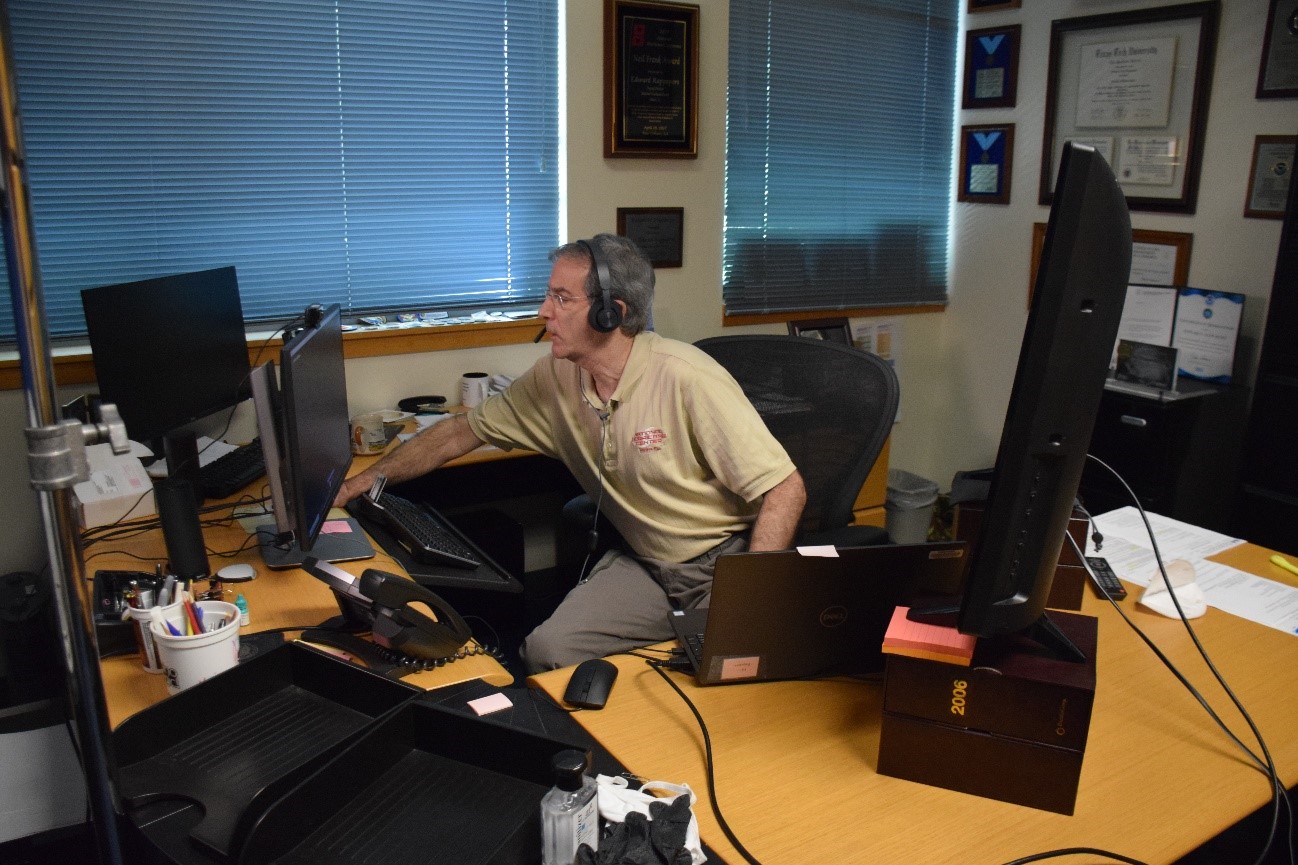
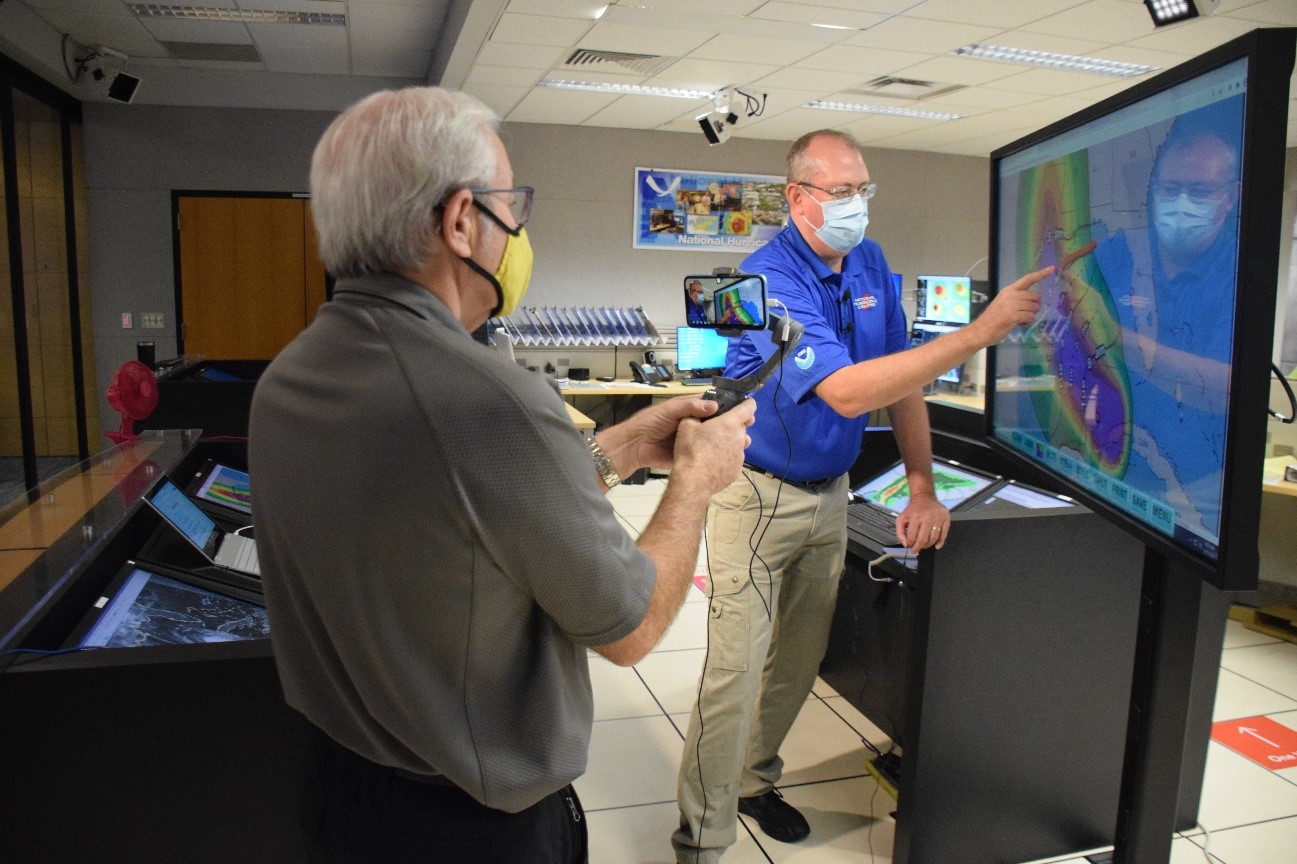
OPC Rallies for the Perfect Storm ‘Avoidance’ in the North Atlantic
"As a major Hurricane Force Extratropical low pressure system ripped across the North Atlantic during the week of 25 October, forecasters from the Ocean Prediction Center (OPC) were busy analyzing data and issuing warnings and forecasts to vessels on the high seas. In the case of this monster storm, OPC was giving indications of extreme weather in this broad area up to five days in advance of its occurrence. This kind of lead time is critical for slow moving vessels (even slower in heavy weather) to avoid dangerous impacts over such a broad ocean area (here, 9m seas over an area roughly equivalent to the Continental U.S.!). While laser focus is usually and appropriately given to land-based impacts of extreme weather, vessels at sea comprise another customer oftentimes more numerous than a coastal community and they are looking to OPC for delivery of that critical and timely weather information to guide their safety decisions. The figures below are telling not only what they show (the warnings for the extreme conditions), but also what they don’t show (vessels in the vicinity of the same). The voids as well as the large numbers of vessels transiting to the south of the area are indicative that mariners are receiving and ‘responding’ with evasion action in response to OPC’s warnings.
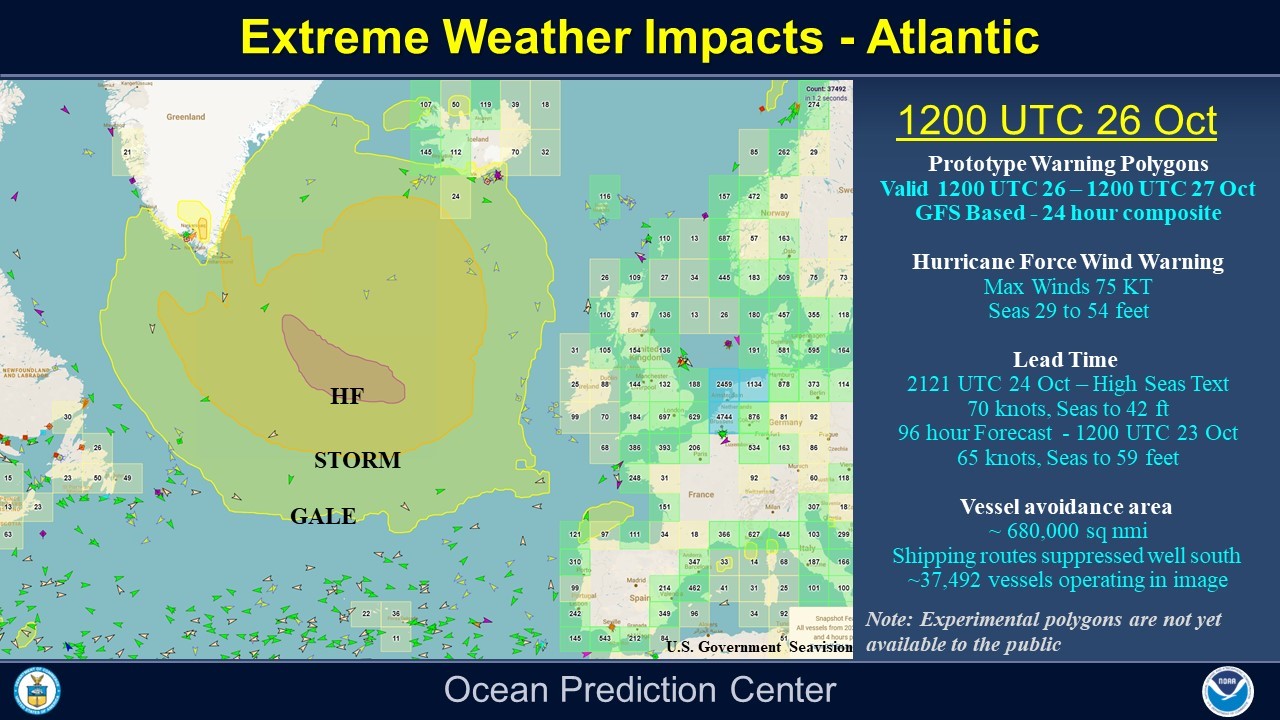
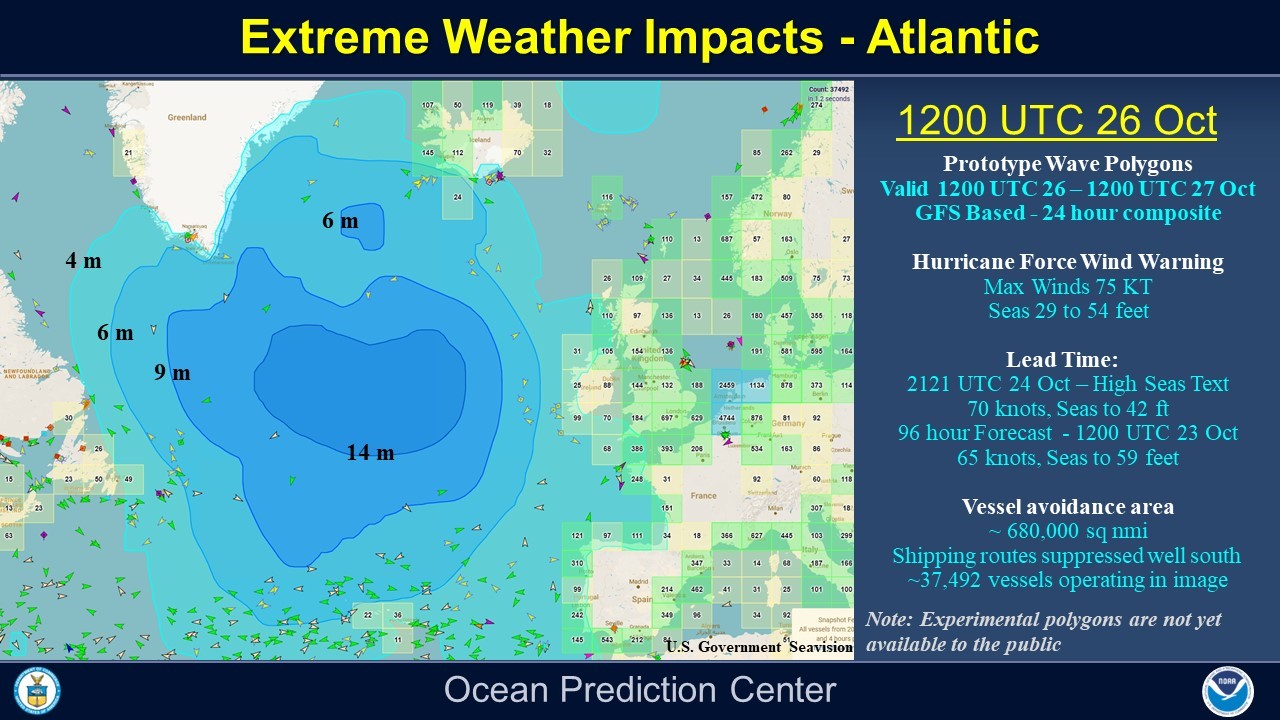
CAPTION: A strong Hurricane Force Extratropical Low Pressure System rips through the North Atlantic. OPC generated hazard warning polygons for extreme winds (top) and seas (bottom). Note the large void of vessel traffic in the areas, indicative of warnings received and heeded.]
OPC produces over 12,000 warnings annually that includes (but is not limited) to warnings associated with 80+ Hurricane Force Extratropical Storms per year on average. These marine weather products and services contribute to a sustainable marine economy through life and cargo saving marine and ice forecasts and warnings to trans-oceanic vessels making about 80,000 U.S. port calls annually, carrying approximately 42% of the value and approximately 71% of the weight of U.S. international trade.
Storm Prediction Center Staff Provides Training to Saudi Arabian Forecasters
On September 29th, SPC Lead Forecaster Jared Guyer and Bill Bunting, Operations Chief, provided an extensive remote presentation overview of the SPC and the severe thunderstorm forecast process to a group of Saudi Arabian forecasters who were in a COMET-sponsored training curriculum. Saudi Arabia typically sees many thunderstorm days each year, especially along the southwest coast adjacent to the Red Sea. The presentation focused on the datasets used by SPC forecasters, including both observational and numerical guidance information that is crucial to the formulation of accurate and timely severe storm outlooks. The discussion also covered SPC risk communication strategies including the use of words, probabilities, colors and numbers to convey risk for a variety of decision makers and the public. The presentation also covered SPC’s Fire Weather forecast mission and ended with a glimpse into the future of SPC’s evolution of forecast services.
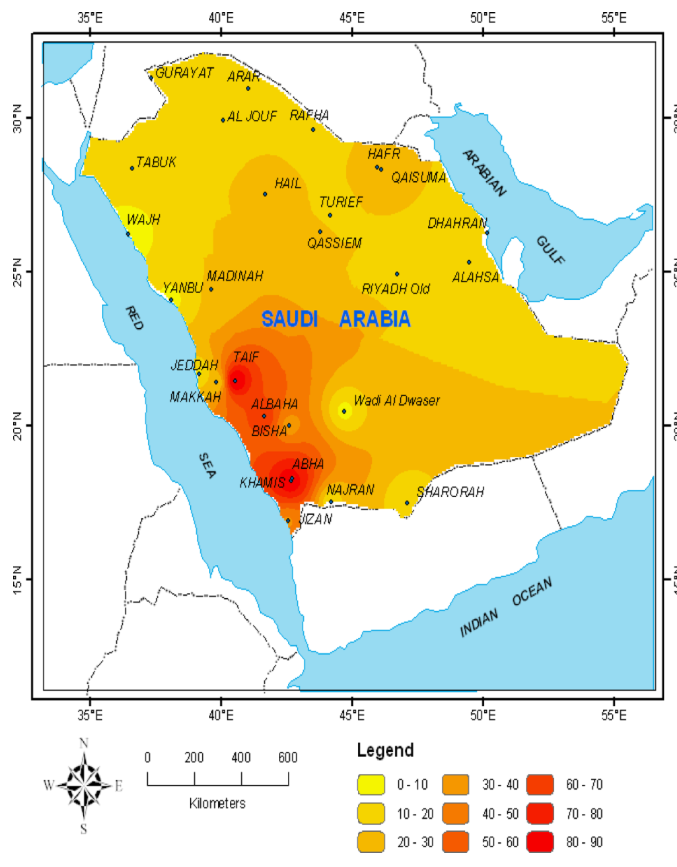
Figure 1: Thunderstorm Days in Saudi Arabia (from Shwehdi, 2006)
A Workshop on Space Weather Operations Infrastructure
In response to the National Space Weather Strategy and Action Plan, the National Academies of Sciences, Engineering, and Medicine hosted a workshop on 9-11 September to consider options for continuity and future enhancements of the U.S. space weather operational observation infrastructure. The workshop sponsors, NOAA, NASA, and NSF, requested a review of the current space weather capabilities in order to identify gaps and future needs for space weather products and services.
The workshop began with sponsor agency leadership, including Steve Volz, the NOAA Assistant Administrator for Satellite and Information Services, providing a review of current and planned U.S. and international space weather-related observational capabilities. Senior officials, including Louis Uccellini, NWS Director, presented on the national and international policy initiatives driving needs for space weather observations. Industry and government leaders discussed requirements for space weather observations in support of critical infrastructure including the electric power grid, satellites and space traffic management, space exploration, and GPS. The keynote speaker – Craig Fugate, former Administrator of FEMA, presented a unique perspective on the needs of the emergency response community. This set the stage for the presentations and panels on both ground- and space-based architectural framework, focused on the five regions of space weather development: solar, interplanetary, magnetospheric, ionospheric, and ground. A final session on architectural framework supporting observations and operations included Brian Gross, Acting Director, NOAA National Centers for Environmental Prediction. This session focused on ensemble modeling and data assimilation, machine learning, and transitioning research observations and models to operations. The workshop was very insightful with many thought-provoking concepts introduced. A report of the proceedings will be produced early in 2021.
Aviation Weather Center Releases Experimental Graphical Forecasts for
Aviation Tool over Alaska and the Northern Pacific Ocean
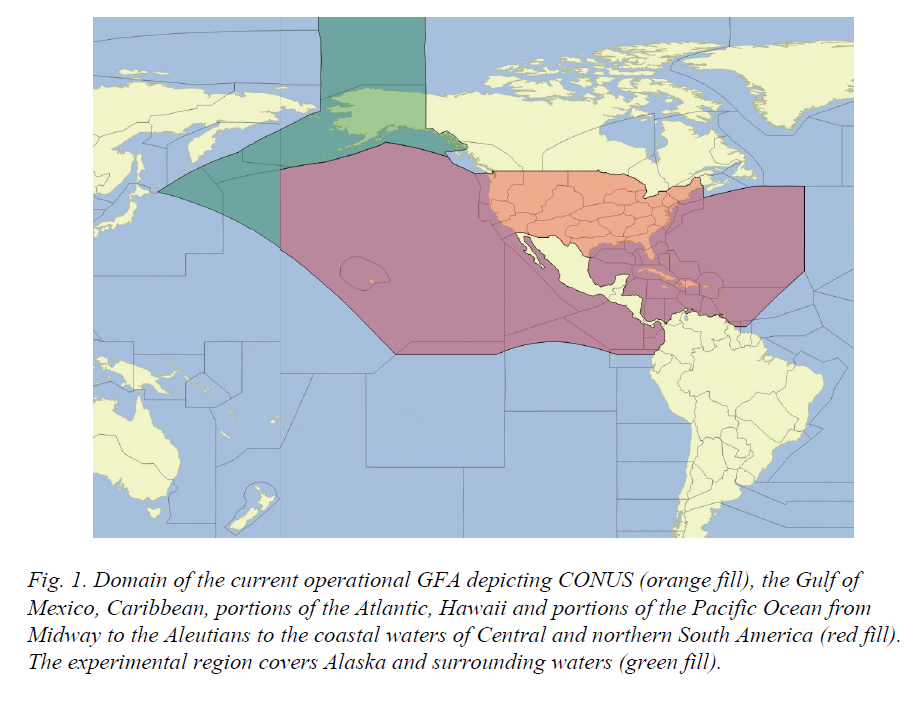
The Aviation Weather Center, in coordination with developers from the Cooperative Institute for Research in the Atmosphere released the Experimental Graphical Forecasts for Aviation (GFA) Tool over Alaska and the North Pacific Ocean on December 10, 2020. This version of GFA is currently open for public review and comment.
The National Weather Service is soliciting comments on the Experimental GFA over Alaska through September 30, 2021. The tool is designed to provide meteorological information in a graphical format equivalent to the legacy text Area Forecast and expands this information over Alaska, the Bering Sea, the Chukchi Sea and portions of the Arctic Ocean. The GFA includes observations and forecasts valid for Alaska and the Alaska Flight Information Regions. Some benefits of this tool include hourly observation and forecast data which is time synchronized across all products, overlays of aviation hazards (such as icing & turbulence) with numerical guidance, inclusion of many map and navigational overlays, and providing all of this information in a “one-stop shop” which enhances flight planning and promotes aviation safety. The GFA is available at: https://testbed.AviationWeather.gov/gfa
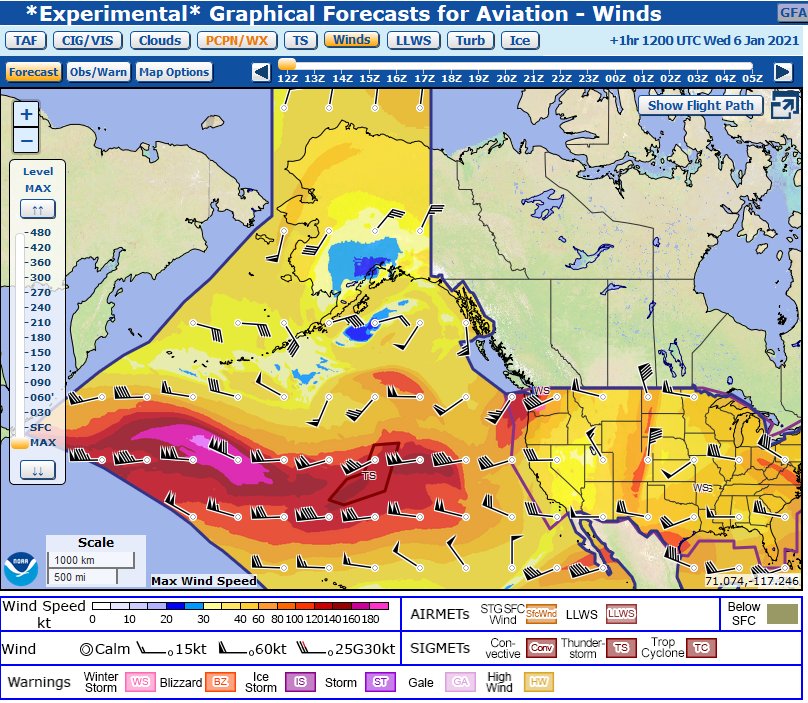
GFA forecast winds across the Northern Pacific Ocean and Alaska.
Environmental Modeling Center (EMC) Upgrades the Real Time Ocean
Forecasting System (RTOFS) model
NCEP implemented the Global Real-Time Ocean Forecast System (Global RTOFS). Version 2.0 on Thursday, December 10, 2020 at 0000 GMT. RTOFS V2 now includes its own high-resolution daily ocean and ice analysis, the RTOFS-DA, replacing the daily analysis previously performed by the US Navy’s Fleet Numerical Meteorology and Oceanography Center used in RTOFS V1. The coupled HYbrid Coordinates Ocean Model (HYCOM) and Los Alamos’s Community ICE model (CICE) were upgraded to incrementally update their states from the RTOFS-DA increments for temperature, salinity, layer pressure and velocity (u,v). This is the first global mesoscale ocean data assimilation system in NCEP operations. RTOFS V2 was fully tested for the 2019 hurricane season and for the May-July, 2020 period. The forecast skill of the 2019 Hurricane models using RTOFS V2 inputs was compared with the operational HWRF v12.4.4 using V1 inputs for the same time period. The RTOFS V2 results show better statistical and forecast skill in comparison to the current operational RTOFS v1.1.4. The Global RTOFS is part of a larger national backbone capability of ocean modeling at the National Weather Service in partnership with the U.S. Navy.
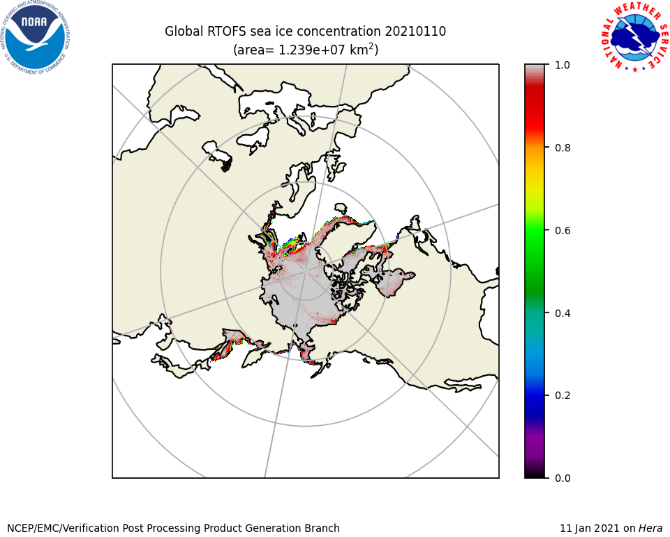
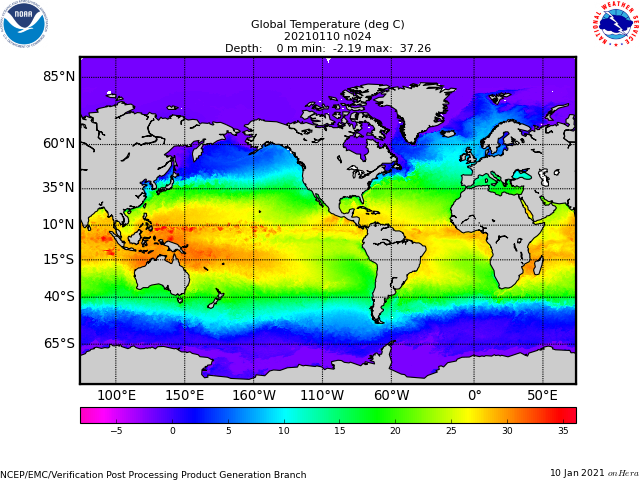
On the left is the sea ice concentration on 10 Jan 2021, generated by the Community Ice CodE (CICE) model in RTOFS. CICE is a computer code developed through community collaboration, which solves a collection of mathematical equations representing the physical processes that occur during sea ice evolution: growth, melting, and movement of sea ice, along with the snow and melt water carried with it. On the right is the Global RTOFS Sea Surface Temperature nowcast valid on 10 Jan 2021. Global RTOFS is based on an eddy resolving 1/12° global HYCOM (HYbrid Coordinates Ocean Model). Graphics were produced by NCEP/EMC.
Environmental Modeling Center (EMC) Upgrades the Rapid Refresh (RAP) model to Version 5 and the High-Resolution Rapid Refresh (HRRR) model to Version 4.
NCEP implemented Version 5 of the Rapid Refresh (RAP) and Version 4 of the High-Resolution Rapid Refresh (HRRR) systems on Wednesday, December 2, 2020 at 1200 GMT. Major changes in this implementation include updated versions of the Advanced Research WRF core of the Weather Research and Forecasting Model (WRF-ARW) model, the Gridpoint Statistical Interpolation (GSI) analysis code, and the Unified Post Processor (UPP); addition of the HRRR-Smoke model application, which allows the system to predict the height and potential direction of transport of wildfire smoke; addition of a storm-scale ensemble data assimilation component for the CONUS HRRR; a new lake model for temperatures for smaller lakes; and the assimilation of NOAA Great Lakes Environmental Research Laboratory (GLERL) water temperatures and ice concentration for the Great Lakes in the CONUS HRRR. The RAP forecast will be extended out to 51 hours for the 03, 09, 15, and 21 UTC cycles. The HRRR forecast (for both CONUS and Alaska) will be extended out to 48 hours for the 00, 06, 12, and 18 UTC cycles. These forecast extensions will facilitate being able to extend HREF products to 48 hours in upcoming HREF Version 3. This will be the final upgrade to the RAP and HRRR models, as they will be subsumed by the Rapid Refresh Forecast System - a rapidly-updating high-resolution ensemble forecasting system using the Unified Forecast System Short Range Weather Application in late 2023.
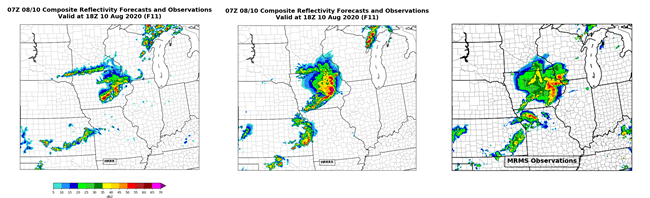
A comparison of the 11-hour HRRR forecasts of composite radar reflectivity against radar observations valid at 1800 GMT on August 10, 2020. The forecast from the HRRR V3 is on the left, the new HRRR V4 is in the center, and the observed radar reflectivity is on the right. HRRRv4 has a much better representation of the threat of a derecho sweeping across eastern Iowa at this time. Graphics were produced by NCEP/EMC.
Environmental Modeling Center (EMC) Upgrades the Unified Post Processing System (UPP) to Version 10.0.2.
This UPP developmental version has been modularized and modernized, and the Relative Humidity (RH) was updated so that the operational North American Model (NAM) algorithm will be used by all models, including the RAP/HRRR and the GFS (for ice conditions). UPP V10 will eventually unify all nine variables that have been computed differently in the RAP/HRRR post processing. Visibility, precipitation types and snow/sleet accumulation are the next variables to be unified, scheduled for Q2FY22. The UPP V10 will be used operationally in the 2023 implementation of the Rapid Refresh Forecast System (RRFS) and in the GFS V17, which is scheduled for implementation in 2024. The UPP is used operationally in the models maintained by NCEP. The UPP has the capability to post-process output from a variety of NWP models, including WRF-NMM, WRF-ARW, Non-hydrostatic Multi-scale Model on the B grid (NMMB), Global Forest System (GFS), and Climate Forecast System (CFS), and Finite-Volume Cubed Sphere (FV3). The UPP development project is a joint collaboration between EMC, Global Systems Laboratory (GSL) and the Developmental Testbed Center (DTC).
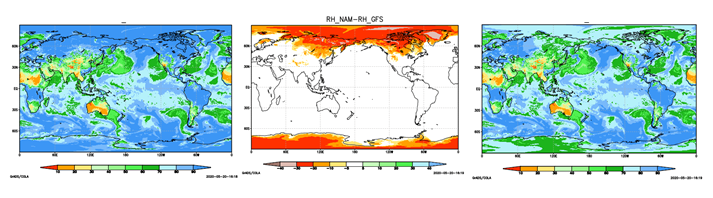
A comparison of the global Relative Humidity (RH) at 500mb, using the current operational GFS algorithm (left) and the unified NAM algorithm (right) for 16Z on 20 May 2020. The RH differences between the two algorithms (center) show the change in RH results in below freezing conditions from the NAM method. Graphics were produced by NCEP/EMC and COLA (Center for Ocean-Land-Atmosphere Studies).
Major Upgrade to NWS Radar Website
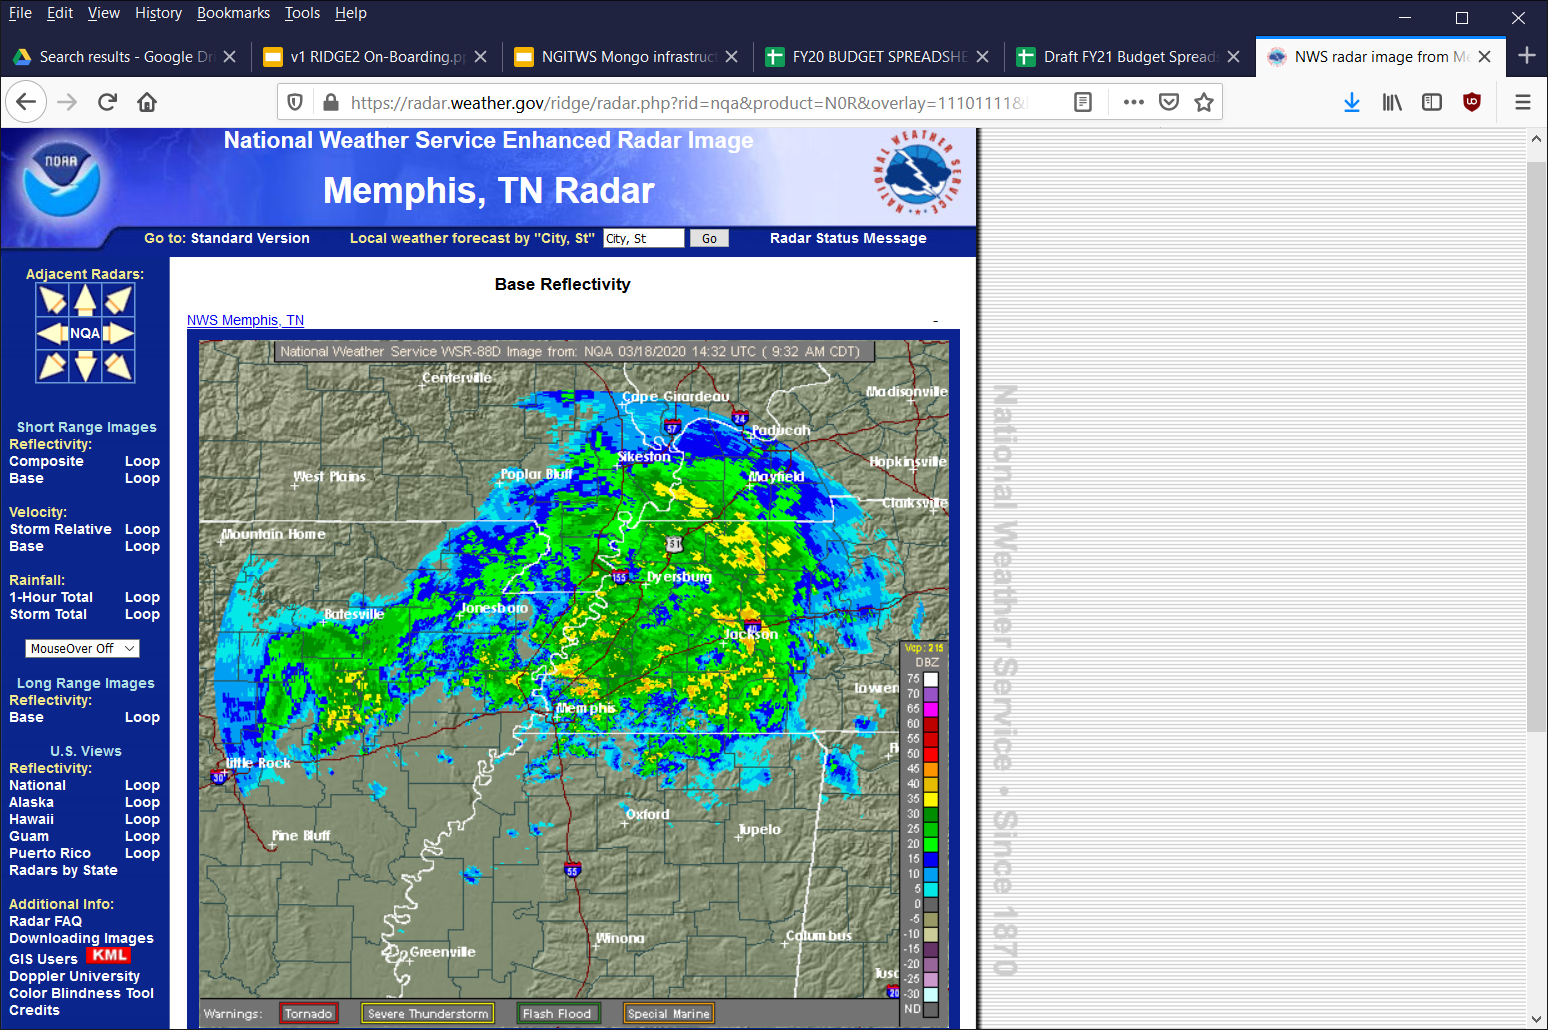
The utilization of radar data by forecasters, emergency managers, and the public is a critical piece of the mission of the National Weather Service (NWS). A joint partnership across numerous organizations within NWS, over 5 years of coordination and development, has resulted in a major upgrade of the application running at https://radar.weather.gov/.
The first version (image below) of this type of publicly available online radar data was called RIDGE (Radar Integrated Display with Geospatial Elements). This first version of RIDGE was an important step in the evolution of the display of radar on public NWS webpages in the early 2000s.
This version of radar was well beyond its life cycle with respect to both software and hardware. On 12/31/2020, the core software, Adobe Flash Player, reached end-of-life. This version of RIDGE was also running on an unsupported Windows 2000 platform, on hardware purchased in 2005. The teams supporting this archaic infrastructure did an amazing job.
This version of radar was well beyond its life cycle with respect to both software and hardware. On 12/31/2020, the core software, Adobe Flash Player, reached end-of-life. This version of RIDGE was also running on an unsupported Windows 2000 platform, on hardware purchased in 2005. The teams supporting this archaic infrastructure did an amazing job.
In August of 2020 a Public Information Statement (PNS) unveiled the official plan for the upgrade of the system and transition it onto NCEP Central Operations (NCO) Integrated Dissemination Program (IDP) platforms in Boulder, CO and College Park, MD. The second version of RIDGE improves on the original and takes advantage of more web-based and mobile-friendly features and utilizes the capabilities of the Multi-Radar Multi-Sensor (MRMS) software. It also moves onto an interactive platform containing Open Geospatial Consortium (OGC) compliant layers, displayed on top of NWS Enterprise Mapping Services (Google™ and/or ESRI™).

This project brought together three development organizations (NCO/SDB, Office of Water Prediction, and Office of Disseminations GIS) and utilized five NCO IDP applications. On Thursday, December 17, 2020, RIDGE II (image on right) became the new operational NWS radar solution. The roll out exposed some infrastructure deficiencies that took several long days and nights for NCO to stabilize the system. But the team worked tirelessly to achieve the goals to obtain a modern, maintainable, and sustainable version of the original RIDGE application that displays radar data, weather warnings and watches in a web mapping application.
Fish Fry closes out record hurricane season
NOAA Administrator joins the event
Staff from the National Hurricane Center and WFO Miami were treated to fresh Louisiana catfish with all the fixings on December 10 to mark the end of the 2020 hurricane season. NOAA Administrator Dr. Neil Jacobs flew in to lend a hand and to personally thank each staff member for the dedication and service provided during the record-breaking season.
The fish fry is the brainchild of NHC director Ken Graham, who spent a decade in Louisiana and knows his catfish. He had 30 pounds of the fish flown in fresh for what has become an annual event. Storm surge specialist Jamie Rhome, who is an avid fisherman, dried and prepped the fish and Ken handled the deep fry cooking duty. Administrative members Jannette Perez, Petra Gonzalez, and Carmen Rodriguez assembled the meals with hushpuppies, corn on the cob, coleslaw, and a baked potato.
The annual event usually takes place on the patio but, to keep within the current health guidelines, the meals were handed to each person in a drive-thru car line. After that, there was the option of going home or parking in the field to enjoy the meal while practicing social distancing.
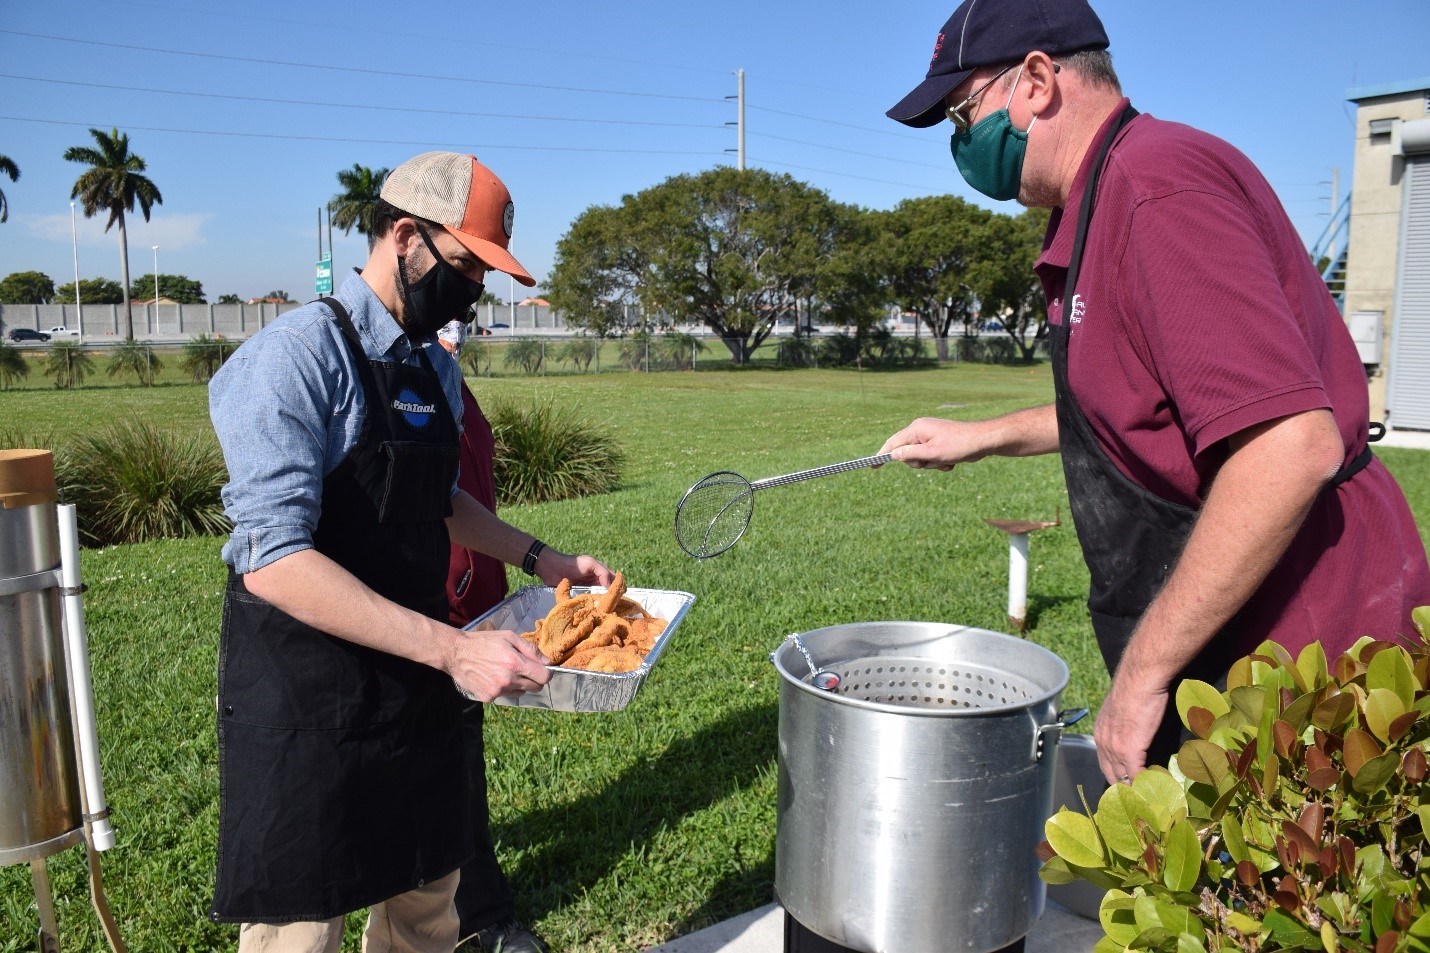
NOAA Administrator Dr. Neil Jacobs collects the fried catfish from NHC Director Ken Graham during the NHC fish fry, December 10, 2020. Photo credit – Dennis Feltgen, NOAA Communications
Record number of media pools at NHC
Skype availability added to toolbox
Cristobal, Isaias, Laura, Sally, Delta, Zeta, and Eta - seven hurricanes that were part of the record 2020 Atlantic hurricane season. Each forced hurricane warnings for portions of the U.S coastline and, as a result, a record seven media pools at NHC. Typically, national news/weather outlets and those affiliates in the watch/warning areas are alerted to the opportunity of obtaining live interviews with NHC regarding the storm. A network freelance photographer/camera is brought in to shoot live interviews with the NHC Director, Deputy Director, or other specialist in 5-minute windows arranged by an on-site pool producer.
But due to the current health crisis, many of the TV meteorologists were working outside of their broadcast studios, unable to access the pool via traditional methods. To address that problem, NHC expanded its media pool to include Skype. Interviews with NHC Deputy Director Dr. Ed Rappaport were offered during the late afternoon and evening hours for each of the seven storms. To follow social distances rules, lights were set up in his office along with a large screen depicting the satellite imagery and expected hazards. A total of 40 Skype interviews were done and NHC plans to make this a permanent option.
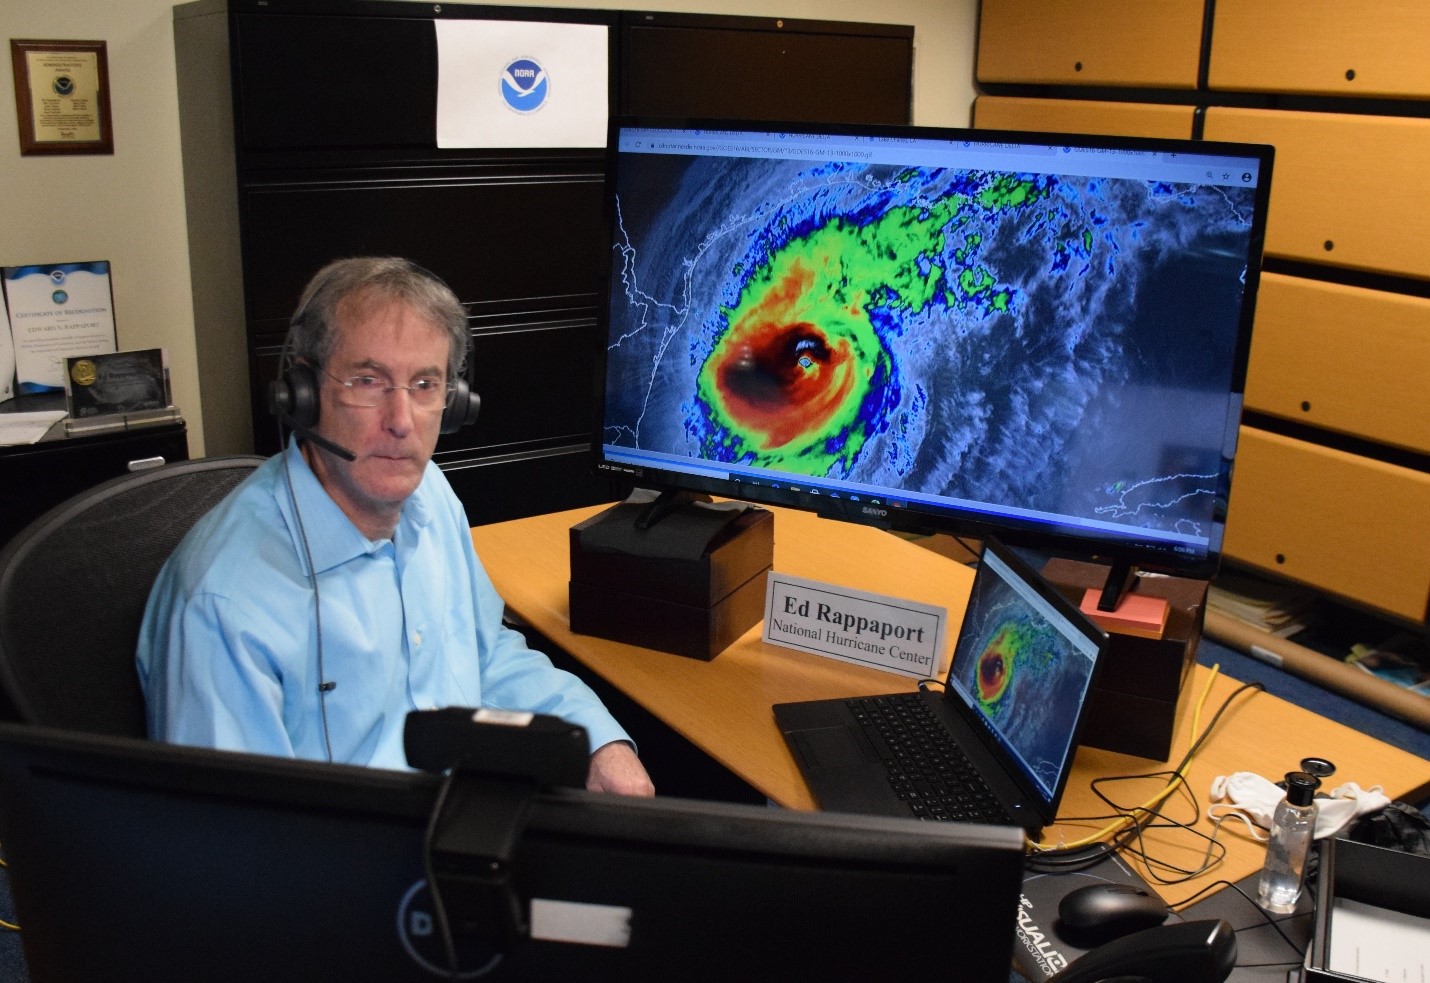
NHC Deputy Director Dr. Ed Rappaport provides a live Skype interview regarding Hurricane Delta, October 8, 2020. Photo credit – Dennis Feltgen, NOAA Communications
OPC Supports Joint Rescue Coordination Center Pacific in Search for Missing Fisherman
The Ocean Prediction Center partnered with the U.S. Coast Guard’s Joint Rescue Coordination Center in Honolulu from late December through mid-January and provided IDSS for a search and rescue operation. The tuna longliner Yong Yu Sing No. 18 dropped out of contact with her owners in late December, just as a major storm system was approaching her area of operations approximately 530nm northeast of Midway Island. OPC confirmed the presence of a strong Hurricane Force storm in the vessel's vicinity on December 29-30.

CAPTION: The abandoned long line fishing vessel Yong Yu Sing No. 18 (Image courtesy of the U.S. Coast Guard)
U.S. Coast Guard air reconnaissance revealed that the vessel was afloat, but damaged and with no crew in sight. A liferaft was noted missing. As an active search by air for the crew of the apparently abandoned vessel continued, the Coast Guard also needed marine forecasts to plan a board and search operation of the vessel. In response, OPC provided spot forecasts of marine wind and wave conditions like the one depicted here.
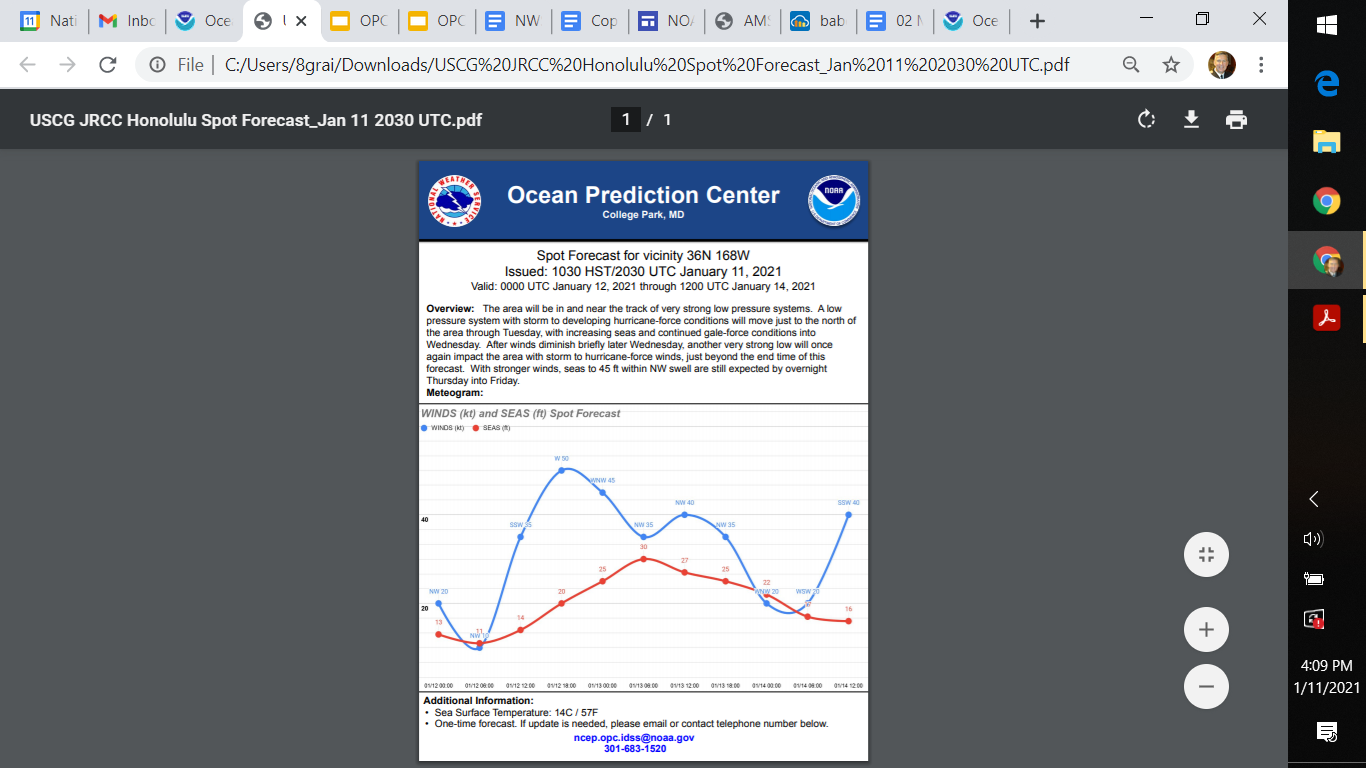
CAPTION: OPC’s last spot forecast issued in support of JRCC Honolulu. Note that dangerous marine conditions persisted throughout.
Unfortunately, the storm track remained persistent over the area for the next two weeks and hindered boarding. Also, the crew were never sighted by air reconnaissance or nearby fishing vessels that came to assist. On or about 14 January, the search and rescue effort was called off and turned over to the Taiwainess Search and Rescue Coordination activity.
OPC produces over 12,000 warnings annually that includes (but is not limited) to warnings associated with 80+ Hurricane Force Extratropical Storms per year on average between both the north Atlantic and Pacific oceans. While most vessels heed and respond to these life and cargo saving forecasts by taking evasion action, some constrained by mission or other factors, choose to accept the risk, and often at great cost.
Storm Prediction Center Develops Thunderstorm Risk Days as Part of 2020 Year-In-Review
Storm Prediction Center staff have developed an innovative approach to summarize the year’s overall risk from thunderstorms. Most graphics that depict the geographic variation in thunderstorm risk rely on surface weather observations of thunderstorms from across the nation, or lightning flash detections from remote sensing systems. SPC Techniques Development Meteorologist Matt Elliott took a different approach, developing the map below by combining all SPC forecasts of thunderstorms for the year 2020 from the Day 1 Convective Outlooks. This approach provides a potentially useful perspective on thunderstorm risk during the year since SPC forecasts are used routinely by local NWS WFOs, broadcast media, and emergency management officials to anticipate and respond to thunderstorm threats. The graphic is one component of a comprehensive Year-In-Review Summary of severe storm and fire weather risks across the contiguous U.S. that will be available via the SPC webpage in January.
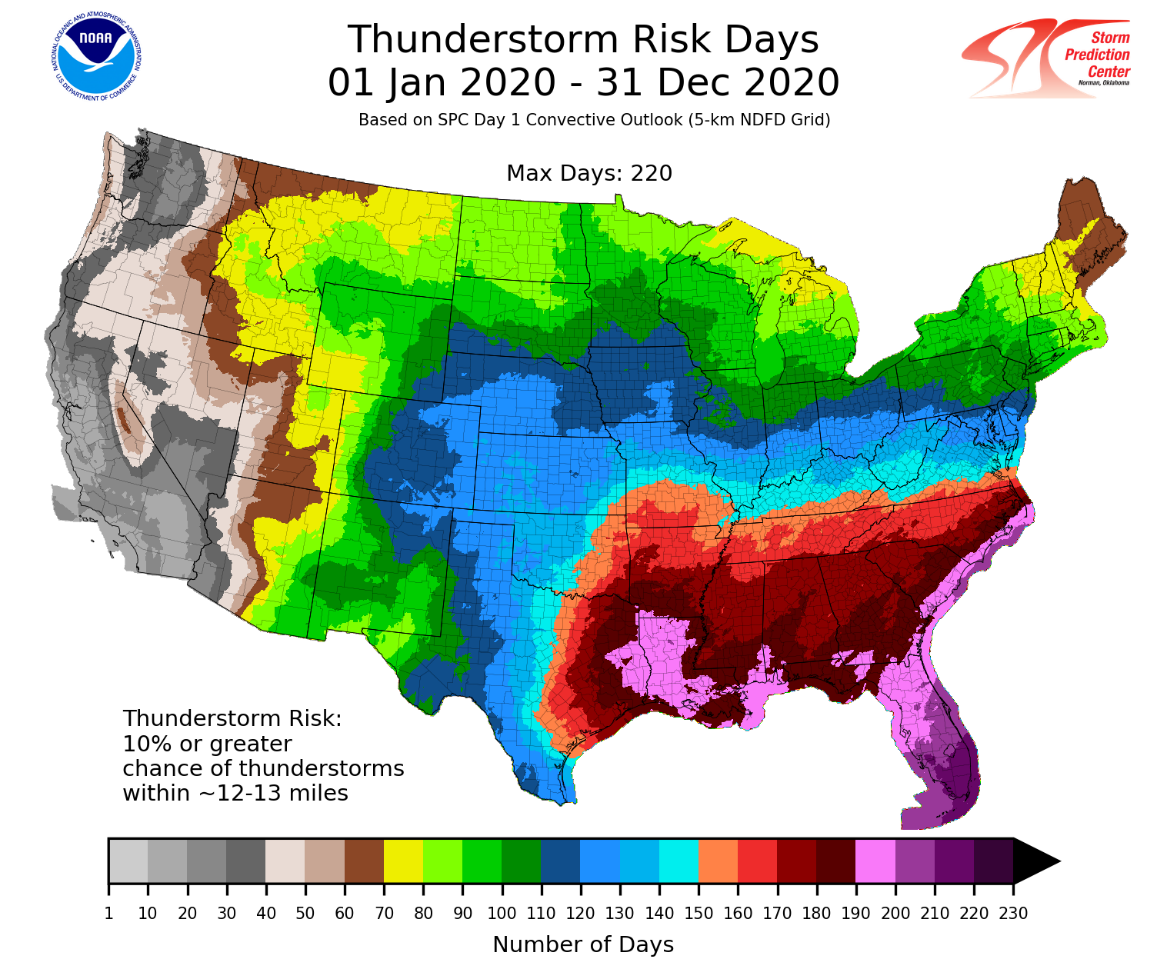
Figure 1: Thunderstorm Risk Days for the year 2020 across the contiguous U.S., developed by combining all Storm Prediction Center Day 1 Convective Outlook areas in which a 10 percent or greater risk of thunderstorms was forecast within 40 km grid box.
President Signs Space Weather Act
On October 21, 2020, the President signed the Promoting Research and Observations of Space Weather to Improve the Forecasting of Tomorrow (PROSWIFT) Act. The Act codifies many actions in the 2019 National Space Weather Strategy and Action Plan. The Act garnered unanimous and strong bipartisan support in Congress. It establishes that space weather phenomena pose a significant threat to the Nation’s critical infrastructure, and establishes that it is the policy of the United States to prepare and protect against the social and economic impacts of space weather.

The Act identifies roles and responsibilities for federal agencies, ensures an interagency government body to implement actions, and directs the development of formal mechanisms for the transition of research to operations. It also establishes a Space Weather Advisory Group for the federal government to receive advice from the academic community, the commercial space weather sector, and space weather end users. The Act also recognizes that space weather observations provide crucial data necessary to understand, forecast, and prepare for space weather phenomena, and are essential for the success of human and robotic space exploration.
The signing statement from the President recognized that the Act does not address the resilience of national security assets or critical infrastructure to the effects of space weather, and that Congress must do more to reduce vulnerability.
AWC/EMC/NCO Implements Higher Resolution WAFS Hazard Grids
New 0.25 horizontal degree WAFS hazard grids were fully implemented on March 31st,
2021. These grids provide global icing and turbulence severity forecasts.
The NWS Display of WAFS Grids for Turbulence, Icing, Cb Cloud and Wind is a graphical representation of the grids issued jointly by the World Area Forecast Centers (WAFCs) in the US and the UK. These grids are sanctioned by the ICAO and the FAA for use in flight planning. They are available for various levels from forecast hours 6 to 36, in three hourly time steps, in GRIB2 format. This product provides users a way to display the grids at all levels and time steps via a web page with a GIS display. Users are able to overlay multiple levels and forecast parameters and loop through the time range, as well as pan and zoom on the map.
The purpose of the display is to provide a rudimentary way to visualize the WAFS Grids for Turbulence, Icing, Cb Cloud and Wind. The intended users are software vendors that design flight planning software, plus airline dispatchers and air traffic managers. This visualization is intended for users who need to check that their own display software is correctly decoding the GRIB2 files and properly displaying the gridded data in graphical format. It is also intended to serve as a common reference point for the NWS and its customers when discussing the WAFS forecast data.
The new icing severity forecasts, provided for FL060, FL100, FL140, FL180, FL240 and FL300, brings improved algorithms and incorporates temperature, cloud fraction, vertical velocity and cloud liquid + cloud frozen water content. Instead of providing a value in the 0 to 1 (or 0 to 100% range) the data is categorized into icing intensities.
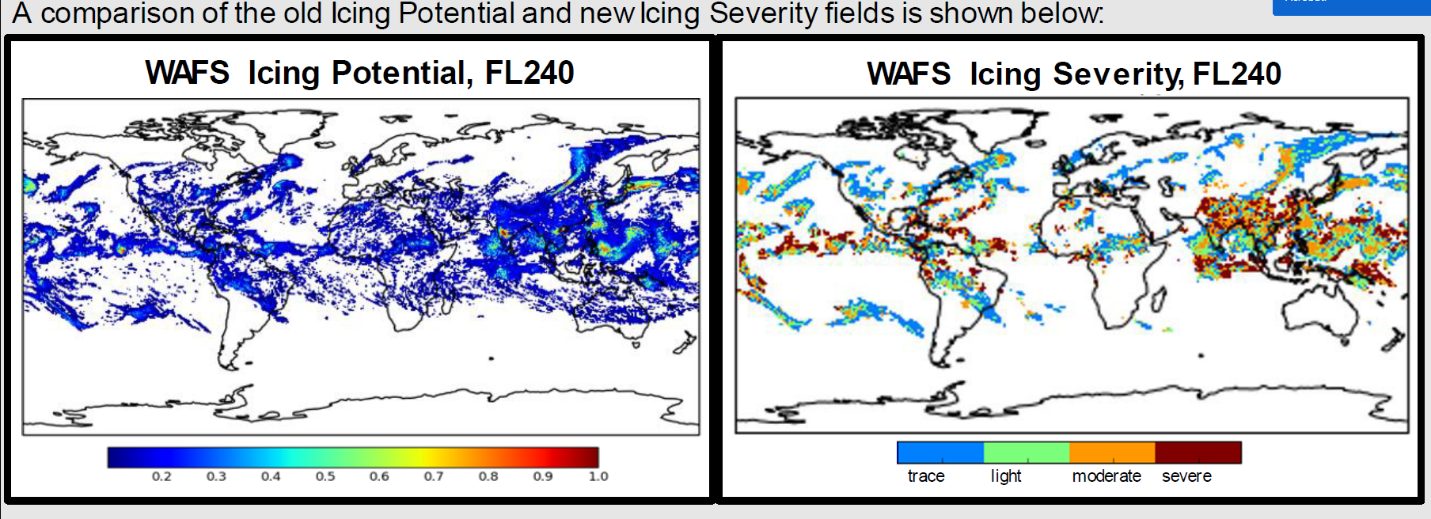
The new Icing Severity field contains much more distinct icing areas. More moderate/severe icing is forecast, particularly in the tropics; this is due to an improvement in the way convective icing is calculated.
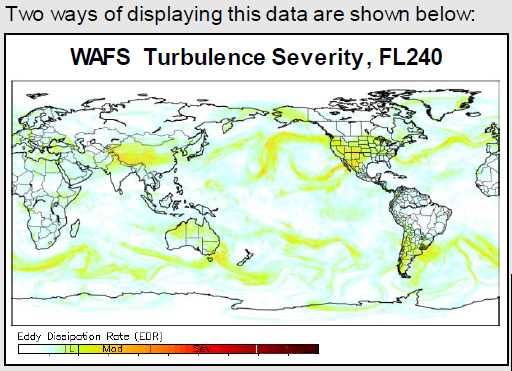
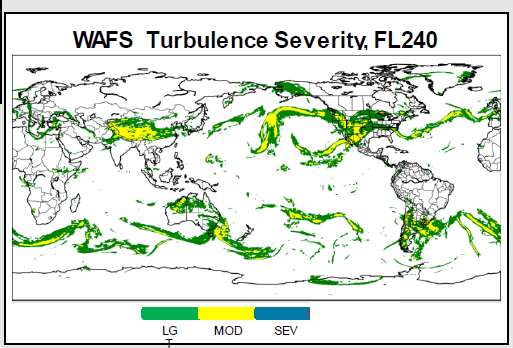
The new turbulence hazard grids, provided for FL100, FL140, FL180, FL240, FL300, FL340, FL390 and FL450 uses a multi-diagnostic algorithm, Graphical Turbulence Guidance (GTG) developed by the National Center for Atmospheric Research (NCAR). GTG forecasts clear air and orographic turbulence, and will provide output in terms of Eddy Dissipation Rate (EDR). EDR is an aircraft independent measure of turbulence, represented by values of 0 to 1.
There is no change to the algorithms being used to calculate cumulonimbus extent, base and top but they will be provided at 0.25 degree resolution.
Climate Prediction Center Issues 2021 Spring Outlook
The Climate Prediction Center (CPC), along with the Office of Water Prediction (OWP), issued the Spring Outlook via a press release, press teleconference, and video on March 18, 2021. The Spring Outlook identifies areas at risk of spring flooding and expectations for temperature, precipitation and drought from April through June. The temperature outlook favored warmer-than-average temperatures from coast-to-coast with the exception of Western Montana, northern Idaho, and parts of Oregon and Washington. Hawaii, western and northern Alaska are also forecast to see above-normal temperatures. Below-normal temperatures are most likely for parts of southern Alaska, the Alaska Panhandle and parts of Washington state. Above-average precipitation is favored for parts of the Midwest, the Great Lakes, the Mid-Atlantic, the Northeast and in Hawaii, while below-normal precipitation is forecast across the southern Plains and much of the West.
The seasonal flood outlook indicated the potential for limited moderate flooding this spring, with no areas having a greater than a 50% chance of major flooding for the first time since 2018. Widespread minor to moderate flooding is predicted across the Coastal Plain of the Carolinas while minor to isolated moderate flooding is predicted for the Lower Missouri and Lower Ohio River basins. Overall, this flood year is not expected to be severe or as prolonged as the previous two years
Drought is the larger issue as nearly one-half of the country — stretching from the Pacific Coast to the Great Plains and upper Midwest — is currently experiencing moderate to exceptional drought conditions, and that is expected to continue and expand during the Spring.
The press release with a link to a spring outlook video can be found here:
https://www.noaa.gov/media-release/spring-outlook-drought-to-persist-expand-in-us-west-and-high-plains

EMC
Environmental Modeling Center (EMC) Upgrades the Global Forecast System (GFS)
NCEP implemented the Global Forecast System (GFS) Version 16.0 on Monday, March 22, 2020 at 1200 GMT. GFS version 16.0 is the first major upgrade to the Finite Volume Cubed Sphere (FV3) dynamical core-based GFS, which replaced the spectral dynamical core in June 2019. The number of model vertical layers increased from 64 to 127 and the model top was raised from the upper stratosphere (~55 km height) to the mesopause (~80 km height). GFSv16 was also coupled to the operational standalone global deterministic WAVEWATCH III wave model Multi_1. The GFS model physics were upgraded to include a new gravity wave parameterization scheme, a new scale-aware turbulent kinetic energy based moist eddy-diffusivity mass-flux vertical turbulence mixing scheme to better represent the planetary boundary layer processes, and an RRTMG radiation package update to improve solar radiation absorption by water clouds. The GFS Data Assimilation system was also upgraded to include an offline land model with observed precipitation in the Global Land Data Assimilation System to provide improved land initial conditions, using the Local Ensemble Kalman Filter (LETKF), employing the 4-Dimensional Incremental Analysis Update (4D-IAU) technique, accounting for the inter-channel correlated observation errors for Cross-track Infrared Sounder (CrIS) over sea surfaces and Infrared Atmospheric Sounding Interferometer (IASI) over sea and land, and assimilating new satellite observations. Based on real-time and retrospective testing, GFSv16 showed improved 500-hPa height anomaly correlation scores and synoptic patterns in the medium range, including better position of relevant frontal boundaries; a mitigation of a cool season low-level cold bias seen in GFSv15; increased identification of tropical cyclone threats; improved snowfall location and amounts with longer lead times; improved ability to capture the temperature profile in shallow, cold air masses; and improved forecasts of stratospheric temperature, circulation, ozone and water vapor.
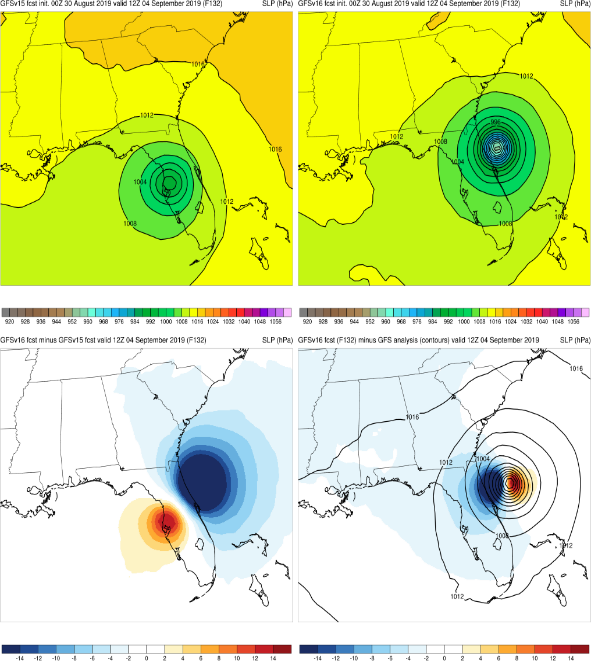
GFSv16 and GFSv15 132-h forecasts initialized on 00Z 30 August 2019 and valid on 12Z 4 September 2019, showing TC Dorian. From left to right are the sea level pressure plots from GFSv15 and the GFSv16, the difference between GFSv16 and GFSv15 sea level pressures, and the difference between the GFSv16 forecast and the GFS Analysis at 12Z on 4 September 2019. GFSv16 forecasted Dorian’s right turn to skim the Florida east coast, instead of moving west across Florida into the Gulf of Mexico, 36 hours earlier than the GFSv15. Graphics were produced by NCEP/EMC.
Commercial Data Utilized in Space Weather Model
Real-time commercial radio occultation data are now available and being ingested continuously into a data assimilation model of the ionosphere, and the Space Weather Prediction Center (SWPC) is evaluating the utility of these data for its operational products. The NOAA Commercial Space Policy calls for NOAA to validate the viability of adding commercial environmental data into its models. Under the current data-purchase agreement, GeoOptics, Inc. will provide 1300 radio occultations per day for a six-month period that began March 17, 2021. SWPC developed its real-time system to utilize this new data stream and has been processing the commercial data since the measurements began. These data cover the high-latitude regions where strong space weather disturbances occur, filling a gap caused by the cancellation of the COSMIC-2B mission.
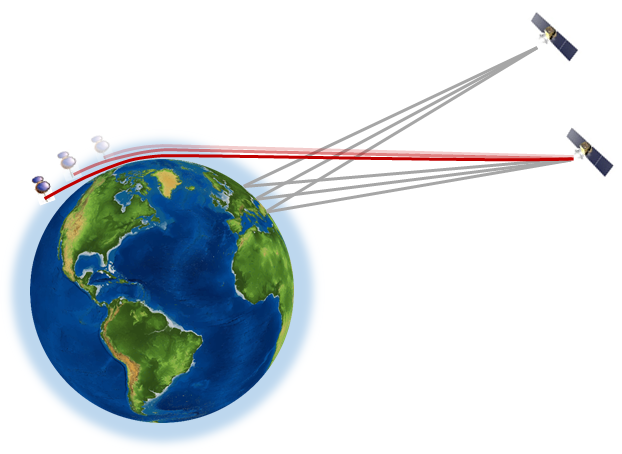
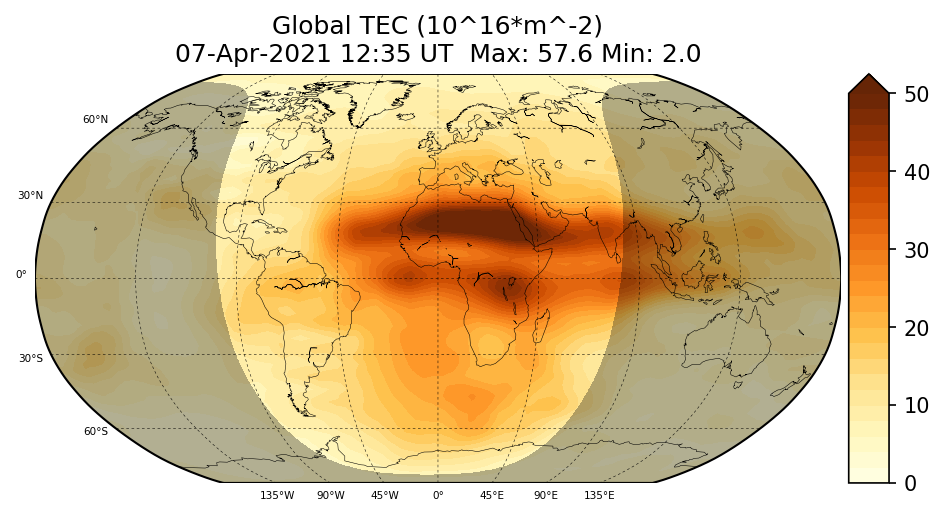
Figure: (Left) schematic diagram of the bending of radio signals from the Global Navigation Satellite System to low-Earth orbiting satellites as the signals traverse the ionosphere; and (right) sample output from the Global Total Electron Content (GloTEC) data assimilation model that is now ingesting the commercial radio-occultation data.
Aviation Meteorologists Host Virtual Convective Weather Flight Planning Workshop
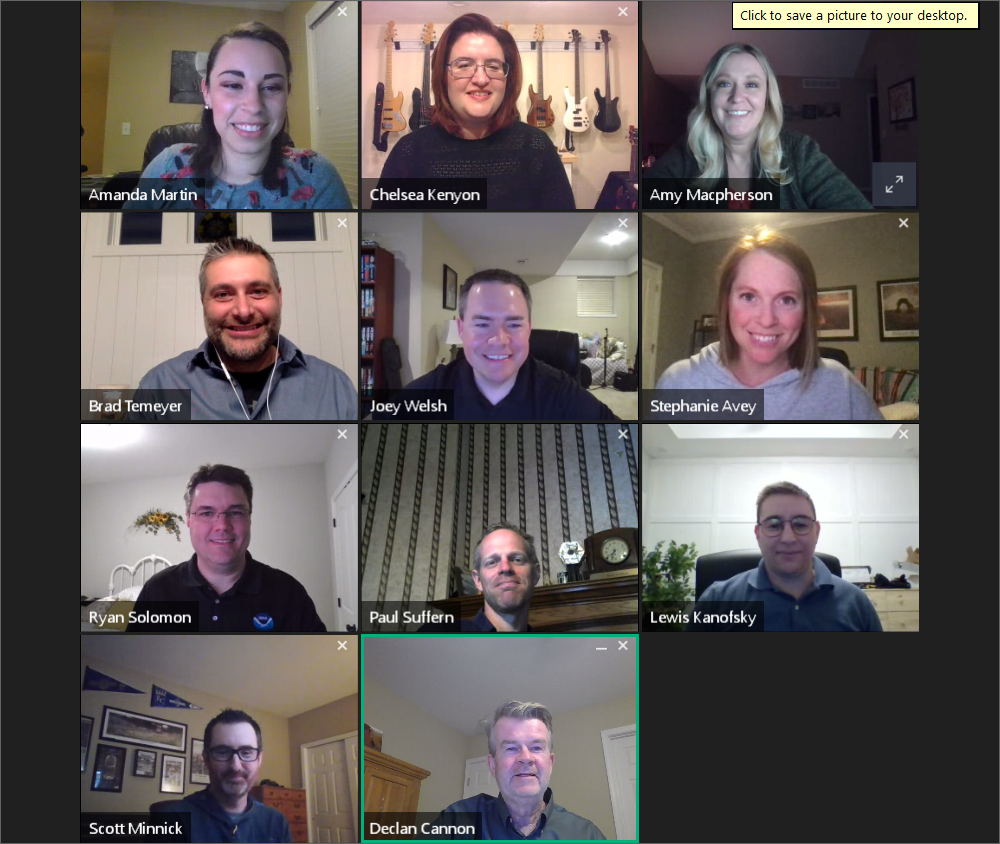
Meteorologists from the Aviation Weather Center, Central Weather Service Unit Olathe, Weather Forecast Office Kansas City, and National Transportation Safety Board during the Virtual Convective Weather Flight Planning workshop
The NWS FLYERS (FLYing Education Resources and Safety) hosted a virtual spring workshop on April 7. Attendees were able to earn WINGS credit with over 125 pilots participating in the event. The workshop was titled Convective Weather Flight Planning and highlighted convective weather products available from WFOs, CWSUs, and AWC. Multiple briefers (Declan Cannon, Joey Welsh, Ryan Solomon, Brad Temeyer, Chelsea Kenyon, Amanda Martin, Amy Macpherson, Stephanie Avey, and Bill Cottrill) provided a variety of content, and Lewis Kanofsky managed the chat. The first session included topics such as Thunderstorm Types and Hazards, Convectively Induced Turbulence, and an NWS Thunderstorm Product Overview. The second session focused on two different aspects of the flight planning process; prior to departure and end-route. Attendees were shown several of the products and features available on the Aviation Weather Center website. Stephanie Avey presented information on how pilots can participate in the Aviation Weather testbed that is offered each year. The workshop concluded with Paul Suffern, an NTSB meteorologist, discussing a thunderstorm accident case study.
Comments included the following,
After the workshop a survey was developed and sent to the attendees. This will help improve additional virtual workshops and assist in the development of effective training in the future. The webinar was posted to the NWS FLYERS YouTube channel and all attendees received a follow-up email with pilot resource material. This included aviation weather links, a trifold describing aviation services within the National Weather Service, and information on the Weather-Ready Nation Ambassador Program.
The Climate Prediction Center (CPC) issued its 2021 Atlantic hurricane season outlook on May 20, calling for a 60% chance of an above-normal season, a 30% chance of a near-normal season and only a 10% chance of a below-normal season. However, we do not anticipate the historic level of storm activity seen in 2020. This outlook is produced in collaboration with hurricane experts from the National Hurricane Center (NHC) and the Hurricane Research Division (HRD). The 2021 Atlantic hurricane season outlook was presented during a virtual national press teleconference led by Gina Raimondo, Dept. of Commerce Secretary and Ben Friedman, Acting NOAA Administrator. The CPC’s Matt Rosencrans (Lead Seasonal Forecaster) also spoke and then addressed scientific questions and did numerous media interviews.
NOAA predicted a likely range of 13 to 20 named storms (winds of 39 mph or higher), of which 6 to 10 could become hurricanes (winds of 74 mph or higher), including 3 to 5 major hurricanes (category 3, 4 or 5; with winds of 111 mph or higher). Similar to last year, the combination of several climate factors is driving the strong likelihood for above-normal activity in the Atlantic this year. El Nino Southern Oscillation (ENSO) conditions should remain either neutral or trend toward La Nina, meaning there will not be an El Nino present to suppress hurricane activity. Also, warmer-than-average sea surface temperatures in the tropical Atlantic Ocean and Caribbean Sea, coupled with reduced vertical wind shear, weaker tropical Atlantic trade winds, and an enhanced west African monsoon all increase the likelihood for an above-normal Atlantic hurricane season. Similar conditions have been producing more active seasons since the current high-activity era began in 1995. NOAA will update its Atlantic Hurricane Season Outlook in early August.
The statistics used to determine when hurricane seasons are above-, near-, or below-average relative were updated to the latest climate record this year. Based on the update an average hurricane season now produces 14 named storms (up from 12), of which seven become hurricanes (up from 6), including 3 major hurricanes (no change).
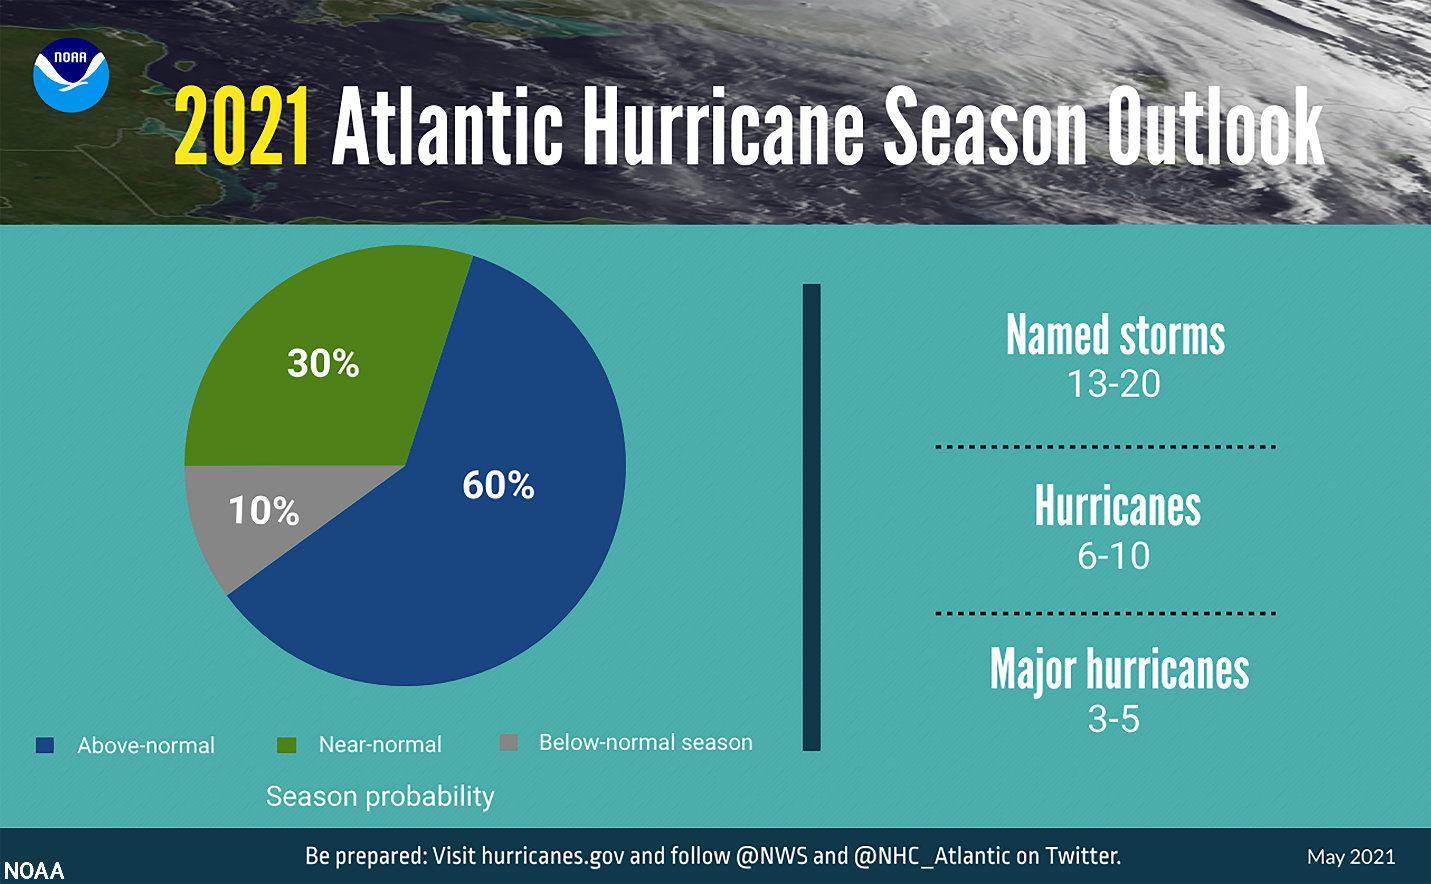
NOAA’s 2021 Atlantic hurricane season outlook issued May 20, 2021. This probabilistic outlook reflects the expected seasonal activity for the entire Atlantic basin, which includes the North Atlantic Ocean, Caribbean Sea, and Gulf of Mexico. The outlook is not a seasonal landfall forecast, and it does not predict levels of activity for any particular region.
EMC
Environmental Modeling Center (EMC) Upgrades the High Resolution Ensemble Forecast (HREF) and High-Resolution Window (HIRESW)
NCEP implemented the HREF Version 3 and HiResW Version 8 on Tuesday, May 11 at 1200 GMT. For HiResW V8, a Finite Volume Cubed Sphere (FV3) model replaced the Nonhydrostatic Multiscale Model on B-grid (NMMB). The HiResW-FV3 has an increased resolution (from 3.2 to 3.0 km horizontal grid spacing, and from 50 to 60 levels in the vertical), and its forecast range is extended from 48 to 60 hours. All HiResW-FV3 domains are now initialized from a 6 hour old cycle of the Global Forecast System (GFS). The HiresW-FV3 also includes a physics change, to the GFS-style physics from the NAM-style physics of the NMMB. In the HREF V3, the new HiResW-FV3 replaced the HiResW-NMMB member for all HREF domains. The High Resolution Rapid Refresh (HRRR) and a 6-hour time-lagged HRRR run were also added as new members for the CONUS and Alaska domains. The HREF membership size increased from 8 to 10 for CONUS, and from 6 to 8 for Alaska. Hawaii and Puerto Rico domains continue with 6 members. The HREF forecast length was extended from 36 to 48 hours for all domains. New HREF products include an Ensemble Agreement Scale (EAS) probability type for select PQPF and snow products, a Localized Probability Matched (LPM) Mean for QPF, probabilities of QPF exceeding Average Recurrence Intervals (e.g., a 100 year event), Flash Flood Guidance (1, 3 and 6 hours), a new “lightning” product, and new probability thresholds for QPF and wind speed that were requested by the field. The EAS and LPM products were developed under R2O projects. The extended model forecast lengths will be helpful for Day 2 hazard assessment. The new LPM QPF produces a more representative forecast, and the EAS probabilities are shown to be useful in terrain and at lower QPF thresholds. The HREFv3 showed better representations of tropical cyclones in its evaluation.
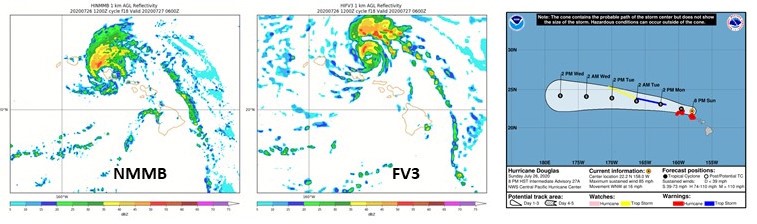
HiResW NMMB versus FV3 18-h forecasts, initialized on 12Z 26 July 2020 and valid on 06Z 27 July 2020, showing Hurricane Douglas. From left to right are the 1 km radar reflectivity from the NMMB, from the FV3, and the official track forecast for Douglas on 12Z on 26 July 2020. The FV3 forecast correctly kept Hurricane Douglas to the north of Oahu. The replacement of NMMB with FV3 in the HREF has benefitted HREF forecasts of tropical systems. Model plots were produced by NCEP/EMC. Hurricane track product was produced by NCEP/NHC.
National Hurricane Center deputy director retires from federal service
Edward Rappaport, Ph.D., retired from federal service and the National Hurricane Center on May 31st. His more than 40-year career in meteorology comprises positions in forecasting, research, administration, management, academia and the media. He’d been with NHC for 33 years. Since 2000, he served as its Deputy Director and, in stints totaling seven years - including the 2007 and 2017 hurricane seasons, its acting director. Ed and his wife plan to split their time between South Florida during the winter and spring and the Oregon coast and environs during the summer and fall.
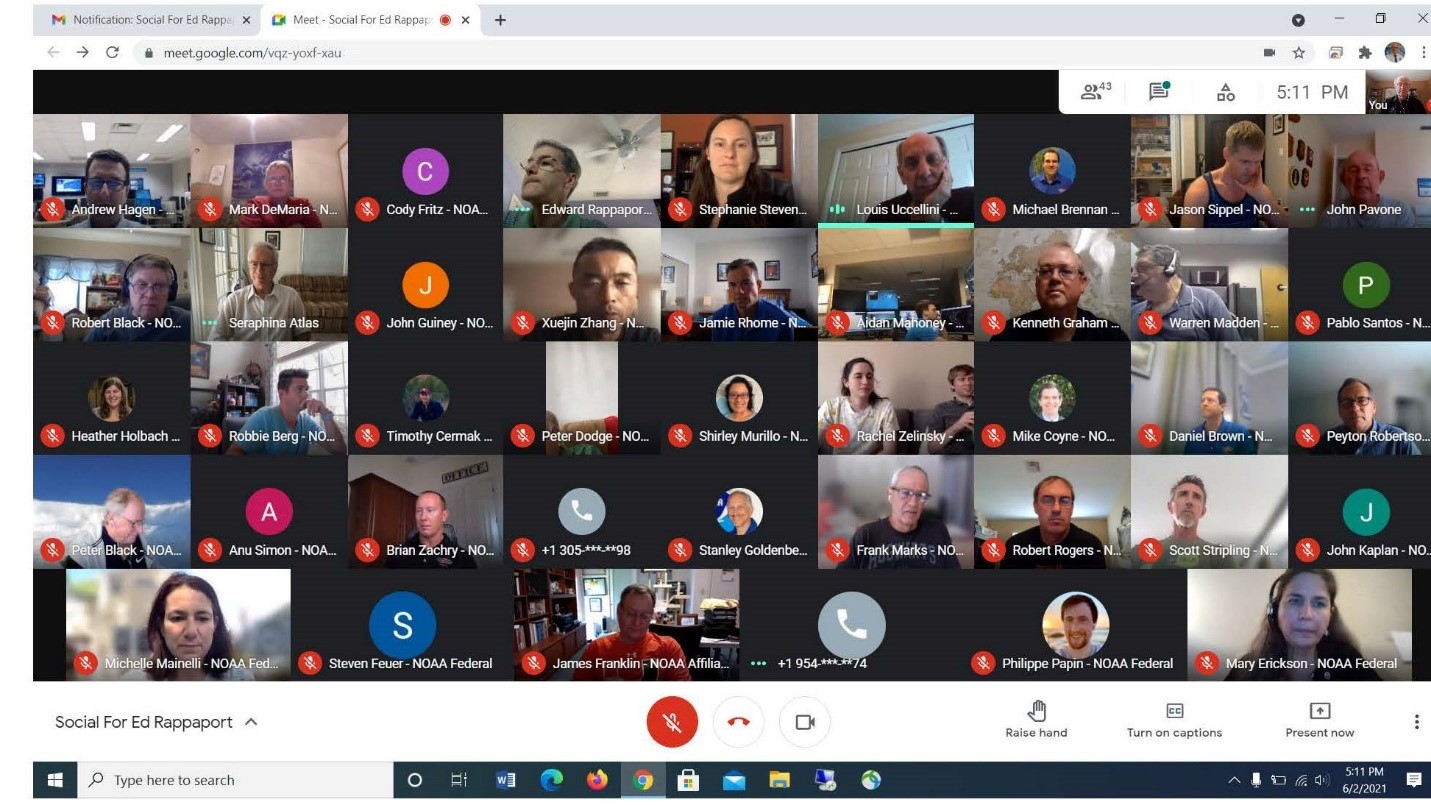
NWS Assistant Administrator Dr. Louie Uccellini and Deputy Assistant Administrator Mary Erickson joined several dozen NHC staff members during a social media recognition of Dr. Ed Rappaport upon his retirement. June 2, 2021 (Photo credit: Dennis Feltgen - NOAA Communications)
U.S. Senator Rick Scott visits National Hurricane Center
With the official start of the Atlantic hurricane season on June 1st, U.S. Senator Rick Scott (R-Fla.) visited the National Hurricane Center and the NWS Miami WFO. Scott met privately with NHC Director Ken Graham to gain some insights into the 2021 hurricane season and to the operational needs of the NHC needs. From there, Graham led a tour of the facility, with the senator taking the time to personally greet those who were on duty. Stops included the FEMA liaison office, CARCAH (hurricane hunters), the Hurricane Operations Area, the Tropical Analysis and Forecast Branch (TAFB) and the Miami WFO. Afterward, the Senator provided a media availability, emphasizing the importance of preparing now for the season.
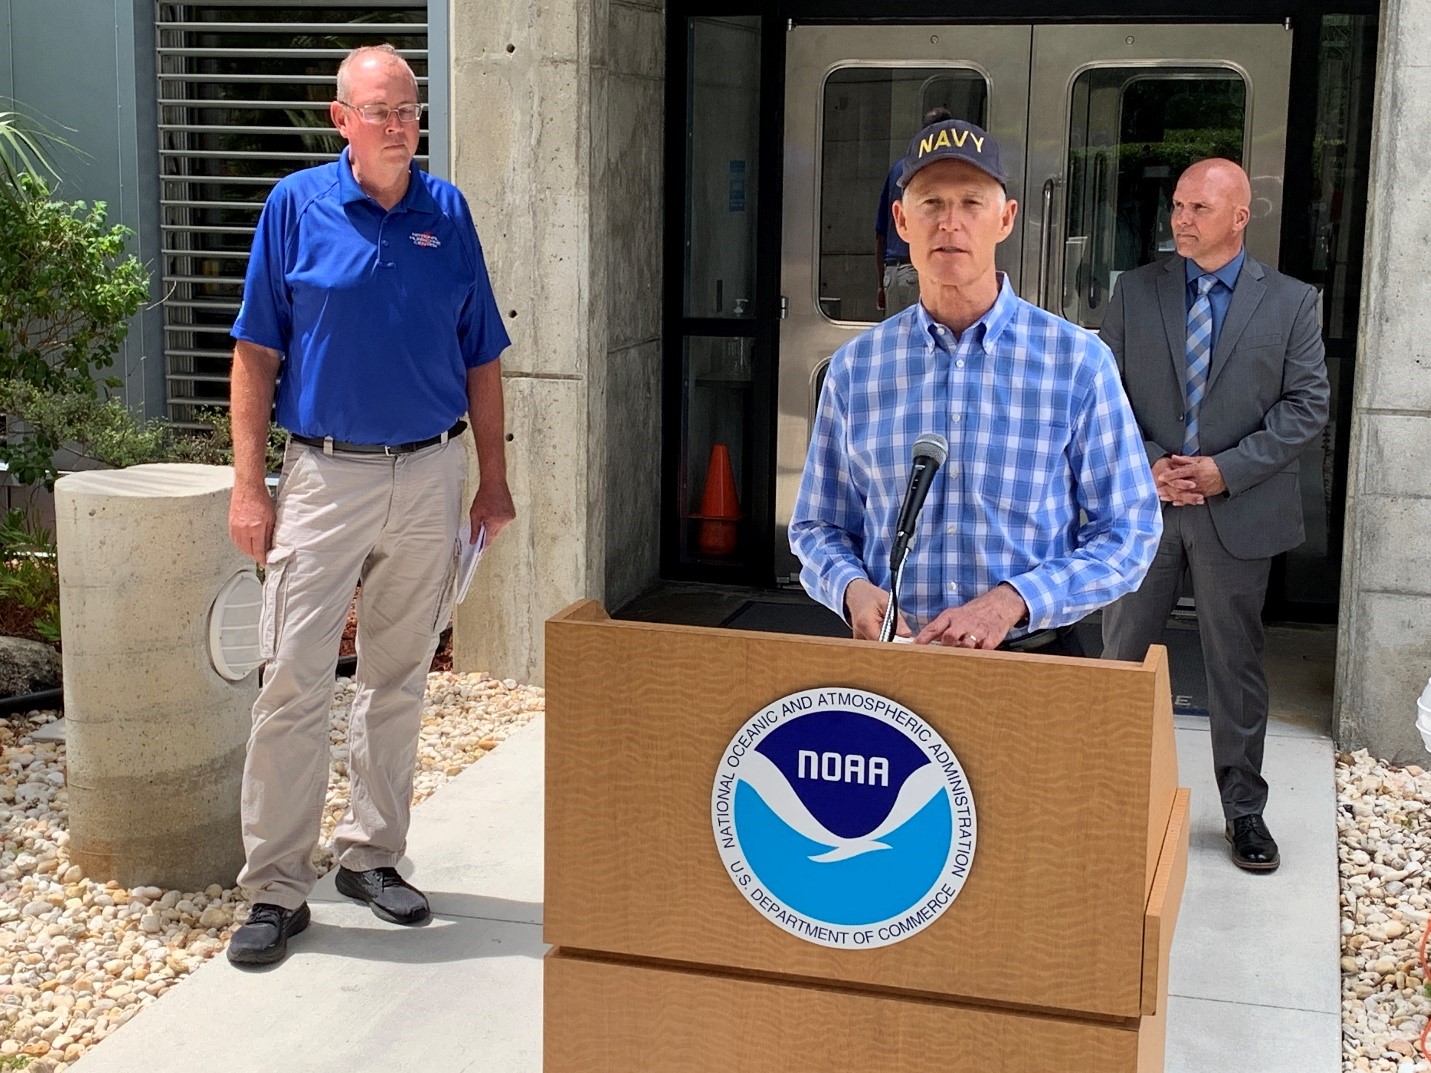
NHC Director Ken Graham (left) meets with U.S. Senator Rick Scott (R-Fla.) for a briefing on the 2021 hurricane season. June 1, 2021 (Photo credit: Dennis Feltgen - NOAA Communications)
First named storm of the Atlantic hurricane season sweeps over the Southeast.
It’s only June, but three named storms have already moved over different parts of the Atlantic basin. On June 19th, Tropical Storm Claudette became the first to strike the U.S. mainland.
Claudette is a prime example of why NHC emphasizes there is no such thing as "just" a tropical storm. Impacts of wind and water can be just as dangerous and deadly as those of a hurricane. To date, Claudette is responsible for four direct fatalities - two from wind and two from freshwater flooding. There were 10 indirect fatalities from a traffic accident on I-65 in Alabama. These statistics are subject to change, however.
NHC provided several Facebook Live broadcasts to emphasize the wind and water threat, even while the system was still classified as a Potential Tropical Cyclone. There were more than 100,000 views.
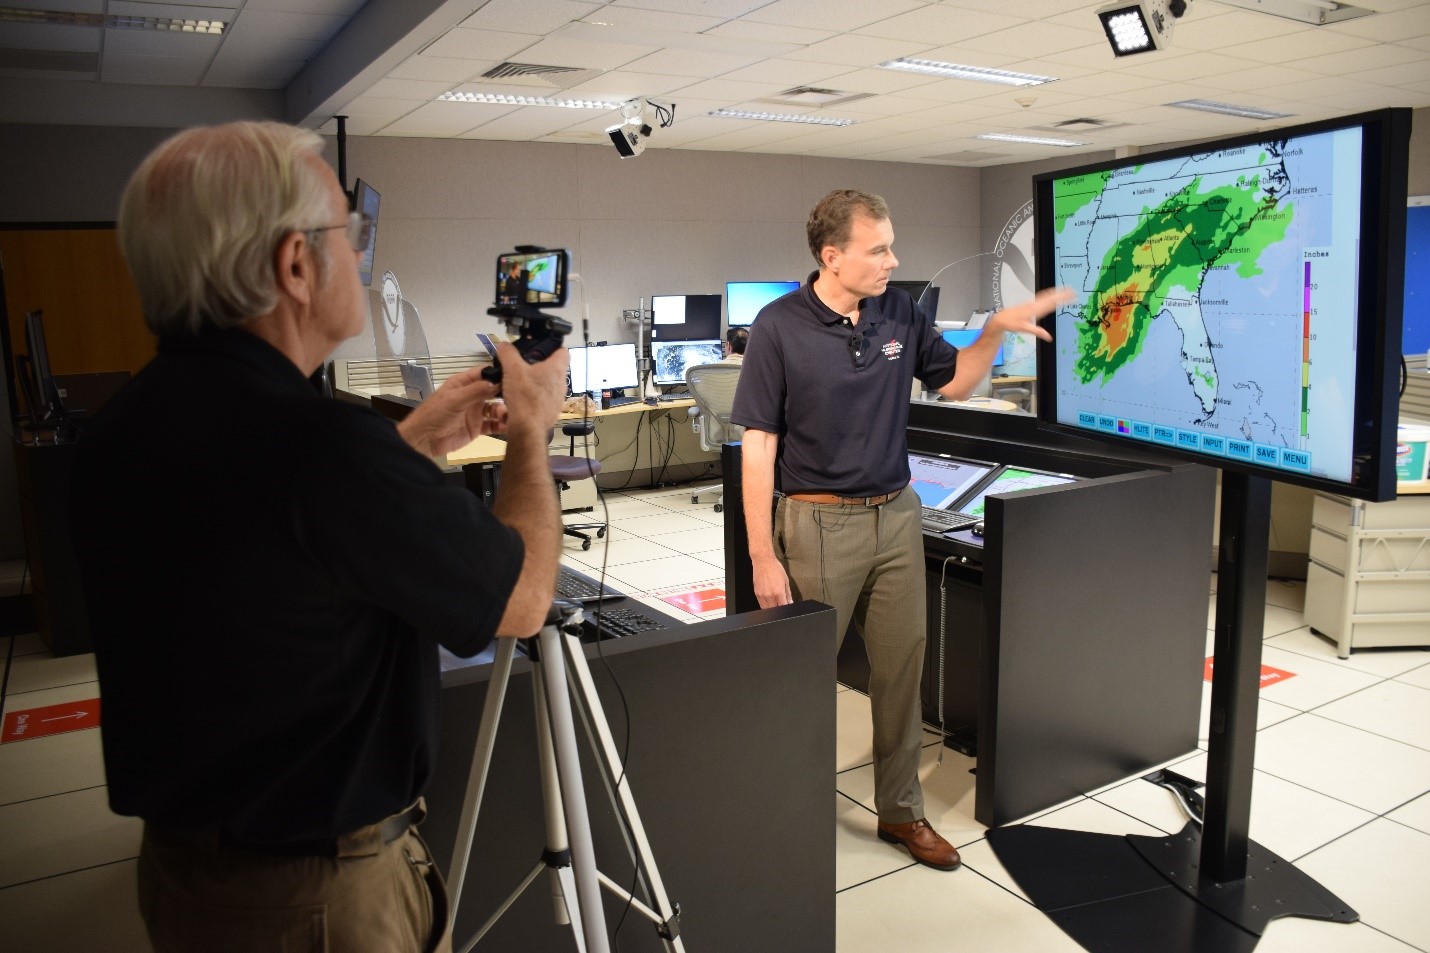
NHC (acting) Deputy Director Jamie Rhome provides a Facebook Live broadcast with the latest information regarding Potential Tropical Cyclone Three. It would become Tropical Storm Claudette the next morning as it moved inland over Louisiana. June 18, 2021. (Photo credit: Bryan Zachry)
Storm Prediction Center Hosts Second Consecutive Virtual Hazardous Weather Testbed Spring Forecasting Experiment
The annual Hazardous Weather Testbed (HWT) Spring Forecasting Experiment (SFE), organized and hosted by the Storm Prediction Center (SPC) and the National Severe Storms Laboratory (NSSL), was conducted virtually from 3 May to 4 June 2021. With an additional year of planning for the second consecutive virtual HWT SFE, several improvements were made over the previous year, including more focused model evaluation activities and expanded forecasting activities to all participants. Over 130 people participated over five weeks, which included participants from local Weather Forecast Offices and the Environmental Modeling Center in the NWS, OAR Laboratories, NOAA Cooperative Institutes, NCAR, academia, and various international research and forecasting agencies. The 2021 HWT SFE focused on using CAM and CAM ensembles to make experimental forecasts of severe convective weather, followed by evaluating the performance of these models on the following day. While there are important aspects of the experiment that cannot be replicated online, the virtual HWT SFE was successful in meeting its scientific objectives and in bringing the severe weather and modeling communities together to work on common problems of interest.
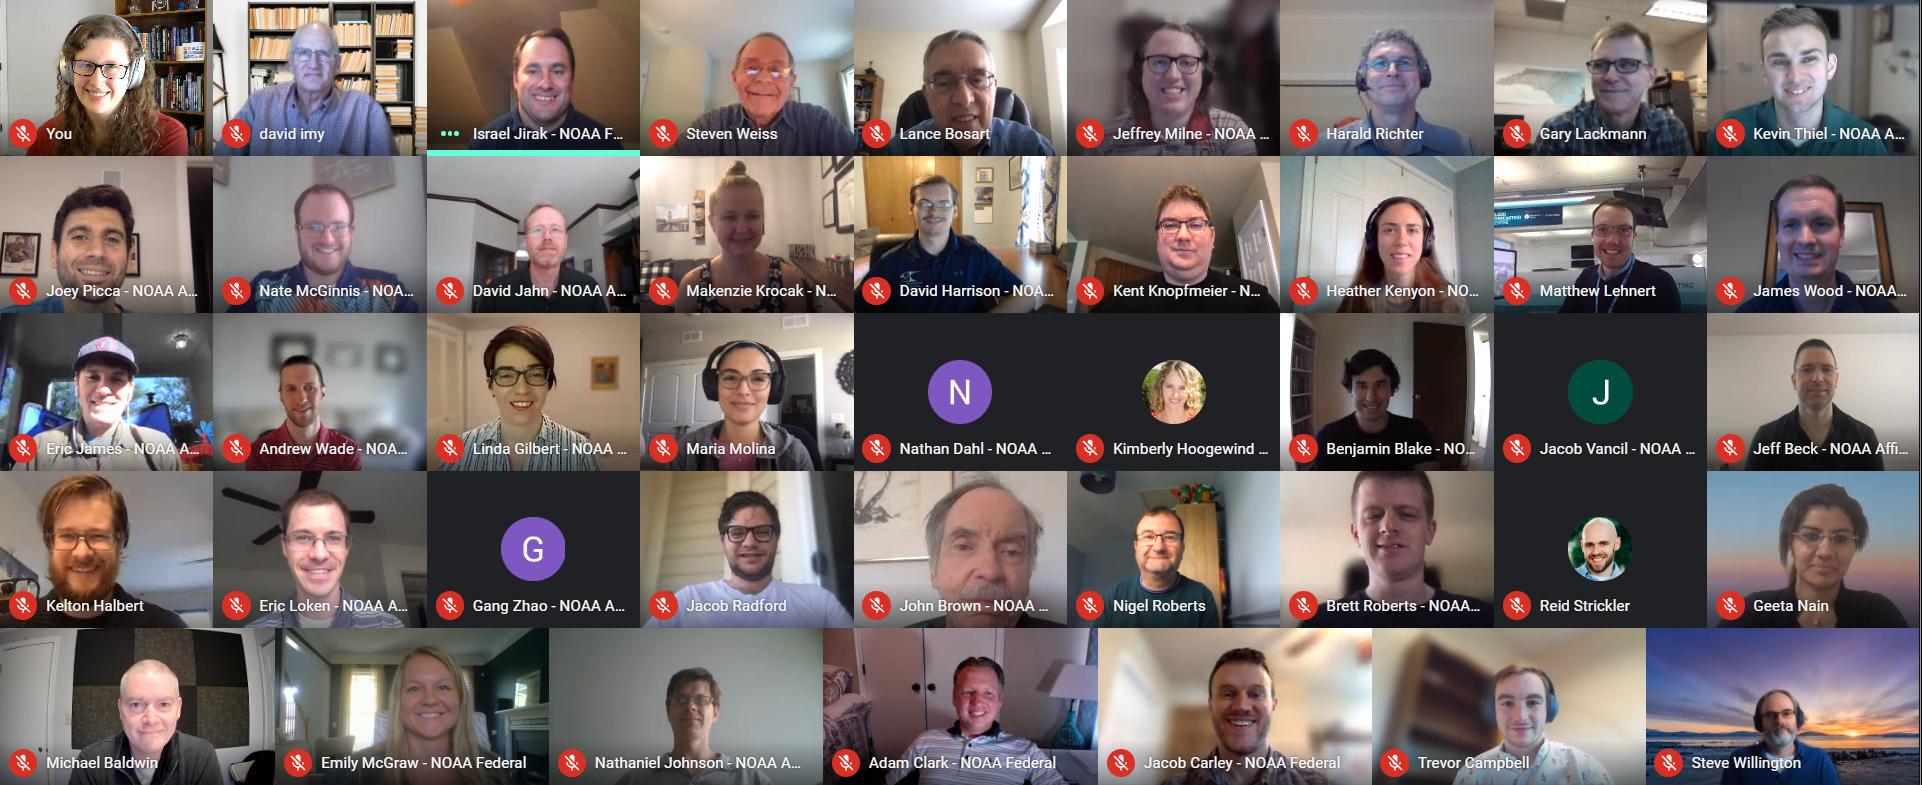
Participants from the fourth week of the 2021 HWT SFE held virtually from 3 May 2021 - 4 June 2021 with forecasters, model developers, academics, researchers, and students from across the world.
Space Weather Prediction Center Completes Three Q3 Modeling Milestones
This quarter the Space Weather Prediction Center (SWPC) successfully completed three National Weather Service (NWS) Milestones that will further advance the products and services that we provide our Space Weather customers in the future.
The first milestone was the development of a proof-of-concept system for a coupled Geospace-Regional Geoelectric model. The Geospace/Geoelectric project team as well as many others from across all of SWPC demonstrated the feasibility of coupling Geospace and Geoelectric models to produce a short-term predictive version of the Geoelectric model. The model is not able to predict minute-by-minute regional variations in the Geoelectric field, which we expected; however, there are surprisingly good indications that the model can correctly capture many of the slower variations in the geoelectric field.
The second milestone was to assimilate radio occultation data from the COSMIC-II satellites into SWPC’s operational models and to assess the impact of incorporating this data on the model performance. The SWPC ionospheric team concluded that assimilating COSMIC-II measurements improved the electron density profile provided by the operational GloTEC model, bringing the GloTEC profile closer to reality.
The third milestone completed by the SWPC’s space radiation team in Q3 was to validate the operational CARI-7 Radiation model using extrapolated energetic particle spectra. This work focused on improving SWPC’s aviation radiation products by assessing and incorporating neutron monitor data to scale the high-energy portion of the spectra and by validating the CARI-7 model results with other ICAO space weather centers. The model comparisons and validation have been carried out using case-study events from January 2005 and September 2017.
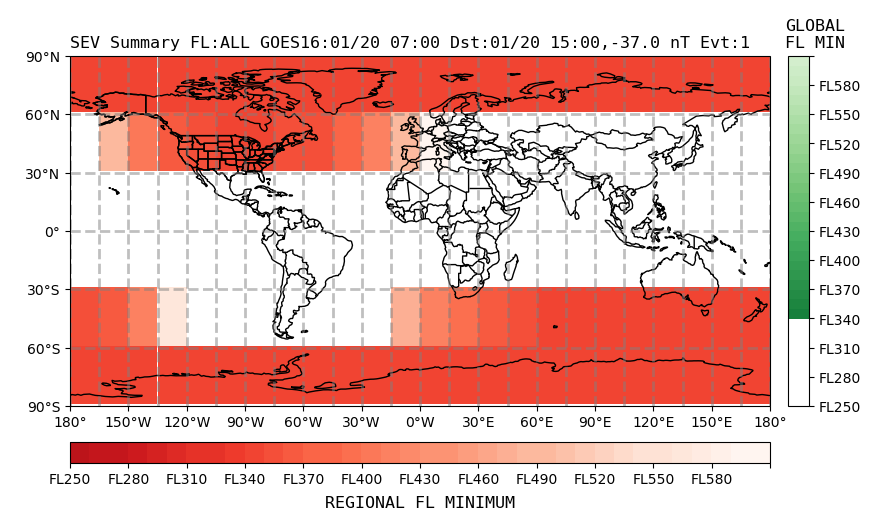
Figure: CARI-7 radiation dose summary map thresholded to show regions exceeding the severe thresholds at any flight level.
Successful R2O transition of GONG at SWPC
In close partnership with the National Science Foundation (NSF) National Solar Observatory (NSO), the Space Weather Prediction Center (SWPC) recently performed a Research to Operations (R2O) transition of the Global Oscillation Network Group (GONG) processing to its operations at Boulder. GONG is a research program begun by the NSF in 2006. It provides continual, high-resolution observational data of solar activity from a global network of six identical telescopes. These telescopes are distributed across the world and strategically located to provide continuous coverage of the Sun’s dynamic behavior. The data streams feature detailed images of the Sun’s magnetism at its surface, as well as canopies of plasma suspended above the Sun’s surface known as filaments. Both of these types of data are vital for understanding and forecasting the explosive nature of our local star.
About a decade ago, SWPC began using GONG data of the Sun's magnetic field as inputs for powerful models that predict the conditions of the solar wind and coronal mass ejections at Earth. These maps are updated hourly, combining simultaneously acquired data from multiple GONG sites and incorporating many thousands of observations from the past month to provide a more complete picture of the entire Sun.
In 2016, The Office of Management and Budget (OMB) directed the National Oceanic and Atmospheric Administration (NOAA) to fund the operations and maintenance of the six global observatories and transition the real-time processing of the data they provide into an operational framework at NOAA. With this recent transition, NOAA is now fully compliant with the direction given to it by OMB.
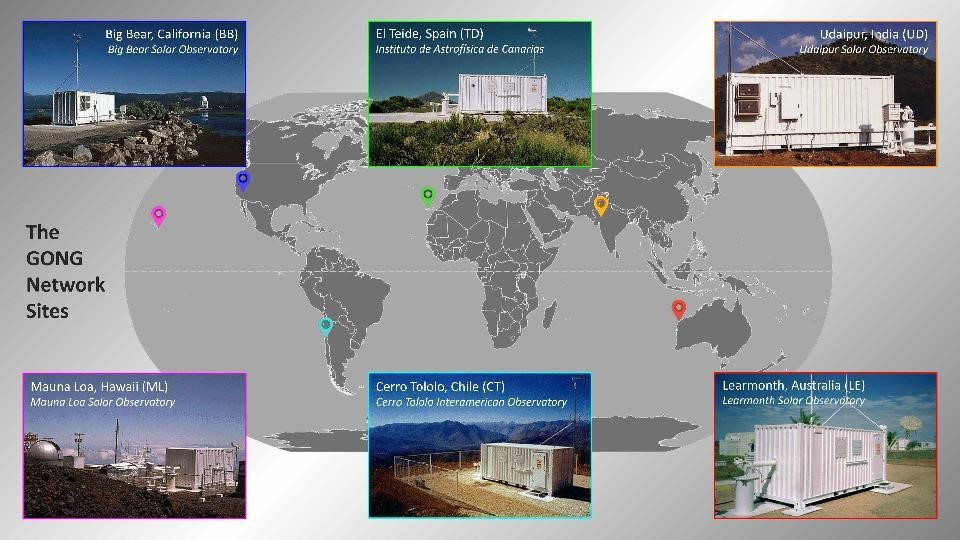
Locations of the NSF managed GONG observatories
Weather Prediction Center has led 3 Virtual Experiments During the Pandemic
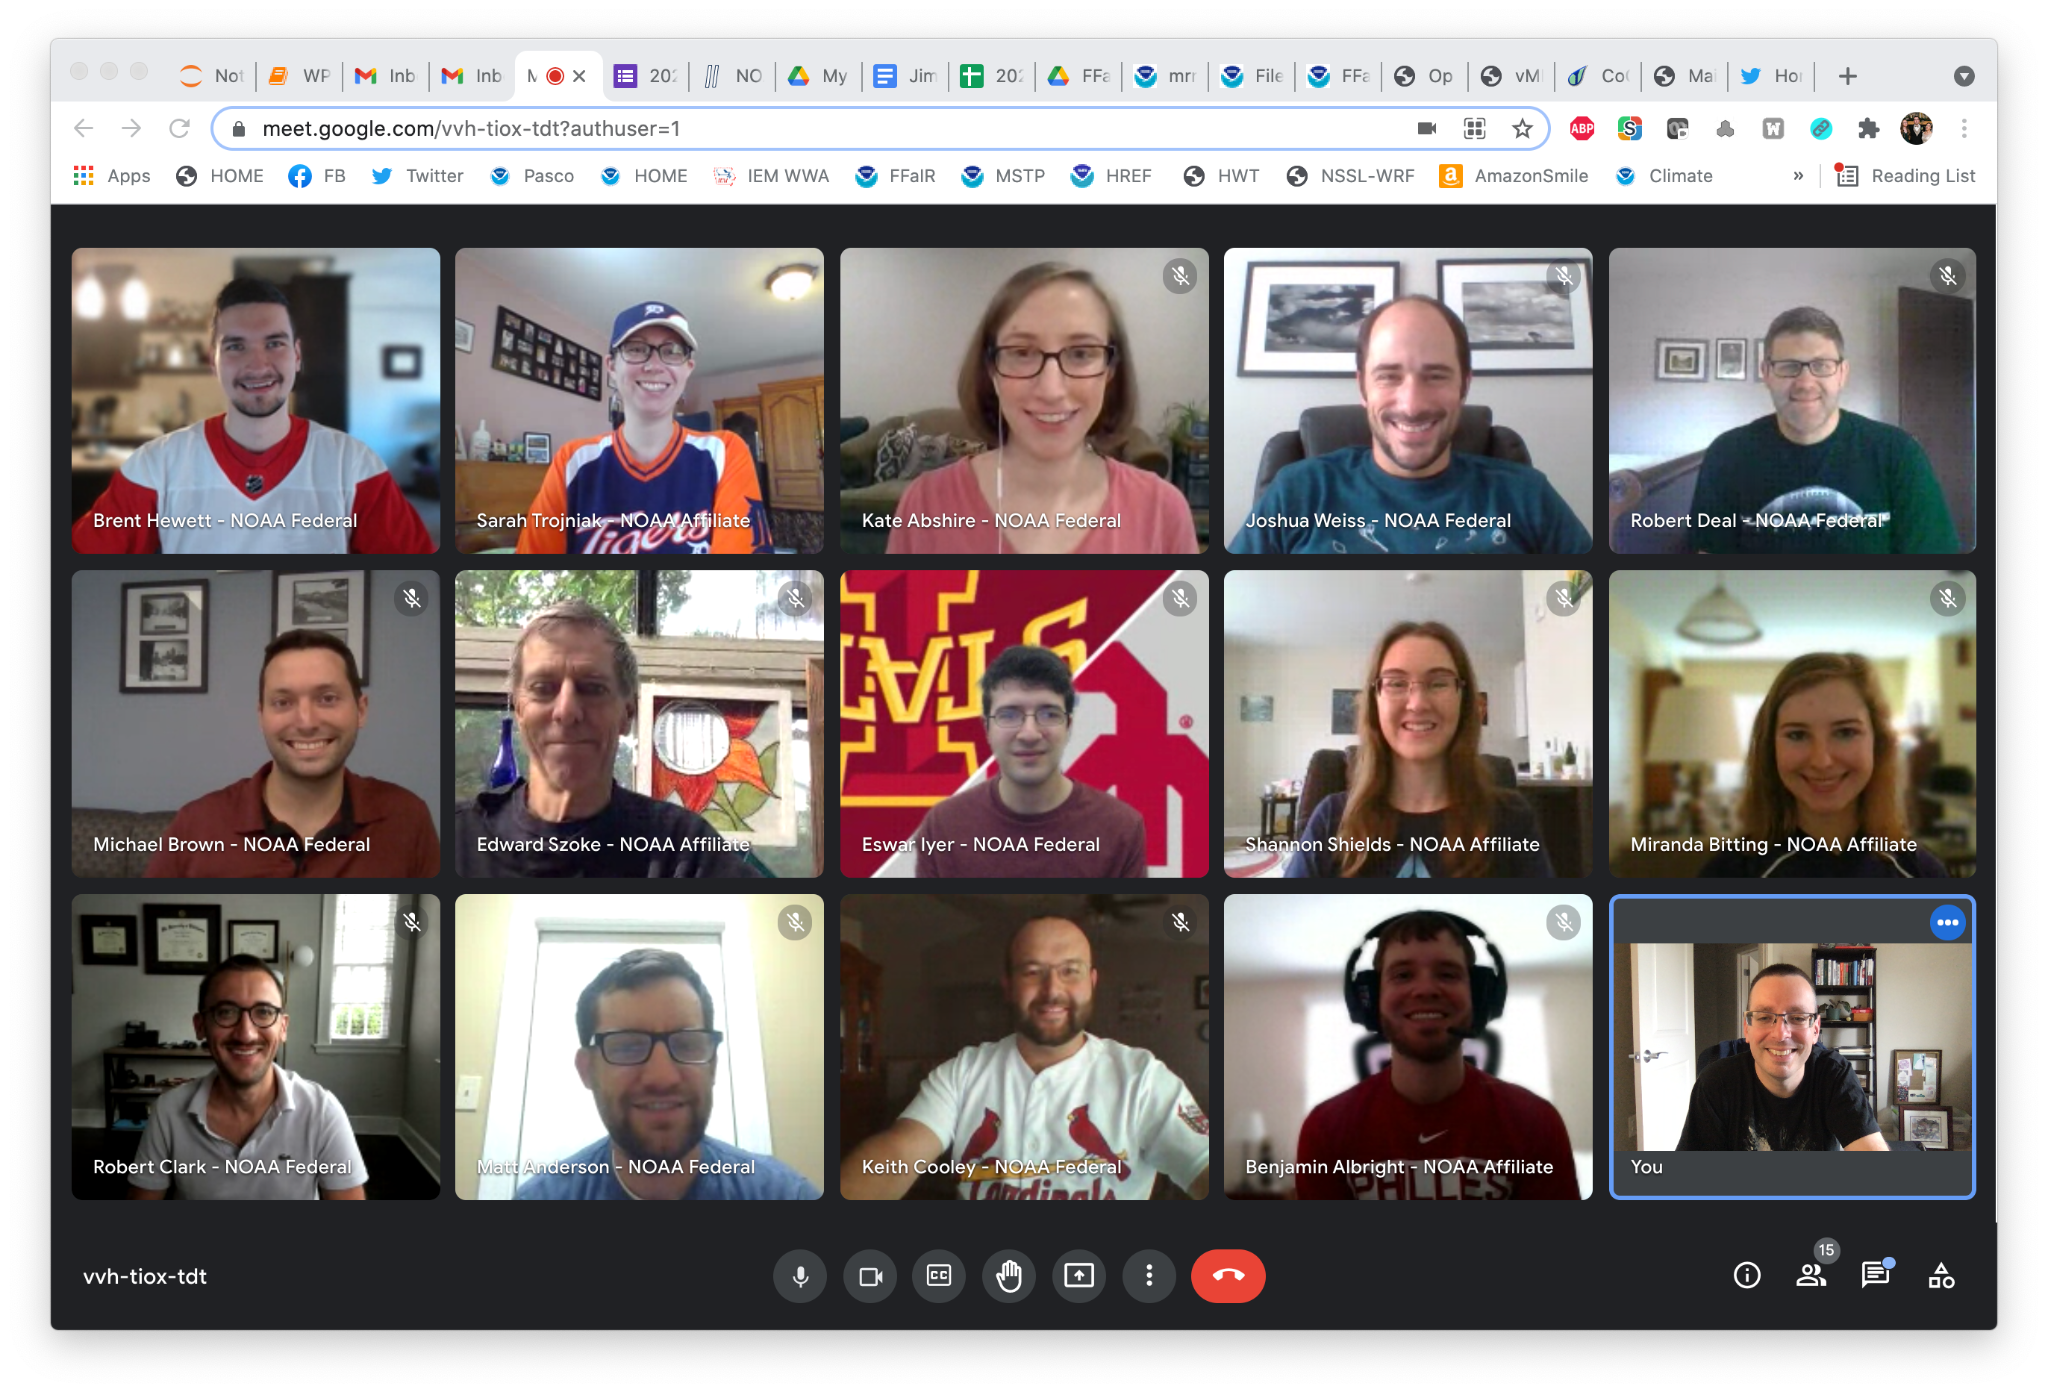
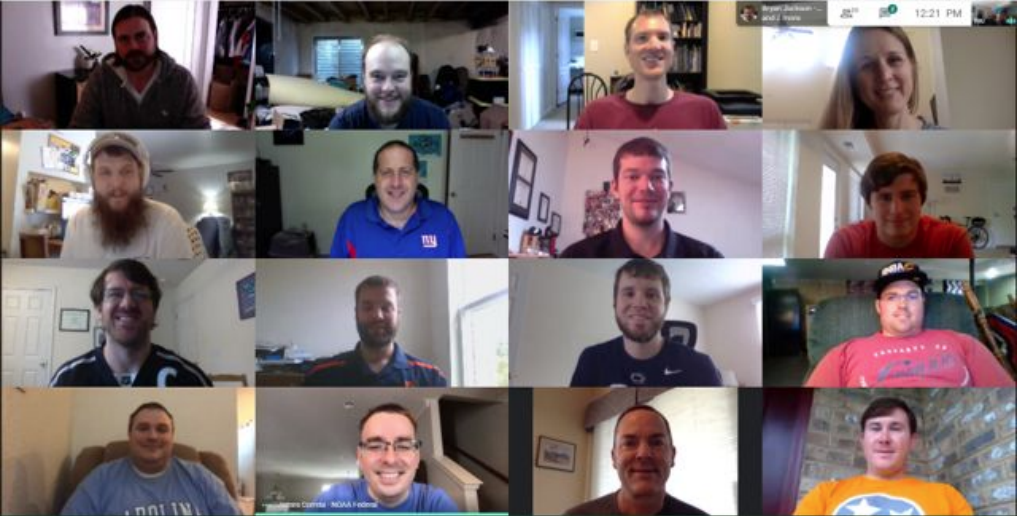
Participants have used video conferencing to join each day’s activities for both the 2020 and 2021 Flash Flood and Intense Rainfall Experiment.
This summer the Weather Prediction Center (WPC) is hosting the virtual Flash Flood and Intense Rainfall (FFaIR) Experiment for four weeks, and bringing forecasters, researchers, and Lapenta Interns together to focus on increasing the skill of forecasting rainfall and flash flooding. The FFaIR Experiment is continuing to focus on experimental datasets from the Unified Forecasting System (UFS) short range weather application, the replacement for the NAM, RAP and HRRR using an immersive set of forecasting activities. FFaIR is usually conducted in person, so the change in format created some new challenges and opportunities. With an increased attendance in 2020, we saw a more diverse group of meteorologists from offices across the country.
During the winter of 2020-2021, the Winter Weather Experiment (WWE) was also conducted fully remote, rather than a hybrid of remote and in-person intensive weeks, which has been the standard practice for several years. In contrast to FFaIR, the WWE is held on two days per week from November into March, allowing for the experiment to evaluate cases over most of an entire winter season. The WWE also had 2 intensive operating periods, focusing on a number of high impact retrospective cases to explore winter weather predictability for both day 3 and day 2 forecasts using experimental UFS convection allowing models. Additionally, the existing remote aspects were adapted and expanded to be more flexible, through use of a dynamic GIS-based website, and garner more CONUS-wide participation. The WWE also noted a significant increase in participation as the HMT has continued to refine and improve methods of remotely holding the experiments.
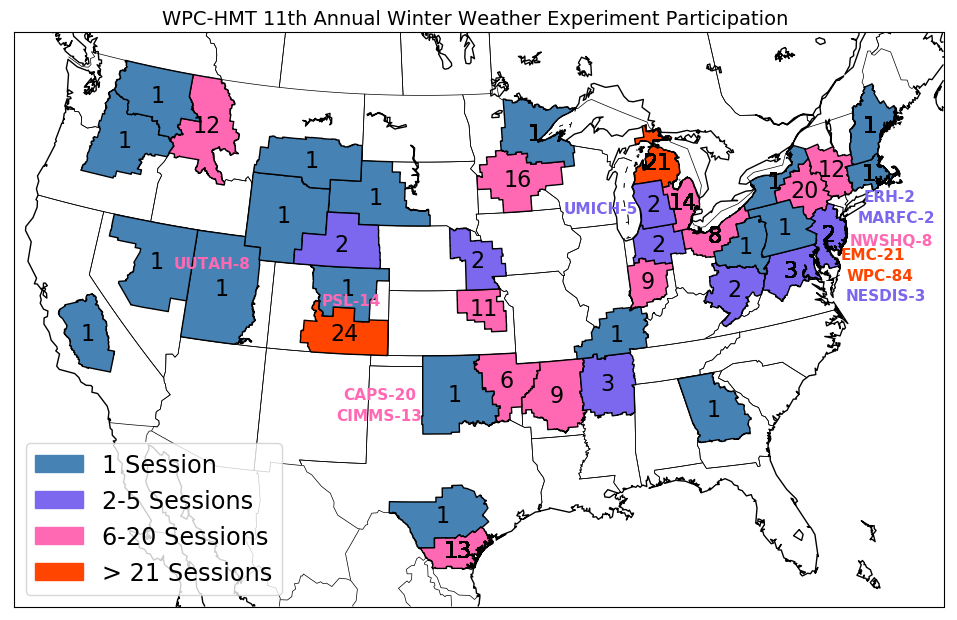
Caption: WWE participation (times in attendance) by WFO, RFC, National Center, Region, OAR laboratory and research organization.
These experiments have been successful because WPC placed a high weight on empathy during the pandemic. We respected each other’s communication styles (introvert or extrovert) by allowing both video and chat conversations to emerge, allowing participants to be family first as needs arose, and having more off-video quiet working time (being mindful of screen fatigue). WPC also held a seminar series for both experiments to bridge research and operations, and prioritized time for discussion of both WFO and National Center operational challenges. Forecasters loved seeing the faces behind the names of forecast products and collaboration calls and WPC looks forward to keeping aspects of virtual testbeds going even as we transition some activities back to in-person, when we reach a new normal. Lastly the HMT completed an “HMT 101 - Lunch and Learn” with the OAR Weather Program Office to foster collaboration with social science researchers. We encouraged researchers, and emergency-support function personnel, to reach out so we can work together and appreciate each other's challenges to better apply our various sciences, techniques, and approaches to empower life-saving and protective action against hazards, local and national.
Aviation Weather Center Supports Kansas City Air Show
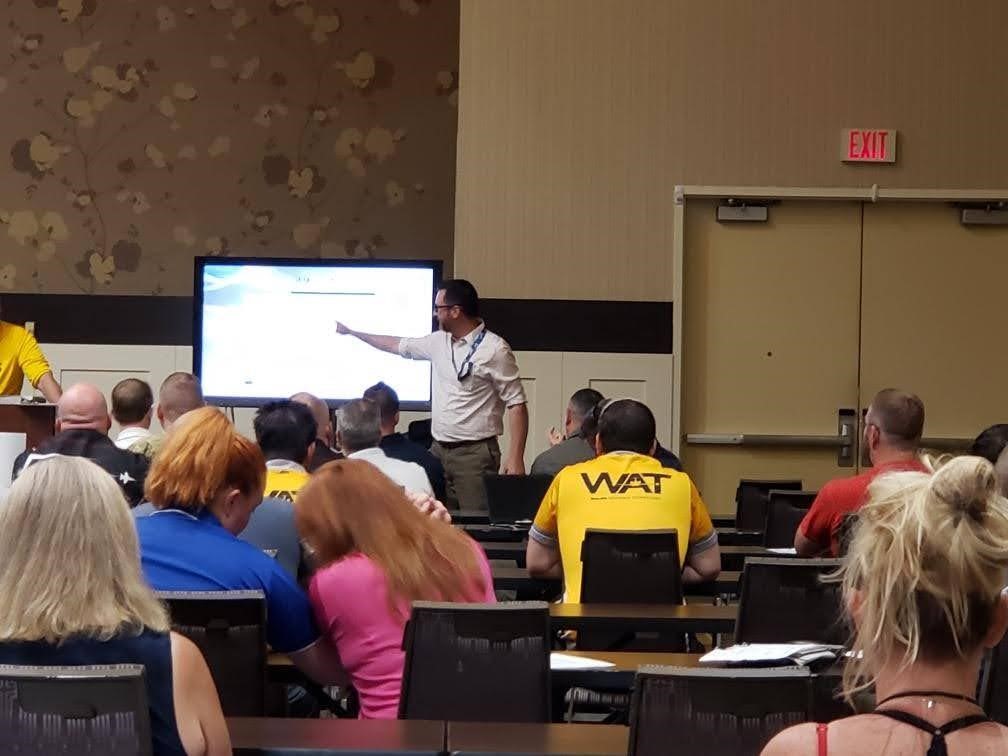
Senior Aviation Meteorologist Scott Minnick provides morning briefing to KC airshow performers.

Senior Aviation Meteorologist Amanda Martin provides morning briefing to KC airshow performers.
The KC Airshow is quickly making a name for itself among the airshow community since its return in 2019. This year AWC Senior Meteorologists Amanda Martin and Scott Minnick provided on site IDSS. The KC Air Show was held at the New Century AirCenter from July 2nd to July 4th. An estimated 40,000 people attended over the weekend. The schedule featured some of the best performers from across the country. It is one of the longest daily airshows, running continuously from 915am to 430pm. Aside from the headlining Blue Angels and Thunderbirds, local favorites KC Flight, the Shetterly Squadron, and Missouri Congressman Sam Graves in his P-40 Warhawk thrilled the crowd of thousands with their acrobatic stunts and aerial demonstrations.
Amanda and Scott provided weather briefings each morning to over 50 personnel including performers, event staff, and government officials. They were on-site throughout the event in an effort to provide additional support if needed. AWC will continue to develop relationships with the airshow coordinators in order to best define its role. Future discussions will include an exhibit space on the event grounds as this would be beneficial to both the general public and aviation community.
Decision Support Service at 2021 Oshkosh Air Show
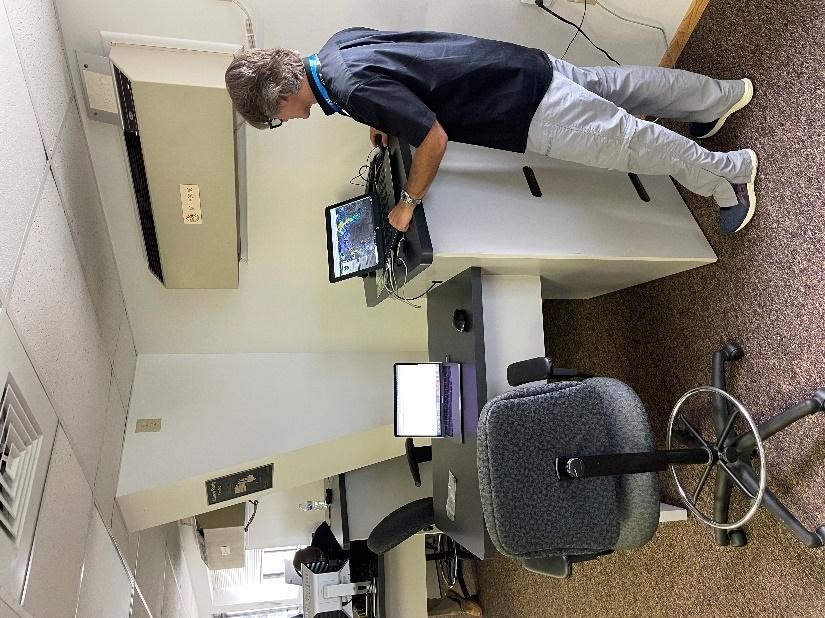
Joe Carr National Aviation Meteorologist
Each year during the last week in July the largest aviation outreach event for NOAA/NWS is held in Oshkosh, WI. A combination of AWC, CWSU, WFO, and OMAO representatives provide an excellent display of NOAA commitment to the aviation community. This is accomplished by outreach activities in the NOAA exhibit space in Hangar D, the IDSS provided for the FAA controllers in the tower, and the IDSS support for the grounds provided by WFO GRB.
Due to the volume of air traffic and the tens of thousands of attendees who choose to camp on-site, the weather is always a significant concern at the event. With at least 60,000 to 90,000 people in attendance daily, this implies a huge number of individuals potentially exposed to any hazardous weather that develops.
At this year’s event, National Aviation Meteorologist Joe Carr had alerted officials days in advance of the potential for severe weather during the scheduled Wednesday night airshow. A severe thunderstorm watch was issued for the region Wednesday evening. Around 8 PM, a decision was made to close the FAA tower and postpone the airshow. Daily attendees evacuated the grounds well ahead of the storms while some campers were able to take advantage of several facilities that had opened for shelter. Joe Carr relocated and sent multiple text briefings to the safety and tech ops personnel. At 9 PM, he participated in a live interview with the EAA radio station. Thunderstorms, some locally severe, impacted the area surrounding Oshkosh.
This dedicated service by Joe Carr allowed the FAA tower to stay informed and maintain operations as long as possible. Due to the advanced messaging, many attendees were able to seek shelter and mitigate property damage.
Climate Prediction Center Issues La Niña Advisory
The Climate Prediction Center upgraded the previously issued La Niña Watch to a La Niña Advisory on October 14, 2021. Below-average sea surface temperatures (SSTs) across the central and eastern Pacific strengthened during September, heralding the beginning of the episode. Forecasters expect that this episode has an 85-90% probability that it will last through the winter, with a 57% chance that it reaches a moderate strength event. This forecast relies on current observations, including a substantial supply of colder-than-average subsurface waters below the central and eastern equatorial Pacific. In addition, most of the dynamical models predict continued equatorial Pacific surface temperature anomalies below -0.5°. With the exception of a few models, the forecasts are closely grouped, indicating they are fairly confident in the forecast.
CPC has been tracking the potential development of this La Niña since the summer, and it was a factor in the above-normal hurricane season forecast, which has unfolded as expected. La Niña also typically influences the weather across the country during the winter, often resulting in wetter and colder conditions across the northern tier and warmer and drier conditions across the southern tier of the country. With drought currently entrenched across much of the West, the Southwest will remain a region of concern as the anticipation of below normal precipitation in that region likely means drought will persist and potentially intensify.
http://www.cpc.ncep.noaa.gov/products/analysis_monitoring/enso_advisory/ensodisc.html
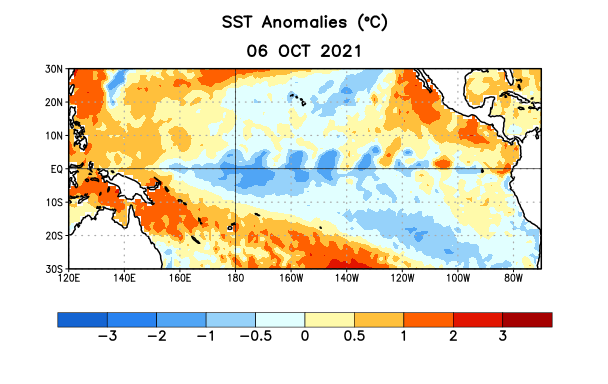
Average sea surface temperature (SST) anomalies (°C) for the week centered on 6 October 2021. Anomalies are computed with respect to the 1991-2020 base period weekly means.
EMC
Environmental Modeling Center (EMC) Upgrades the Air Quality Model (AQM)
NCEP implemented the AQM version 6 on Tuesday, July 20 at 1200 GMT. The AQM uses the Community Multi-scale Air Quality (CMAQ) modeling system to provide ozone and fine particulate matter air quality predictions over the Contiguous United States (CONUS), Alaska, and Hawaii. The AQM v6 code includes the upgraded Environmental Protection Agency (EPA) CMAQ v5.3.1, which uses an updated 2016 National Emissions Inventory (NEI 2016). CMAQ v5.3.1 is now driven by the 13 km NWS GFS meteorological forecast model while using a more realistic land surface greenness vegetation fraction and leaf area index. Daily maximum 8-hour average surface ozone and 1-hour daily maximum and 24-hour average surface PM2.5 concentration outputs were extended from 2 days (48hrs) to 3 days (72hrs). Hourly averaged ozone and PM2.5 concentration predictions were also extended from 48 to 72 hours. More accurate raw and bias-corrected surface ozone and PM2.5 values are expected from this upgrade. Ozone predictions around wildfires should be better represented with the inclusion of some precursor gas emissions from fires.
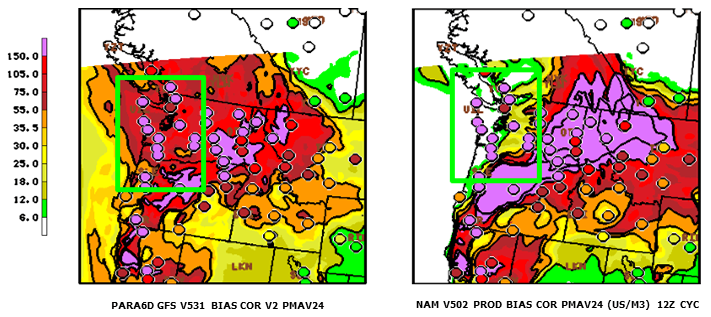
Example of an improved PM2.5 forecast for the historic Pacific NW fire of September 2020. The circles on both plots are the observed PM values. In the new GFS-driven AQM (left), coastal 24h PM2.5 exceedances were captured with the parallel bias-corrected predictions. The operational NAM-driven AQM (right) predicted clean air for the area of historic exceedance levels over the WA/OR coast. Model plots were produced by NCEP/EMC.
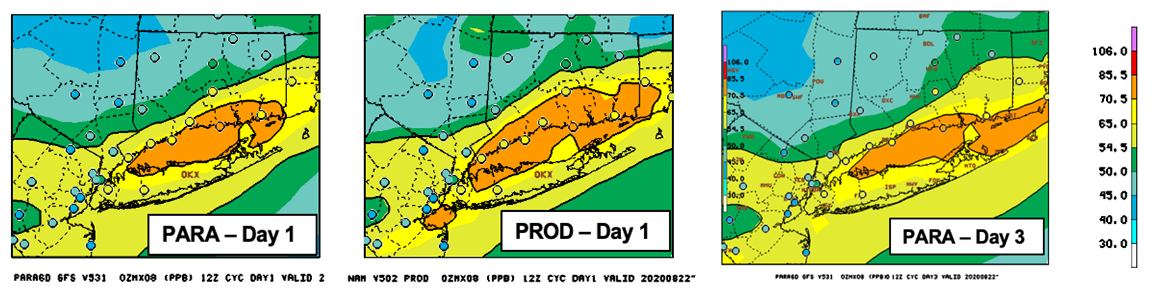
Example comparing the new day-3 forecast (right panel) to the day-1 forecasts from the parallel AQM V6 (left panel) and the previous operational AQM (center panel) of the daily maximum 8-hour average ozone prediction for day 3 in units of ppbv. The circles depict the observed ozone values. The day-3 forecast is comparable to the day-1 forecasts and provides useful early guidance. This example was provided by the CT Bureau of Air Management Evaluation and the plots were produced by NCEP/EMC.
Sunsetting of Current Supercomputer Upgrades and Looking to the Future
For the last 8 years NCEP Central Operations (NCO) has been performing model upgrades on the Weather and Climate Operational Supercomputing Systems (WCOSS). Traveling back in time, the system was delivered almost 10 years ago with 9,920 cores and a peak performance of 208 teraflops (calculations/sec). As we near the end of this 10-year contract, the system went through several upgrades and today operates with 112,832 cores with a peak performance of 4,029 teraflops.
2021 was the last year for upgrades on this system, and in Q4 WCOSS entered an upgrade moratorium, sunsetting a valuable system that saw enormous growth in numerical modeling across all aspects of NOAA. Over the lifetime of this system WCOSS has seen several new models added to the suite, increased horizontal and vertical resolutions, extended forecast projections, increased forecast time steps, expanded grids, added new grids, and added countless new variables/observations/satellites. The suite now supports over 80 unique systems and averages 20 major upgrades/implementations a year. We closed the books on WCOSS by completing 21 upgrades in FY21, with the final implementation honors going to the Extratropical Surge and Tide Operational Forecast System (ESTOFS). We look ahead now to a full transition of the suite to a new WCOSS system, with a scheduled go-live in July, 2022.
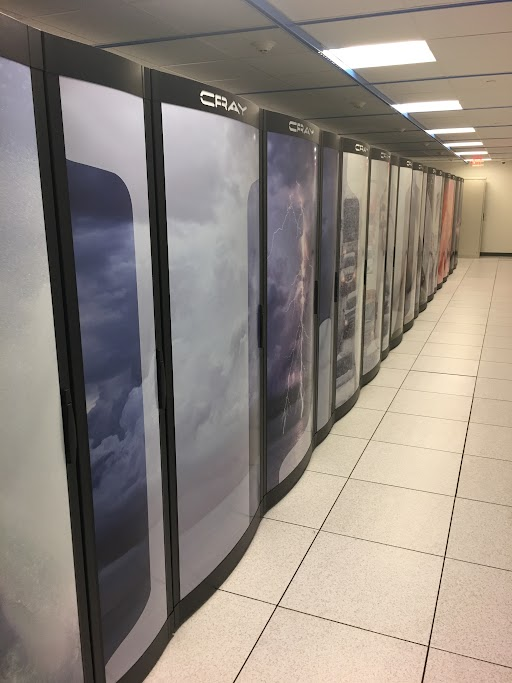

WCOSS Cray Systems in Reston, VA
NHC Director hits the ballfield for hurricane preparedness
National Hurricane Center Director Ken Graham threw out the ceremonial first pitch just ahead of the evening’s Miami Marlins / San Diego Padres MLB game at loan Depot Park in Miami on July 24th. Graham is no stranger to the game. His twin daughters were on their high school softball team and are now doing the same at college. But Graham said throwing a hardball is different. “I was so used to the larger softball”, said Graham “When I practiced with the hardball, it tended to get away from me”. But the toss that evening near the pitcher’s mound was perfect, even though mascot “Billy the Marlin” missed the catch.
Graham also did a live interview during the Bally Sports pregame show, emphasizing the importance of having a hurricane plan now that we’re about to enter the peak of the season. A video was played on the giant screen over the field, adding to that important message. By the way, the Marlins won the game in a come-from-behind thriller, 3-2.
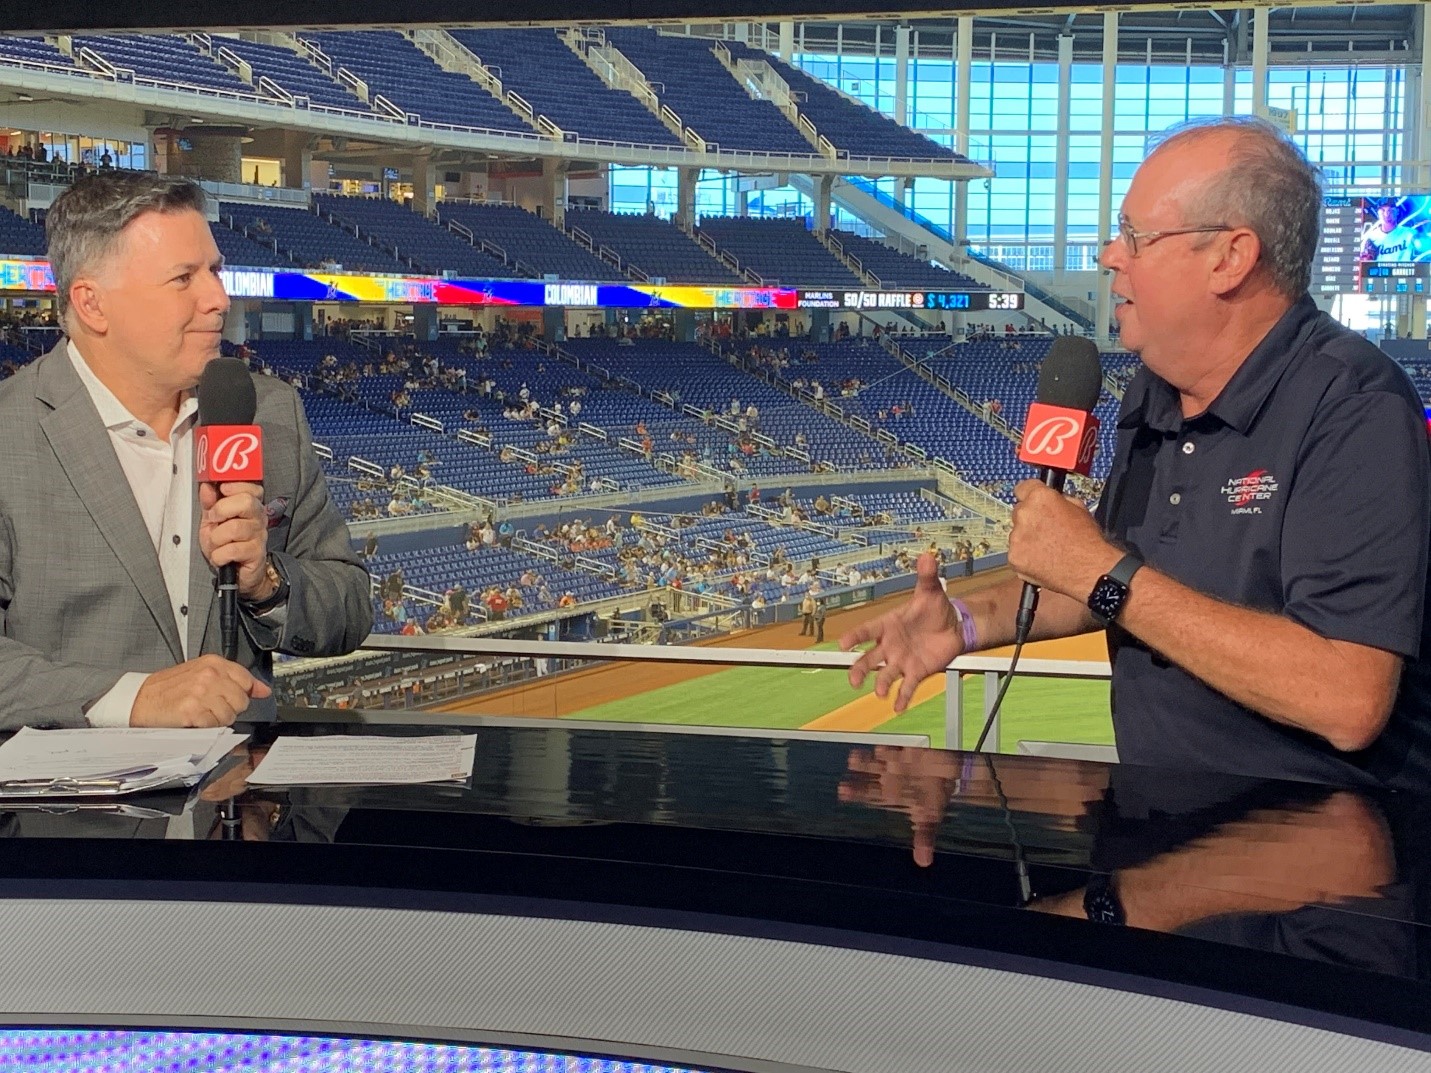
Ken Graham provides a live interview on the Bally Sports pregame show. July 24, 2021 (Photo credit: Dennis Feltgen, NOAA Communications)
New U.S. Coast Guard Commandant visits National Hurricane Center
Rear Admiral Brendan C. McPherson and four staff from the U.S. Coast Guard District 7 visited the National Hurricane Center and the Miami Weather Forecast Office on July 19th.
McPherson was just installed as the new Commandant for D7, which covers the entire southeast United States including Puerto Rico and the U.S. Virgin Islands. D7 also has Search and Rescue Region responsibilities for the eastern Gulf of Mexico, the tropical North Atlantic, and the Caribbean Sea.
The visit included a briefing on NHC's and WFO Miami's products and services as well as the co-located FEMA and U.S. Air Force offices at the facility. NHC's Tropical Analysis and Forecasting Branch works closely with D7. It provided 20 Spot Forecasts and 45 live tropical cyclone briefings during 2020 as part of NHC/TAFB's impact-based decision support services.
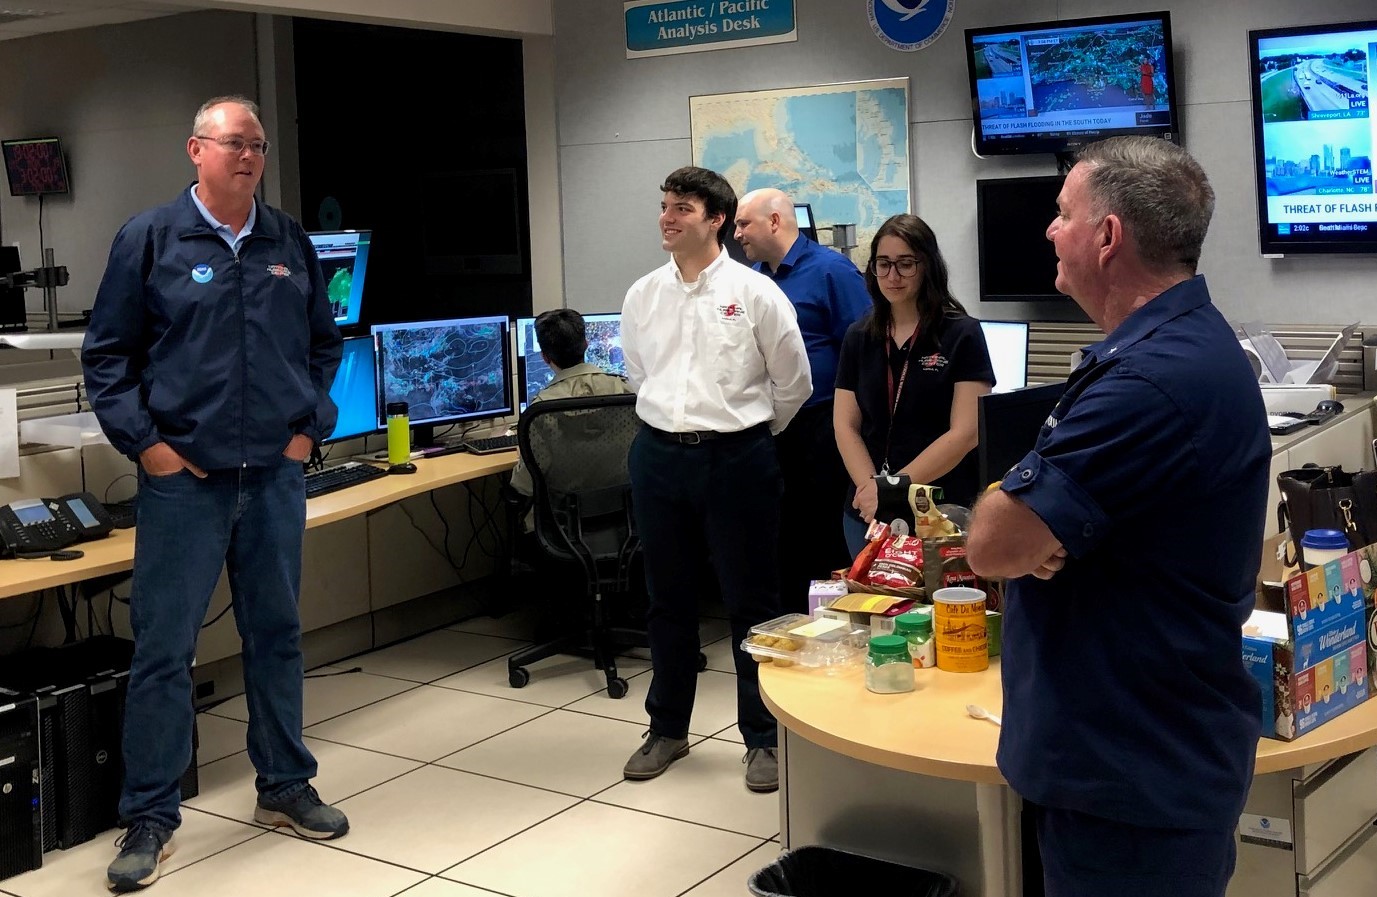
NHC Director Ken Graham (left) speaks with RADML Brendan McPherson (right) in the TAFB operations area as Pathways Intern Aidan Mahoney and Meteorologist Dr. Heather Nepaul look on. July 19, 2021 (Photo credit: Chris Landsea, NHC TAFB)
NHC Director briefs POTUS as Hurricane Ida aims at the U.S. Gulf Coast.
President Joe Biden called the cell phone of NHC Director Ken Graham at 1:05 p.m. Saturday August 28th to get an update on the expected impacts of Hurricane Ida onto the U.S. coastline. At the time, Ida was rapidly intensifying about 300 miles from the mouth of the Mississippi River. It would peak at 150 mph the next day at landfall.
Graham placed the 5-minute call on speaker for the NHC staff to hear. The President thanked Ken, the NHC staff and the NOAA and USAF hurricane hunters for its life saving work.
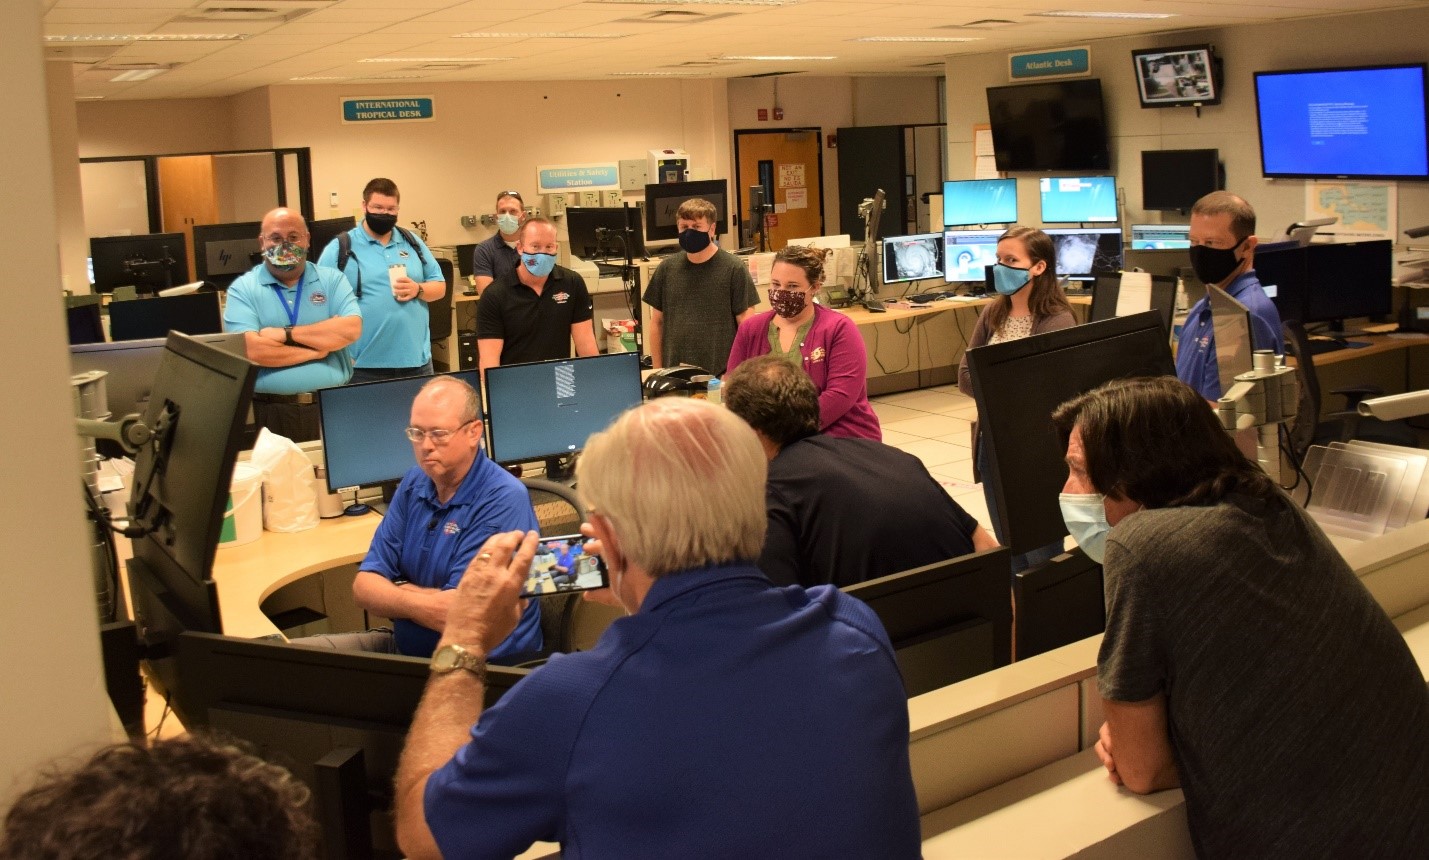
NHC staff listen as Director Ken Graham provides an update to President Joe Biden concerning the expected wind and water impact from Hurricane Ida. (Photo credit: Phil Manougian, NHC)
NOAA Announces Membership of the Space Weather Advisory Group
n September 2021 NOAA announced the appointment of 15 non-government members (listed below) to the new Space Weather Advisory Group (SWAG). The SWAG was established by Public Law 116-181, the Promoting Research and Observations of Space Weather to Improve the Forecasting of Tomorrow Act of 2020, also known as the PROSWIFT Act. The members were chosen to provide a range of views that represent the span of the space weather community and end-user sectors. The SWAG will receive advice from the academic community, the commercial space weather sector, and nongovernmental space weather end-users to inform the National Science and Technology Council’s Space Weather Operations, Research, and Mitigation (SWORM) Interagency Working Group (IWG).
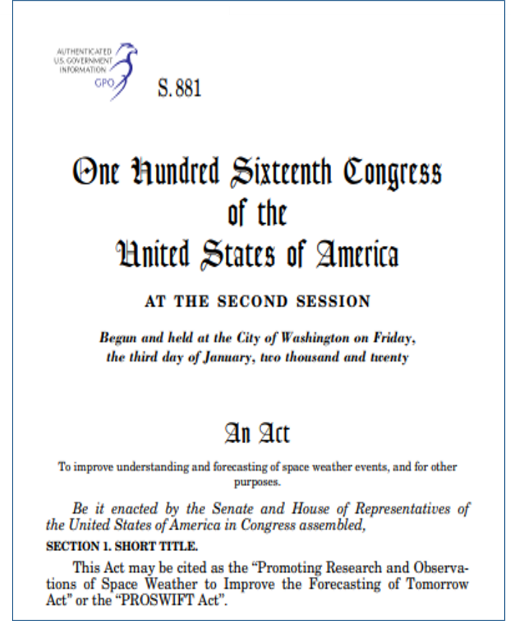
The Chair of the SWAG, selected by the NOAA Administrator from one of the 15 members, will be announced in October 2021. Duties of the SWAG include advising the interagency working group on improving the ability of the United States to prepare for, mitigate, respond to, and recover from space weather phenomena, enabling the coordination and facilitation of research to operations and operations to research, and developing and implementing an integrated space weather observation strategy. As members of the SWORM IWG, the Space Weather Prediction Center congratulates the new SWAG members and looks forward to working together to improve national preparedness for space weather storms.
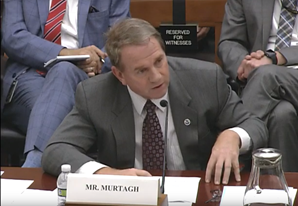
Bill Murtagh of the NOAA Space Weather Prediction Center testifies before the Committee on Science, Space, and Technology at the US House of Representatives
2021 Space Weather Advisory Group
Commercial Providers:
Academia:
End-Users:
New Year, New Page! Update to weather.gov/aviation

A group of 6 aviation forecasters from across the NWS worked together over the past year to update the NWS Aviation Weather Services Page, www.weather.gov/aviation. The goal was to give the page a new look, make it more user friendly, assess existing links' usefulness, add additional information, and reorganize the content. To make it the one-stop-shop for all NWS Aviation information.
The page’s new look includes scrolling slides, clickable buttons, the creation of new pages and an entirely new array of tabbed information. This new page has information for all areas of aviation interest ranging from the general aviation pilot, the meteorology or aviation student, current NWS employees, educators and the general public.
Some new features include:
The updated page is live now! Head over to www.weather.gov/aviation to check it out!
Climate Prediction Center Issues 2021-22 Winter Outlook
The Climate Prediction Center issued the Winter Outlook for December 2021 – February 2022 via a press teleconference and press release on October 21, 2021. As La Niña redeveloped recently for the second year in a row, both the temperature and precipitation outlooks are consistent with typical La Niña impacts, which includes a characteristic warmer, drier south and cooler, wetter north. These outlooks are also quite similar to the outlooks released last year.
Specifically, warmer than normal conditions are favored across the southern two-thirds of the continental U.S., extending northward into the Great Lakes and up the East Coast, and in central and western Hawaii. In contrast, below average temperatures are favored along the northern tier of the country, from the Dakotas to the Pacific Northwest and in central and southern Alaska. Elsewhere, there is no tilt in the odd to above, near, or below average temperature this winter.
The winter precipitation outlook favors wetter than average conditions across the Pacific Northwest and northern Rockies, and also around the Great Lakes, the Ohio Valley, in Hawaii and also in western Alaska. Drier than normal conditions are most likely across the entire southern U.S. and in southern Alaska.
Heading into winter, the big story this year is again likely to be drought. Widespread severe to exceptional drought continues to dominate the western half of the continental U.S., Northern Plains, and the Missouri River Basin. Given the expectations for a drier than average winter across the South, drought conditions are forecast to persist and develop in the Southwest and Southern Plains. However, drought improvement is most likely to occur in the Pacific Northwest, northern California, the upper Midwest, and Hawaii.
The press release with a link to a winter outlook video can be found here:
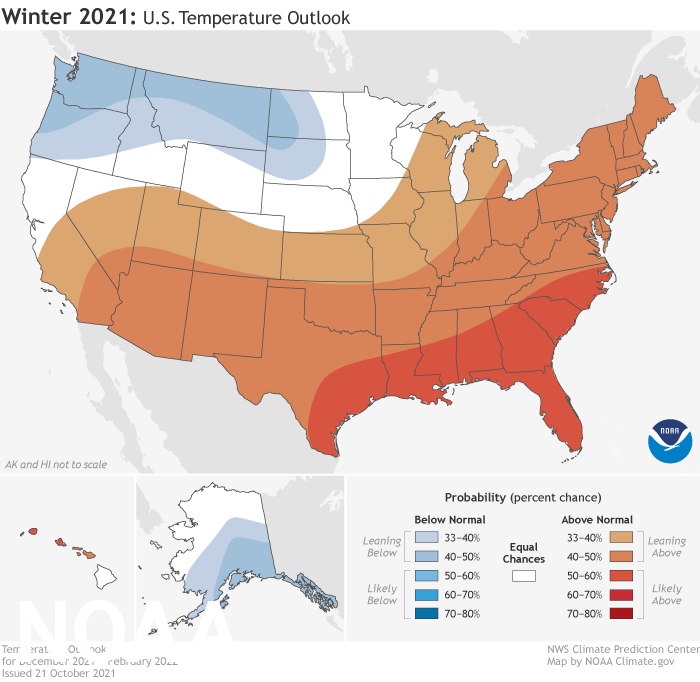
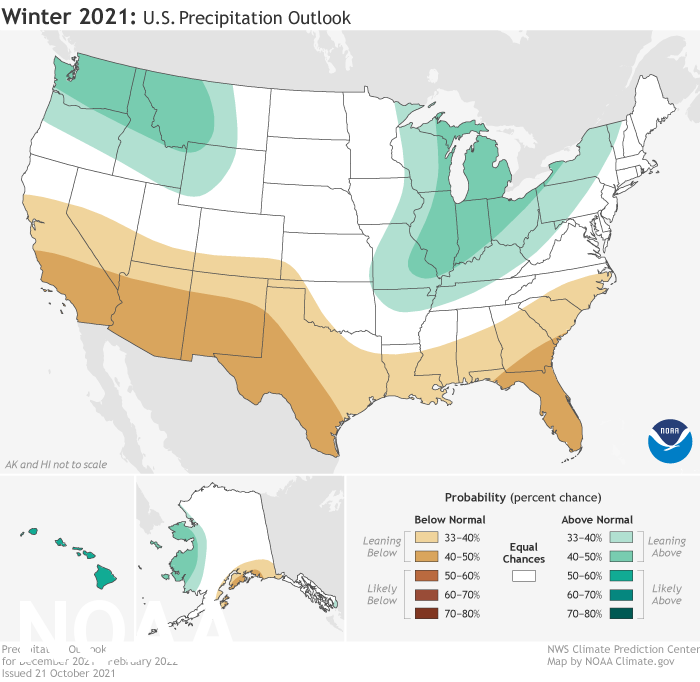
December 2021 – February 2022 Outlooks for temperature (left) and precipitation (right).
EMC
Environmental Modeling Center (EMC) Scientist Daryl Kleist to Join World Meteorological Organization Scientific Steering Committee
Daryl Kleist (EMC Assimilation and QC Group Lead) has been invited to join the Scientific Steering Committee (SSC) of the WMO World Weather Research Programme (WWRP). He has been serving as a working group member (2013-2016) and co-chair (2017-present) for the Data Assimilation and Observing Systems (DAOS) working group of WWRP. The nomination to the SSC was recently approved by the WMO Research Board and the US Permanent Representative to the WMO. He stepped down as DAOS co-chair to begin his term on the SSC as of 1 January 2022. The SSC plays a critical role in guiding strategy, defining an implementation plan, and providing oversight of associated activities under the WMO/WWRP umbrella. In his new role on the SSC, he will be providing oversight and liaising on activities relevant to DAOS, the Predictability, Dynamics, and Ensemble Forecasting (PDEF) working group, and collaboration with the World Climate Research Programme (WCRP) in the area of earth-system modeling and observations.

Daryl Kleist; photo courtesy of EMC Director Brian Gross.
Deployment of NWSChat on the Integrated Dissemination Program System
NWSChat is an Instant Messaging program that is used by National Weather Service (NWS)personnel and core partners, such as emergency managers, media outlets, and other enterprise partners to exchange weather information and seek clarifications and updates for ongoing mission critical infrastructure issues in real time. Additional functionality provided by the NWSChat application includes the ability for users to post messages to social media, view GIS maps with data from NowCoast, IDPGIS, and other Federal sources.
In December 2021, NCEP Central Operations, in collaboration with the Office of Dissemination and the Analyze, Forecast and Support Office deployed an updated and improved version of the NWSChat application on NOAA’s Integrated Dissemination Program (IDP). NWSChat was previously deployed on the legacy NWS Internet Dissemination System (NIDS) in College Park, MD and Kansas City, MO on older, less capable hardware. Failovers of the legacy application caused an outage of approximately 2.5 hours. Additionally, legacy NWSChat leveraged many external data sources whose availability was out of the NWS’ control. NWSChat on IDP was upgraded to fail over with an outage of less than fifteen minutes; and the reliance on external data sources was removed. Additionally, the application is running on much newer, more powerful and better monitored hardware and software. All of these produce an application that is much more stable, reliable and available to NWS and core partners.
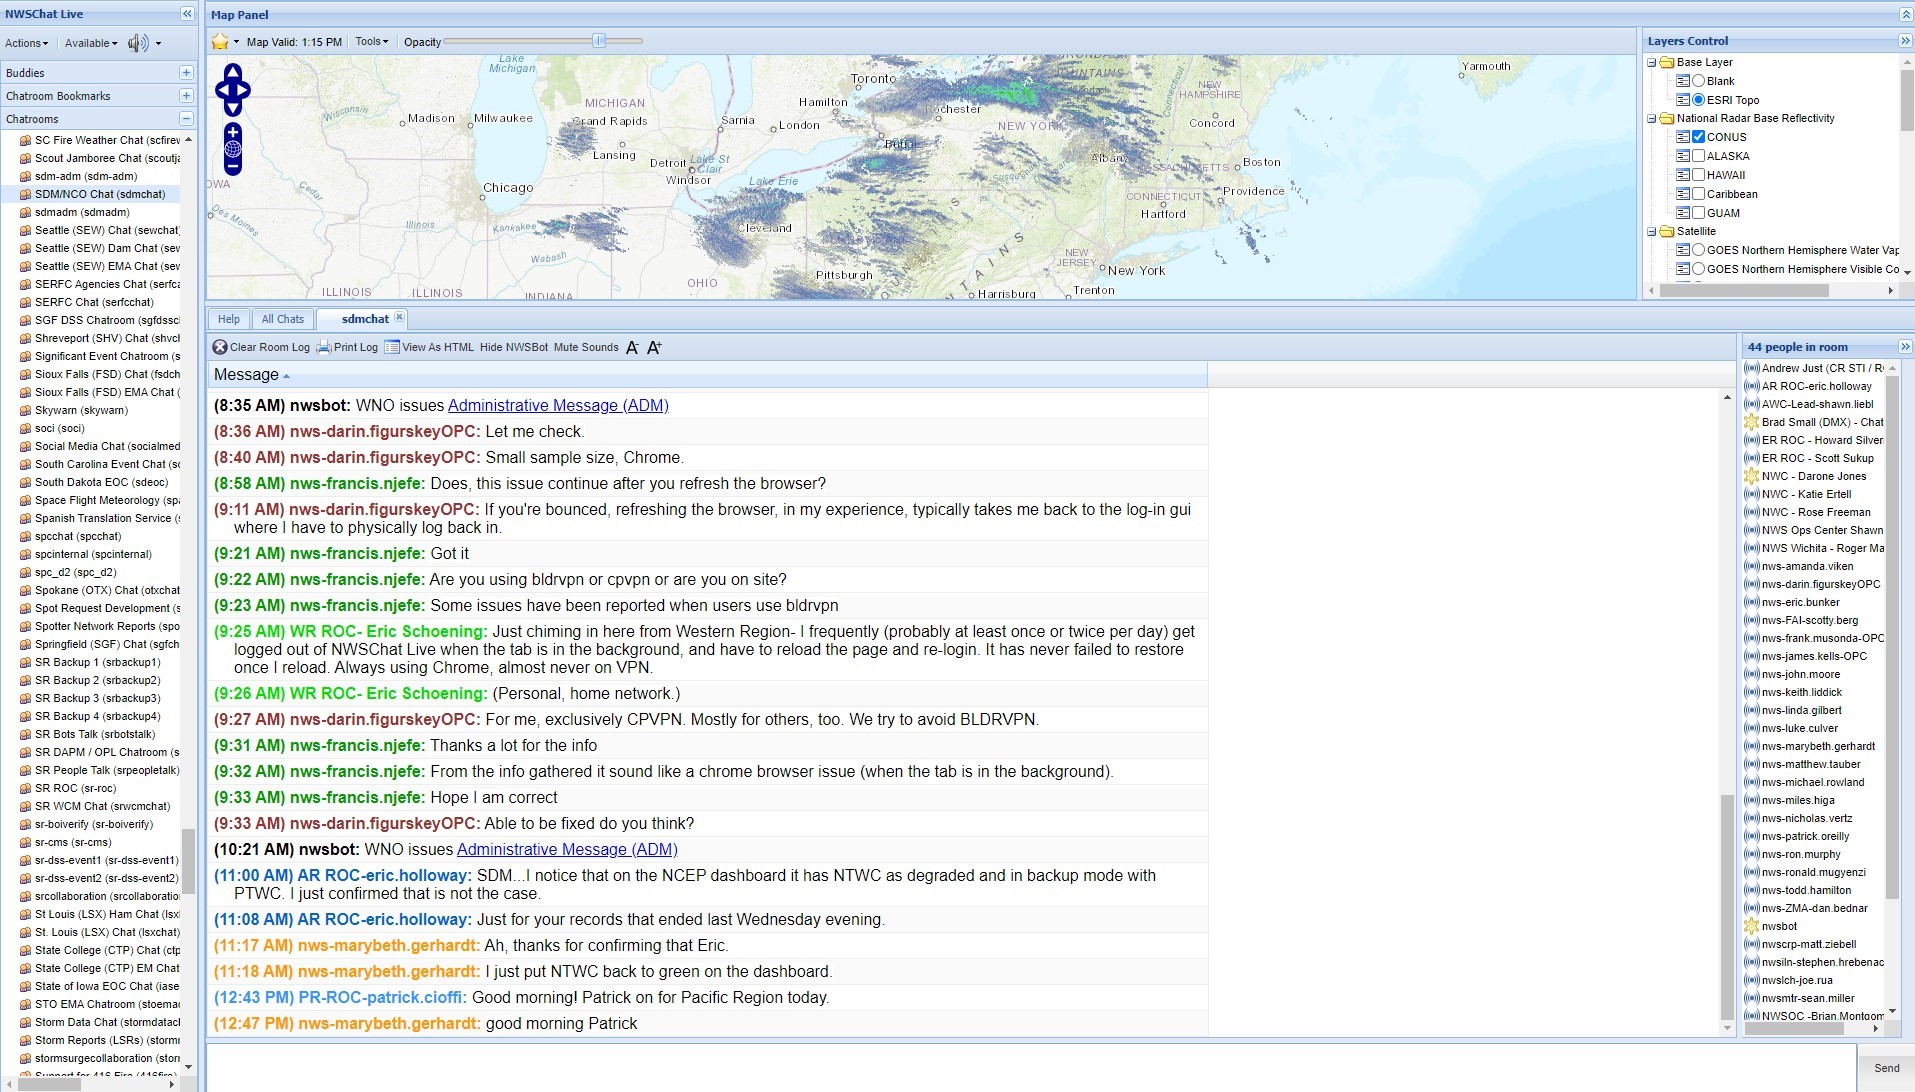
NWSChat Live Interface on IDP
Inaugural Meeting of the PROSWIFT-directed Space Weather Advisory Group
The first meeting of the Space Weather Advisory Group (SWAG) occurred on 1 December 2021. The SWAG was established by Public Law 116-181, the Promoting Research and Observations of Space Weather to Improve the Forecasting of Tomorrow (PROSWIFT) Act of 2020. The SWAG is to receive advice from the academic community, the commercial space weather sector, and nongovernmental space weather end-users to inform the White House Space Weather Operations, Research, and Mitigation (SWORM) Interagency Working Group (IWG). The SWAG will advise the SWORM IWG on improving the ability of the United States to prepare for, mitigate, respond to, and recover from space weather storms. The SWAG will also advise on enhancing the transition of research to operations and operations to research; and developing and implementing an integrated space weather observation strategy.
Members include:
Commercial Providers:
Jennifer Gannon, VP of Research and Development, Computational Physics, Inc. Lafayette, CO
Conrad Lautenbacher, Executive Chairman, GeoOptics, Inc., Dunwoody, GA
Seth Jonas, Principal, Lockheed Martin, Bethesda, MD
Kent Tobiska, President, Space Environment Technologies, Pacific Palisades, CA
Nicole Duncan, Heliophysics Mission Area Lead, Ball Aerospace, Boulder, CO
Academia:
Tamas Gombosi, Distinguished Professor, University of Michigan, Ann Arbor, MI
Delores Knipp, Research Professor, University of Colorado, Boulder, CO
Scott McIntosh, Deputy Director, National Centers for Atmospheric Research, Boulder, CO
Heather Elliott, Staff Scientist, Southwest Research Institute, San Antonio, TX
George Ho, Chief Scientist (Instrumentation), Johns Hopkins University Applied Physics Laboratory, Laurel, MD
End-Users:
Mark Olson, Senior Engineer and Manager, Reliability Assessments, North American Electric Reliability Corporation, Atlanta, GA
Michael Stills, Retired, (former) Director, Flight Dispatch, Network Operation Control Center, United Airlines, Ashburn, VA
Craig Fugate, Chief Emergency Management Officer, One Concern, Gainesville, FL
Tamara Dickinson, President, Science Matters Consulting, Washington, DC
Rebecca Bishop, Principal Scientist, Aerospace Corp., El Segundo, CA
After opening remarks from the SWORM Co-chairs: Ezinne Uzo-Okoro, Assistant Director for Space Policy, Office of Science and Technology Policy; Louis Uccellini, Assistant Administrator for Weather Services, NOAA, and Director, NWS; and, Robert Kolasky, Assistant Director, Cybersecurity and Infrastructure Security Agency , DHS, and Director, National Risk Management Center, DHS; the SWAG members embarked on addressing the PROSWIFT directed comprehensive space weather user-needs survey to identify the space weather research, observations, forecasting, and modeling required to improve space weather products. The discussion began with an assessment of the 2019 Abt Associates Space Weather User Survey Report by SWPC’s Rob Steenburgh. Various approaches on how best to address this PROSWIFT action were discussed, with very valuable input from Jen Sprague of NWS HQ. The SWAG is now finalizing its approach to accomplishing this important action and will meet next in February 2022. Special thanks to Jennifer Meehan, the SWAG Designated Federal Officer, for her extraordinary efforts to form the SWAG and oversee a very successful first meeting.

Space Weather Advisory Group (SWAG) inaugural meeting 1 December 2021. The SWAG was established by Public Law 116-181, the Promoting Research and Observations of Space Weather to Improve the Forecasting of Tomorrow (PROSWIFT) Act of 2020.
WPC Conducting the 12th Annual Winter Weather Experiment
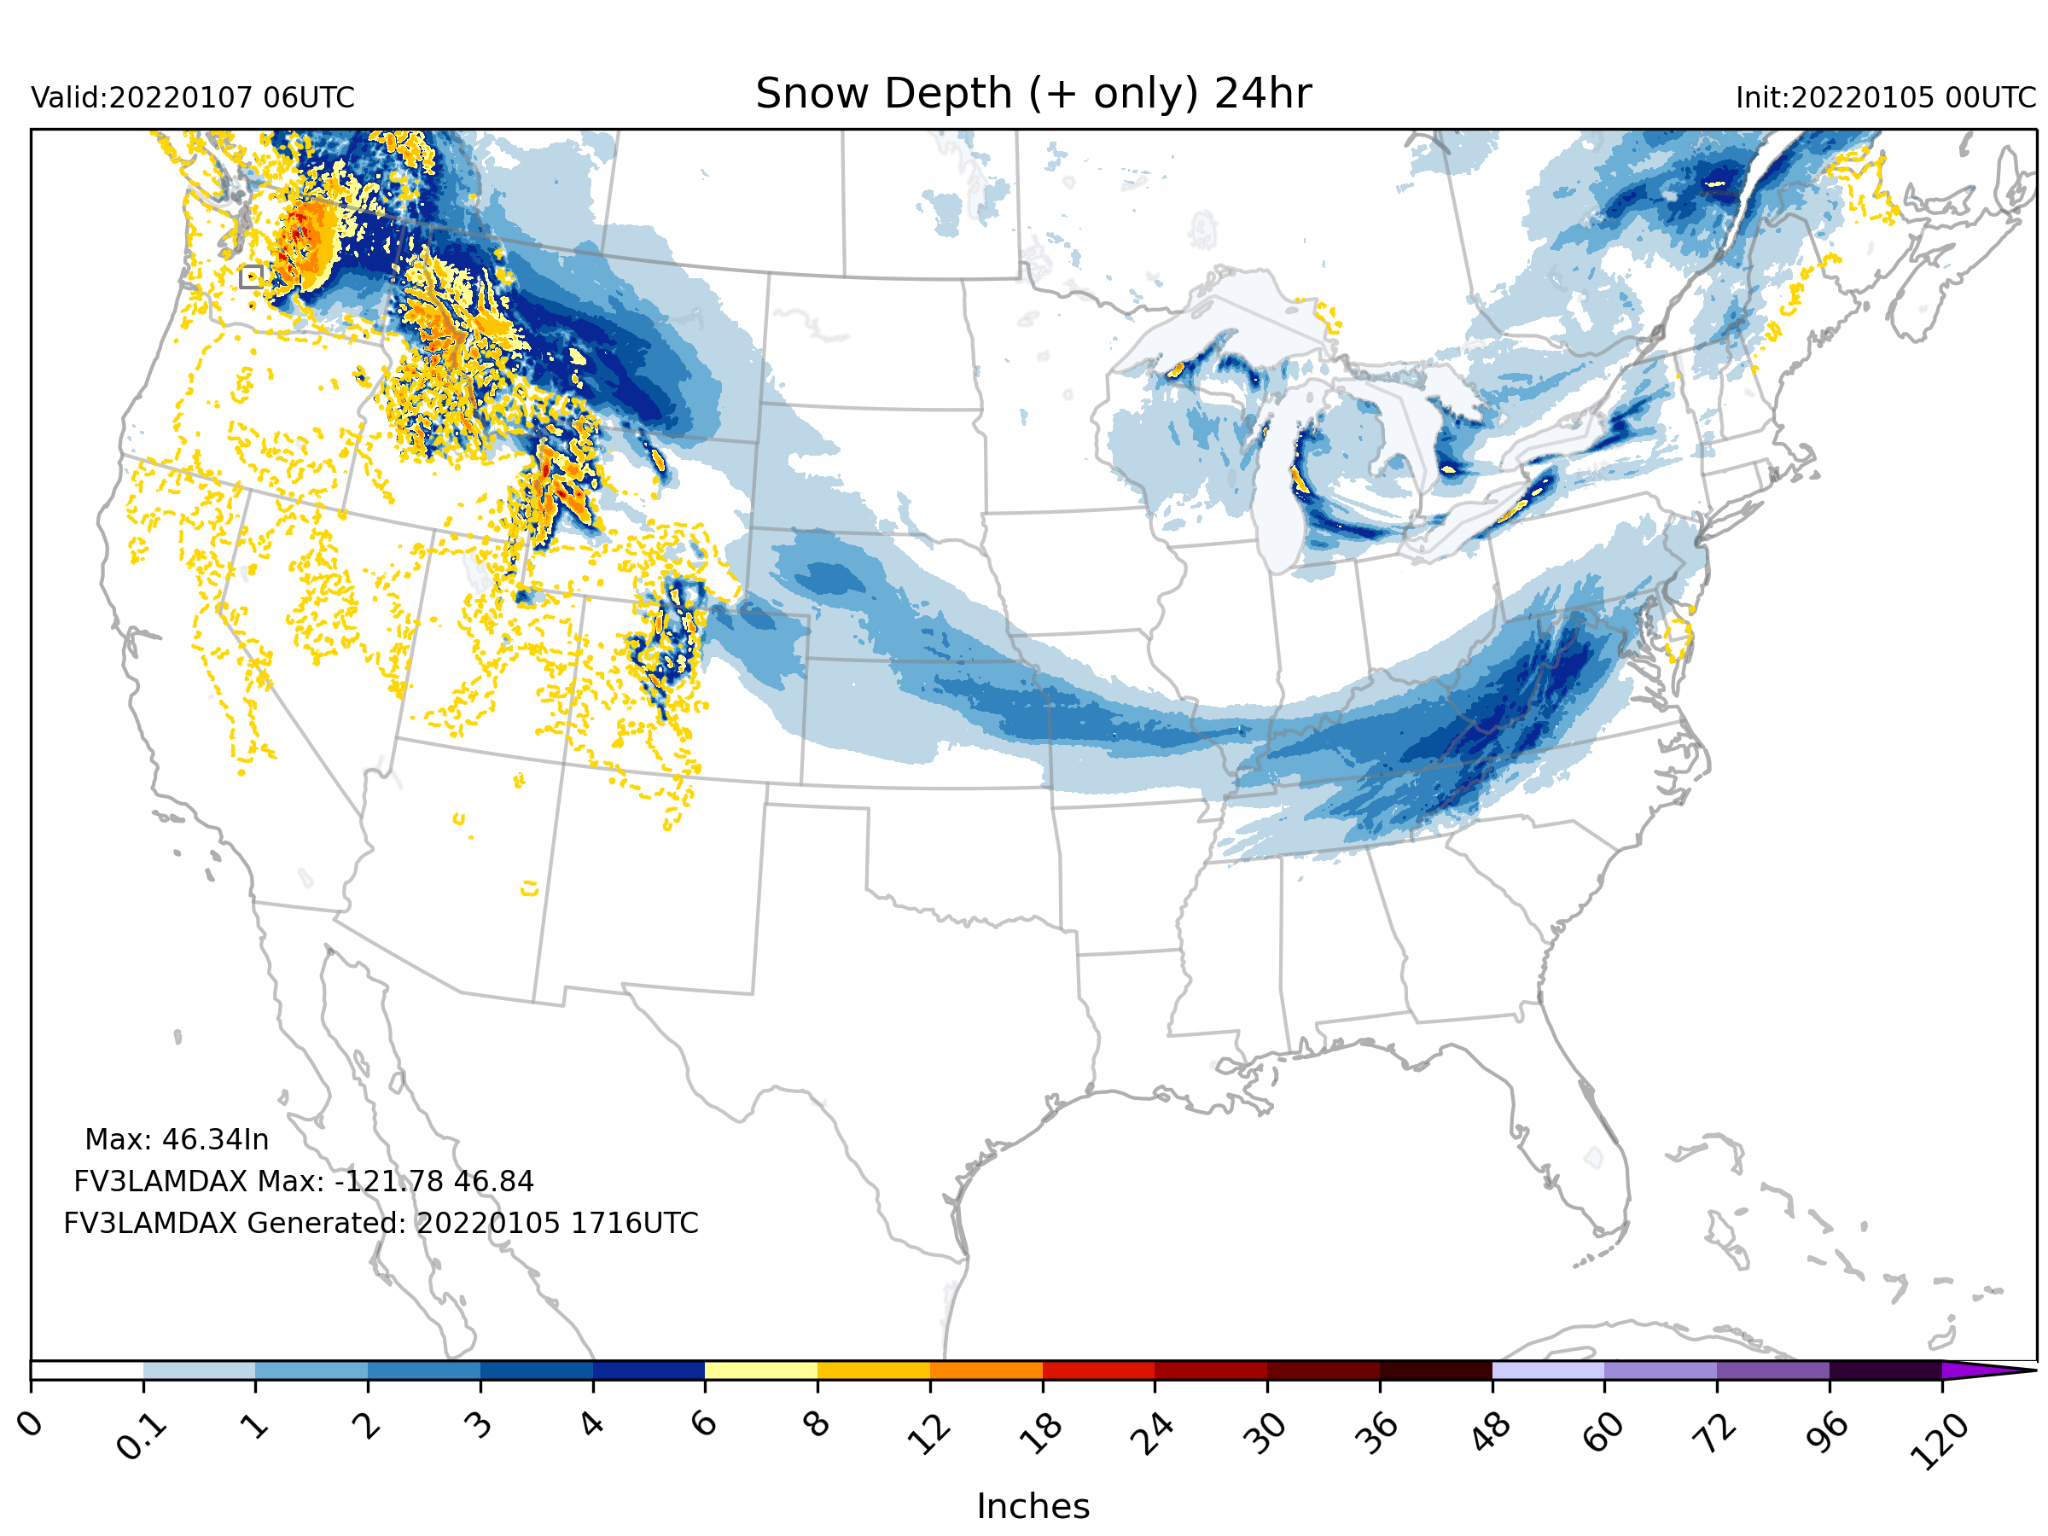
An example of experimental guidance that is evaluated during the WWE
In support of the ongoing mission to improve NWS products and services for winter weather, the Hydrometeorology Testbed (HMT) within the Weather Prediction Center (WPC) will conduct the 12th annual Winter Weather Experiment (WWE) during the weeks of February 7 and February 28. The WWE provides collaborative research to operations (R2O) experience bringing together members of the forecasting, research, and academic communities to evaluate and discuss winter weather forecast challenges. Recent WWE successes include improvements to the National Blend of Models, incorporation of snow squalls to the mPING crowd-sourcing data app, and increased discussion on the creation of winter specific verification metrics.
As the WWE moves into its 12th year, HMT staff seek to continue evaluations on the next generation of NWS deterministic and ensemble forecast systems. This year will also continue to explore the use of impact based assessments and insights into the forecast process. Building on the success of previous years, the WWE will once again be fully remote and will utilize retrospective case studies to examine the experiment objectives.
AWC Participates in 2022 Women in Aviation International Conference
Aviation Weather Center (AWC) Senior Forecasters Amy Macpherson and Brandy Bourque along with NOAA Corps Officer John Rossi hosted booths at the 33rd annual Women in Aviation International Conference in Nashville, TN March 17-19, 2022. With attendance of over 4000 and 176 different companies present, this was a very high energy, positive conference promoting women working in all aspects of aviation including flight students, instructors, private and commercial pilots, aircraft mechanics, the FAA, and military pilots such as those with the Space Force and NOAA Hurricane Hunters. Forecasters Caroline Adcock and Faith Borden from Weather Forecast Office Nashville, TN were also able to join the AWC at the booth, promoting aviation services across the entire National Weather Service. In addition to the exhibit hall, leading women in the aviation industry gave powerful and inspiring speeches of their personal career experiences and challenges. Pilots and aspiring pilots alike relayed how widely used and appreciated the AWC forecast products are across the aviation industry. Flight schools and students specifically expressed how useful and important the Graphical Forecast for Aviation (GFA) tool on the aviationweather.gov website is for them and their education. Next year’s Women in Aviation International Conference will be held in Long Beach, CA February 23-25, 2023.


AWC Unveils Beta.AviationWeather.gov
AWC is excited to announce the release of beta.aviationweather.gov as of March 29, 2022. The new design focuses on improved consistency, supportability, mobile friendliness, performance, ease of use, and ease of new development. The Public Information Statement can be found here, and feedback is welcome.

Climate Prediction Center Issues 2022 Spring Outlook
The Climate Prediction Center (CPC), along with the Office of Water Prediction (OWP), issued the Spring Outlook via a press release, press teleconference, and video on March 17, 2022. The Spring Outlook identifies areas at risk of spring flooding and expectations for temperature, precipitation and drought from April through June. More than half of the U.S. is predicted to experience above-average temperatures this spring, with the greatest chances in the Southern Rockies and Southern Plains. Below-average temperatures are most likely in the Pacific Northwest and southeast Alaska. Above-average precipitation is most likely in portions of the Great Lakes, Ohio Valley, mid-Atlantic and the west coast of Alaska, while below-average precipitation is forecast for portions of the Central Great Basin, Southwest, Central and Southern Rockies and Central and Southern Plains, eastward to the Central Gulf Coast.
The seasonal flood outlook indicated the potential for minor-to-moderate flood risk throughout much of the eastern half of continental U.S., including the Southeast, Tennessee Valley, lower Mississippi Valley, Ohio Valley, and portions of the Great Lakes, upper Mississippi Valley, and middle Mississippi Valley. An above-normal ice breakup and flood potential is also present in Alaska. And due to late fall and winter precipitation, major flood risk potential is present for the Red River of the North in North Dakota and the James River in South Dakota.
Drought is again the larger issue with nearly 60% of the currently experiencing minor to exceptional drought conditions with severe to exceptional drought persisting in some areas of the West since the summer of 2020 and the recent expansion of drought to the southern Plains and Lower Mississippi Valley. And drought is expected to persist through the Spring in many of these areas.
The press release can be found here:


April-June Temperature Outlook (left), April-June Precipitation Outlook (middle), and March – May Flood Outlook (right).
SWPC
February 2022 Space Weather Event and the SpaceX Starlink Satellite Loss
On Thursday, February 3rd at 1:13 p.m. EST, a SpaceX Falcon 9 rocket launched 49 Starlink satellites to Low Earth Orbit (LEO) from the Kennedy Space Center in Florida. SpaceX later reported the loss of up to 38 of the 49 satellites after encountering increased atmospheric drag due to a geomagnetic storm while performing orbit-raising maneuvers. https://www.spacex.com/updates/ (Feb 8, 2022). A series of Earth-directed and partially Earth-directed Coronal Mass Ejections (CMEs) were detected by SWPC between January 29-31, 2022, and were expected to arrive at Earth on February 2nd, generating a minor geomagnetic storm on February 3rd-4th. Even though this was considered only a minor geomagnetic storm, it led to thermospheric expansion that significantly enhanced the neutral density in the LEO environment impacting the Starlink satellites.
SWPC had several watch, warning, and alert products in effect for this event beginning on January 31st and continuing through February 5th. Commercial satellite operators receive general forecasts, watches, warnings, and alerts through NOAA’s data and web services, but none of these products are currently specifically targeted to satellite drag at LEO. SWPC’s newest operational space weather model, the Whole Atmosphere Model - Ionosphere Plasmasphere Electrodynamics Model (WAM-IPE), implemented in July 2021, was able to capture the global neutral density enhancement which increases satellite drag. The WAM-IPE model showed increases in neutral density by more than 100% at most altitudes following the February 3rd storm (see Figure 1). These increases persisted through February 5th.
SWPC has been working closely with the Starlink team to analyze the upper atmosphere environment for the event. The Starlink team has started using the WAM-IPE neutral density values for their drag estimations, and motivated by this engagement with the Starlink team, SWPC is actively exploring new products tailored for satellite drag.

Figure 1. WAM-IPE simulation of neutral density (top) and density anomaly (bottom) at 210 km during the geomagnetic storm at 13:10 UT on February 4, 2022.
WPC Embarks on QPF Collaborative Forecast Process Demonstration

An example of the Graphical Forecast Editor (GFE) tool used to edit and collaborate the QPF
Collaboration is foundational to the success of the NWS, and a collaborative forecast process has been a part of the NWS in various manners for decades, but not necessarily always in a uniform way. A key forecast parameter is Quantitative Precipitation Forecast (QPF), which is currently created by multiple entities in the NWS field structure [Weather Prediction Center (WPC), Weather Forecast Offices (WFOs), and River Forecast Centers (RFCs)]. To improve and integrate the QPF process, and given the increased needs for NWS partners, the NWS recently initiated a collaborative forecast process (CFP) demonstration for QPF.
The QPF CFP goal is “one event, one forecast” through the delivery of a single, seamless, and coherent NWS precipitation forecast. This will be achieved by integrating input from local, regional, and national levels in a collaborative manner with clear roles and responsibilities. The objective is to improve the quality, consistency, and accuracy of QPF.
The QPF CFP demonstration began earlier this year and ramps up later this spring with a formal 12-month demonstration period where WPC, WFOs, and RFCs engage in direct collaboration of the QPF using the National Blend of Models (NBM) as a common forecast starting point. WPC plays a critical role in rallying units to agreement on a consistent forecast. A single precipitation forecast will contribute to increased and improved Impact-Based Decision Support Services (IDSS), as well as instilling confidence in, and a sense of a value among, precipitation forecasters. The QPF CFP enables highly-skilled forecasters across the Nation to leverage the best of one another’s talents to serve our partners and the public toward the NWS goal of “one event, one forecast.”
AWC National Aviation Meteorologists Provide CNBC Interview
Aviation Weather Center (AWC) National Aviation Meteorologists embedded within the FAA Air Traffic Control System Command Center (ATCSCC) in Warrenton, VA were featured in an interview on the impact of aviation weather to the National Airspace System. The interview aired on June 14, 2022. The NAMs provided insightful information which demonstrated the collaborative relationship with partners. The team highlighted the everyday impact decision support services they provide.

AWC NAM Kyle Struckmann
NCO
NCEP Production Suite Transition and Go-Live
NCEP Central Operations (NCO), in partnership with 9 development organizations, successfully transitioned the operational modeling suite onto the next phase of the Weather and Climate Operational Supercomputing System (WCOSS), going live on June 28, 2022. The two new Cray supercomputers are located in Manassas, Virginia (AKA Dogwood) and Phoenix, AZ (AKA Cactus). On the TOP500 list, they rank as numbers 49 and 50 fastest in the world, each providing 12.1 petaflops of computing speed, approximately three times faster than the previous systems. Over 45TB of data is disseminated off the system each day to serve the NWS offices, centers, and regions, our Government partners, and the public user community worldwide. Public users pull over 400TB of WCOSS model data per day from our dissemination websites.
This transition was an effort put forth from every branch within NCO. The Network and Security Branch (NSB) stood up a brand new 100Gb circuit that created a ring of redundancy and provided the security approval into our FISMA-high (FISMA stands for the ‘Federal Information Security Management Act,’ which set the security guidelines to protect government information) boundary. The Infrastructure and Web Services Branch (IWSB) created the virtual machines that provide administrative support access. The Software Development Branch (SDB) provided necessary code updates to port the Model Analyses and Guidance (MAG) website image creations. The Operational Monitoring Branch (OMB) provided dual monitoring support during the transition, as well as software code updates. And last, but not least, the Implementation and Data Services Branch (IDSB) SPA and Dataflow teams worked together to ensure that all of the data, the 84 packages within the suite, the 450 user accounts, and the 112,000 daily jobs that make up the NCEP production suite were ready for an operational take-over. NCO’s contributions and dedication to this multi-year project produced a completely seamless cutover on go-live day, paving the way for the next generation of models and upgrades.
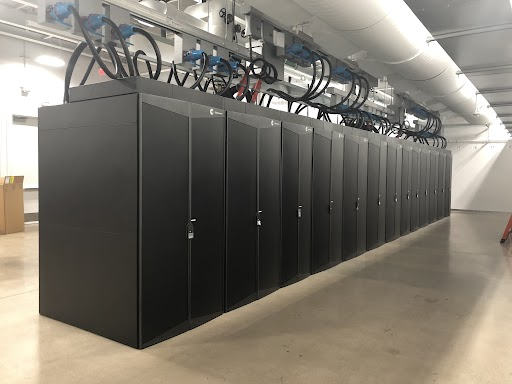
Cray Supercomputer - Cactus, Located in Phoenix, AZ
On May 25th and 26th, SWPC hosted a NOAA-NASA workshop to address NOAA’s support of NASA’s human space flight initiatives. In addition, participants discussed opportunities to accelerate and enhance the research-to-operations (R2O) and enhance operations-to-research (O2R) processes.
NOAA has a proud history of space weather support for NASA human spaceflight that dates back to the Gemini missions in the 1960s and continues today. Humans in space are exposed to ionizing radiation from the space environment, and occasionally, the radiation exposure can reach very high, mission-impacting levels. Space weather support is necessary to provide warnings of enhanced radiation levels so that appropriate actions may be taken to protect astronauts. SWPC provides 24/7 support for NASA through the NASA Space Radiation Analysis Group (SRAG) at Mission Control, Johnson Space Center.
At the May 2022 workshop, SRAG presented a concept of operations for space weather events for the upcoming Artemis missions, with a focus on detailed and accurate advanced warnings of solar radiation storms. The workshop participants discussed the development of advanced operational capabilities for observing and forecasting the space radiation environment in support of the International Space Station (ISS), Artemis Gateway, and Lunar surface missions. Key to the discussions was how SWPC would collaborate with the relatively new NASA Moon-to-Mars (M2M) space weather office, which will serve as an operational proving ground for pre-deployment testing and operational readiness evaluation of models and tools for SWPC operations.
SWPC and NASA discussed ways to improve the O2R grants process, including the creation of transition step funding to help new capabilities reach a higher readiness level (RL) before entering one of the space weather proving grounds. Three R2O quick wins were identified for completion by next summer. Those quick wins were in the areas of proving ground/testbed, O2R program, and atmospheric neutral density that will demonstrate progression in the R2O process to a higher RL and have a concrete benefit to space weather operations.

WRN FLYERS Hosts Virtual Workshop for General Aviators on Newly Enhanced AWC Website
The WRN FLYERS (FLYing Education, Resources, and Safety) Team recently hosted a virtual workshop specifically for the GA (General Aviation) community to highlight the redesigned and enhanced Aviation Weather Center website (beta.aviation weather.gov). This workshop was a wonderful opportunity for AWC’s web developers to receive feedback and suggestions from the people who use the website every day as well as to increase awareness for the GA community ahead of the site’s official launch this winter.
AWC Techniques Development Meteorologist Austin Cross first discussed the reasons to upgrade and then conducted a live demonstration with support from CIRA associate Nicole Stevens and AWC meteorologist Lewis Kanofsky. After the demonstration, GA participants followed up with questions about the website’s layout, content, data availability, and new products and tools. AWC WCM Jennifer Stroozas, AWC Senior Forecaster Amy Macpherson, and AWC Lead Forecaster Scott Minnick also assisted with planning, organizing, and running the webinar. Pilots who registered for the webinar were able to claim WINGS credit for their attendance.
The recorded webinar is available here. A self-guided website tutorial is also available at https://beta.aviationweather.gov/help/ .
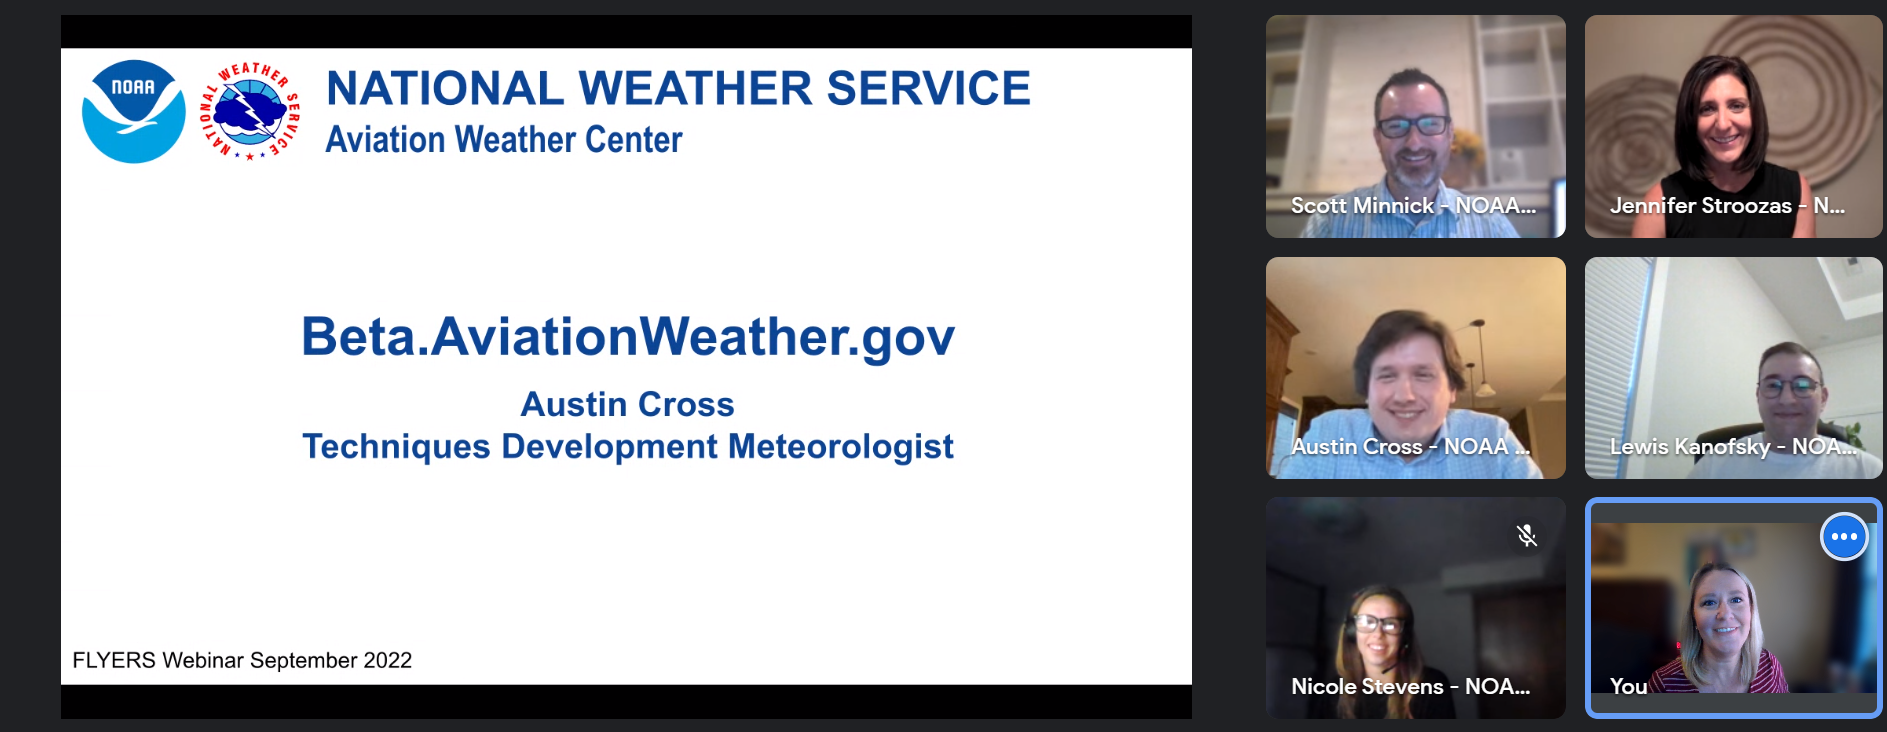
Aviation Weather Center Testbed Summer Experiment
The 2022 Aviation Weather Testbed (AWT) Summer Experiment took place September 13-16 at the Aviation Weather Center (AWC) in Kansas City, MO. This was the first fully in-person experiment since the 2019 Summer Experiment! Participants included developers from the Earth System Research Lab (ESRL), Environmental Modeling Center (EMC), and the Weather Prediction Center (WPC), meteorologists from multiple NWS forecast offices, AWC, and Center Weather Service Units (CWSU) as well as Southwest Airlines.
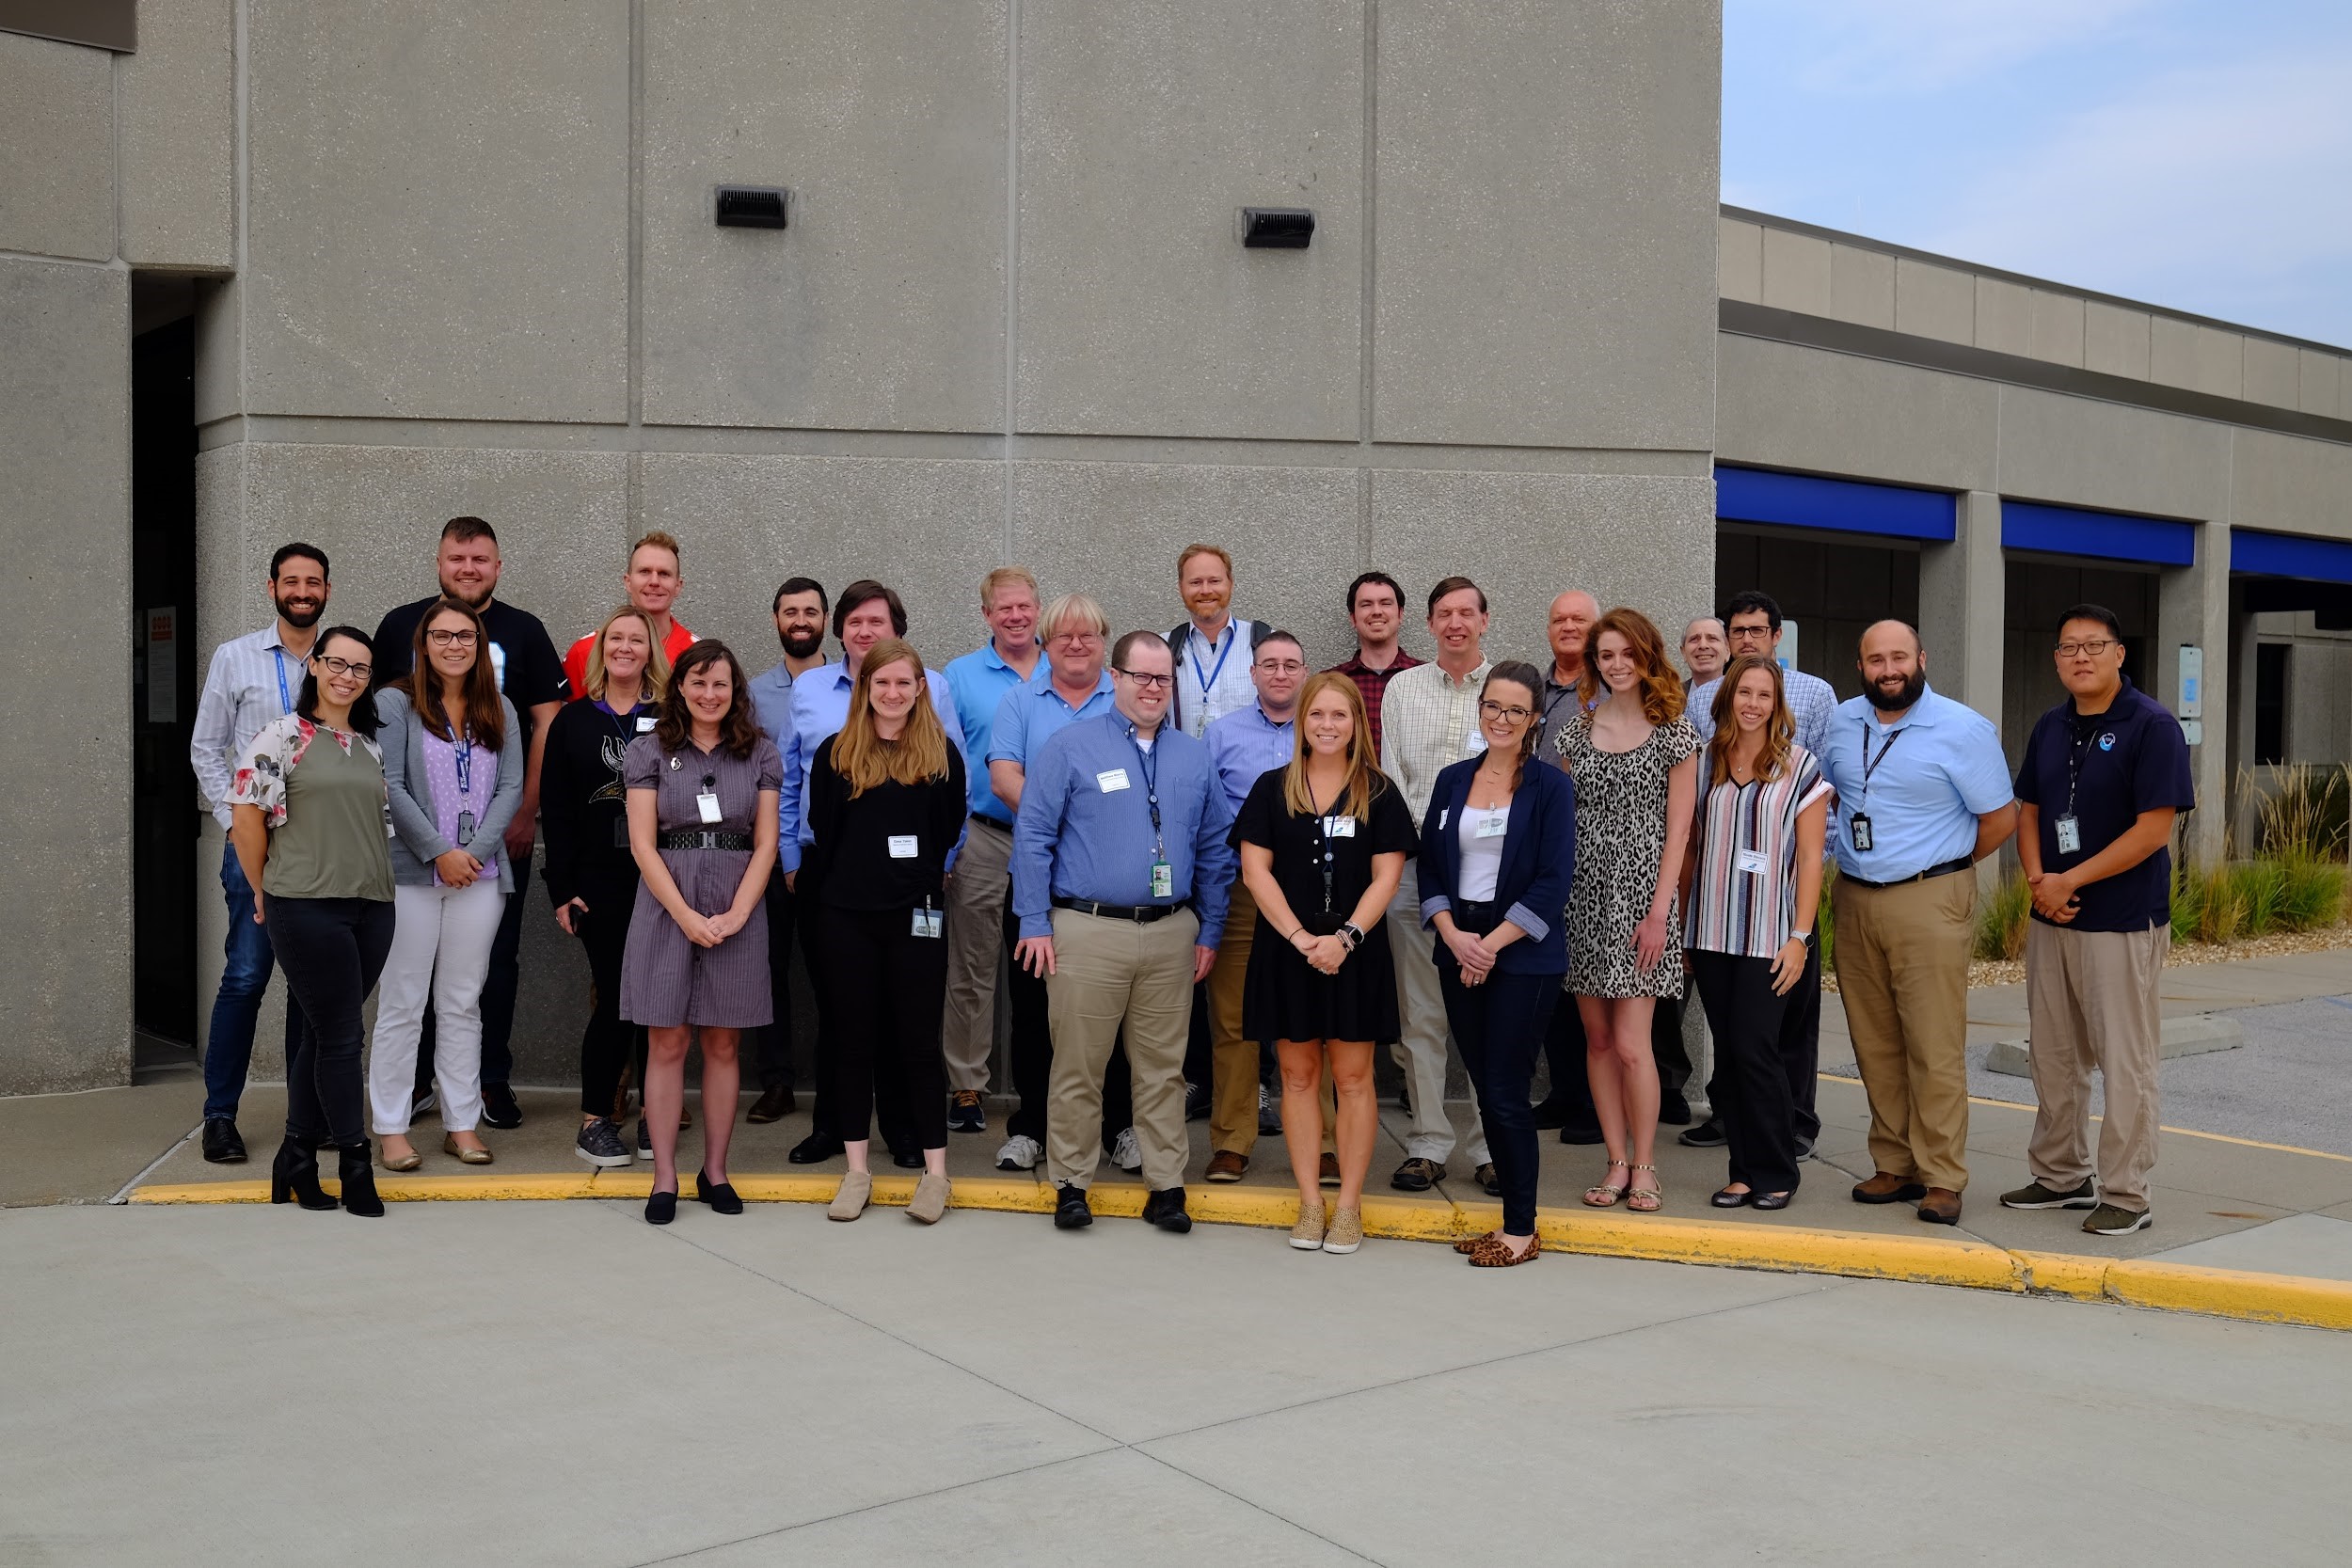
The 2022 Aviation Weather Testbed Summer Experiment Participants
In addition, AWC was excited to collaborate with members of the Warn-On-Forecast System (WoFS) group from the National Severe Storms Laboratory (NSSL) to test the utility of WoFS for short-term convective planning in the National Airspace System (NAS). Patrick Burke, Heather Reeves, and Patrick Skinner were all in attendance to help facilitate the use of WoFS during the week.
There were two major themes, or “desks”, explored during the experiment. The first desk looked at evolving the current Traffic Flow Management Convective Forecast (TCF) by utilizing AWIPS for product production, the inclusion of experimental Rapid Refresh Forecast system (RRFS) model data, and the utilization of WoFS to aid in developing a 2hr TCF forecast to close the “watch-to-warning” gap between the Convective SIGMET product and the 4hr TCF forecast.
EMC
Environmental Modeling Center (EMC) Scientist Dr. Vijay Tallapragada Becomes a Senior Scientist and an AMS Fellow
Dr. Vijay Tallapragada (Modeling & Data Assimilation Branch) has been appointed as a Senior Scientist and an AMS Fellow. Over his career in NOAA and the NWS, Dr. Tallapragada has worked relentlessly to improve operational modeling systems. In his new role, Vijay will focus on technical direction for a revamped production suite and engagement with the community as EMC continues to embrace open development of NWS operational modeling systems. Vijay was also elected as an AMS Fellow, a move that was based on his contributions to the development of modeling systems that protect lives and livelihoods, his scientific contributions documented in the peer-reviewed literature, his service to the meteorological community, and his mentoring of students and early-career scientists.

Vijay Tallapragada; photo courtesy of EMC Director Brian Gross.
Space Weather Prediction Testbed Experiment for Aviation
September 20-22, the Space Weather Prediction Center held our inaugural Space Weather Prediction Testbed Experiment. This 3-day event brought together representatives from all the major airline companies, including Flight Operations, Flight Safety, Dispatch, Meteorology, Pilots Union Air Traffic Management and Communications Groups; Space Weather Operations and Scientists from the USA, Canada, and the UK; and Commercial Service Providers. The main objectives of the Testbed Experiment were to better prepare the aviation community for the upcoming solar maximum; to better understand the airlines’ operational procedures responding to space weather alerts and warnings; to communicate the requirements and limitations based on the current space weather tools, and to explore future capabilities in support of the needs of the aviation community. This inaugural Testbed Experiment was an essential step in SWPC’s plans to develop a fully functional Space Weather Prediction Testbed. The Testbed Exercise and Experiment explained and assessed the current aviation products and services at SWPC (both ICAO and SWPC products) in order to help identify priorities and improvements that can be implemented in the future. In total, we had 50 in-person and 40 virtual participants attend this event, most of whom were external to SWPC. Within NOAA, participants from the Aviation Weather Center (AWC), the Social, Behavioral, and Economic Science Program (SBES), the Performance, Risk, and Social Science Office (PRSSO), and NESDIS contributed to the success of the experiment by providing their diverse perspectives during the discussions.
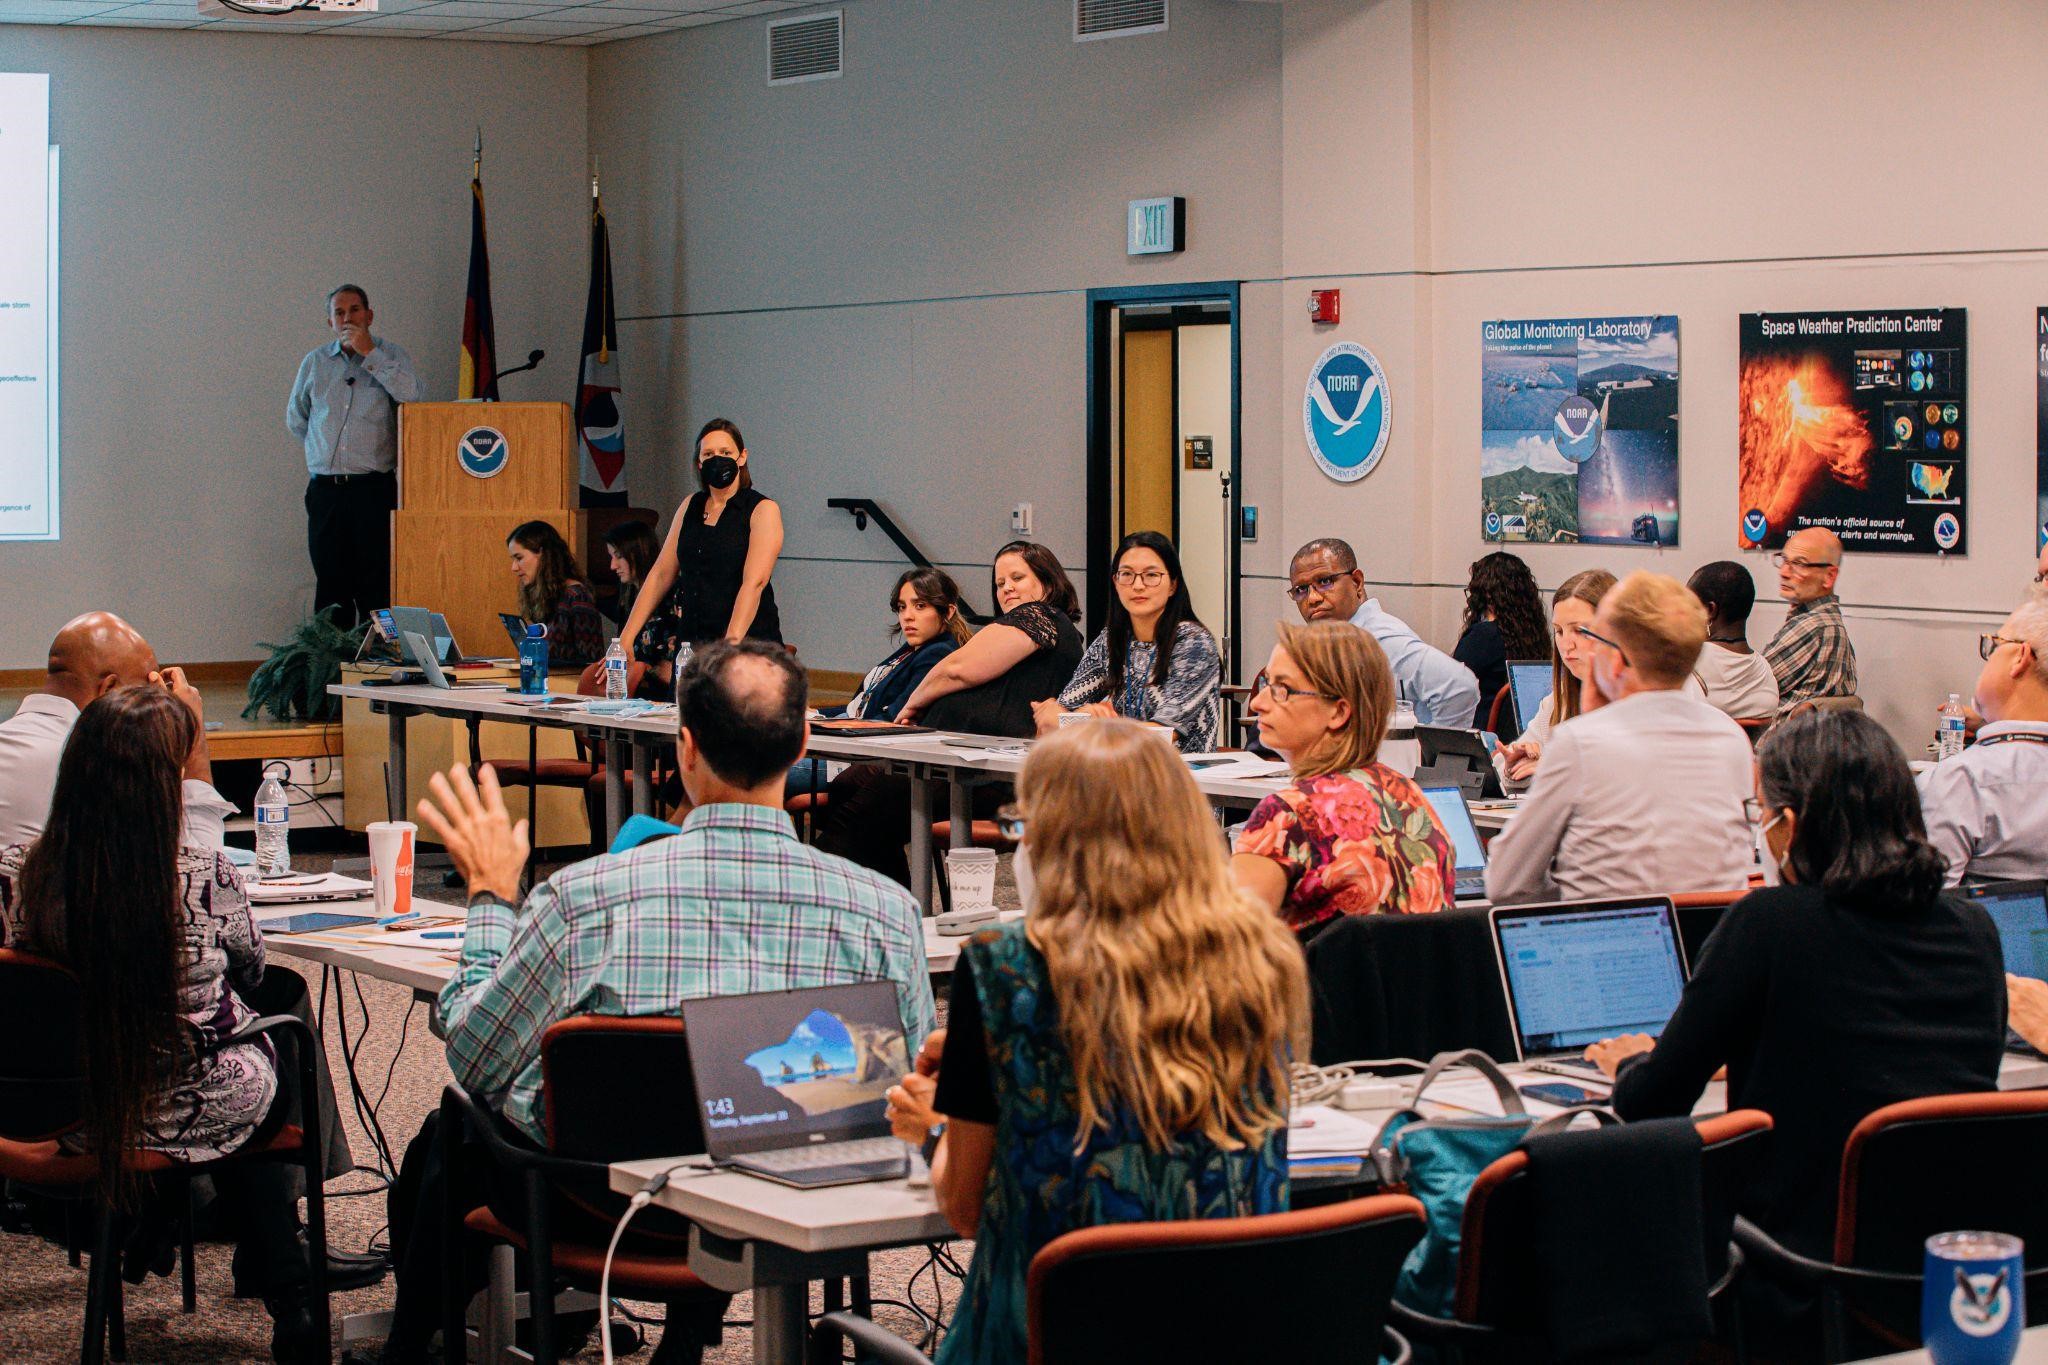
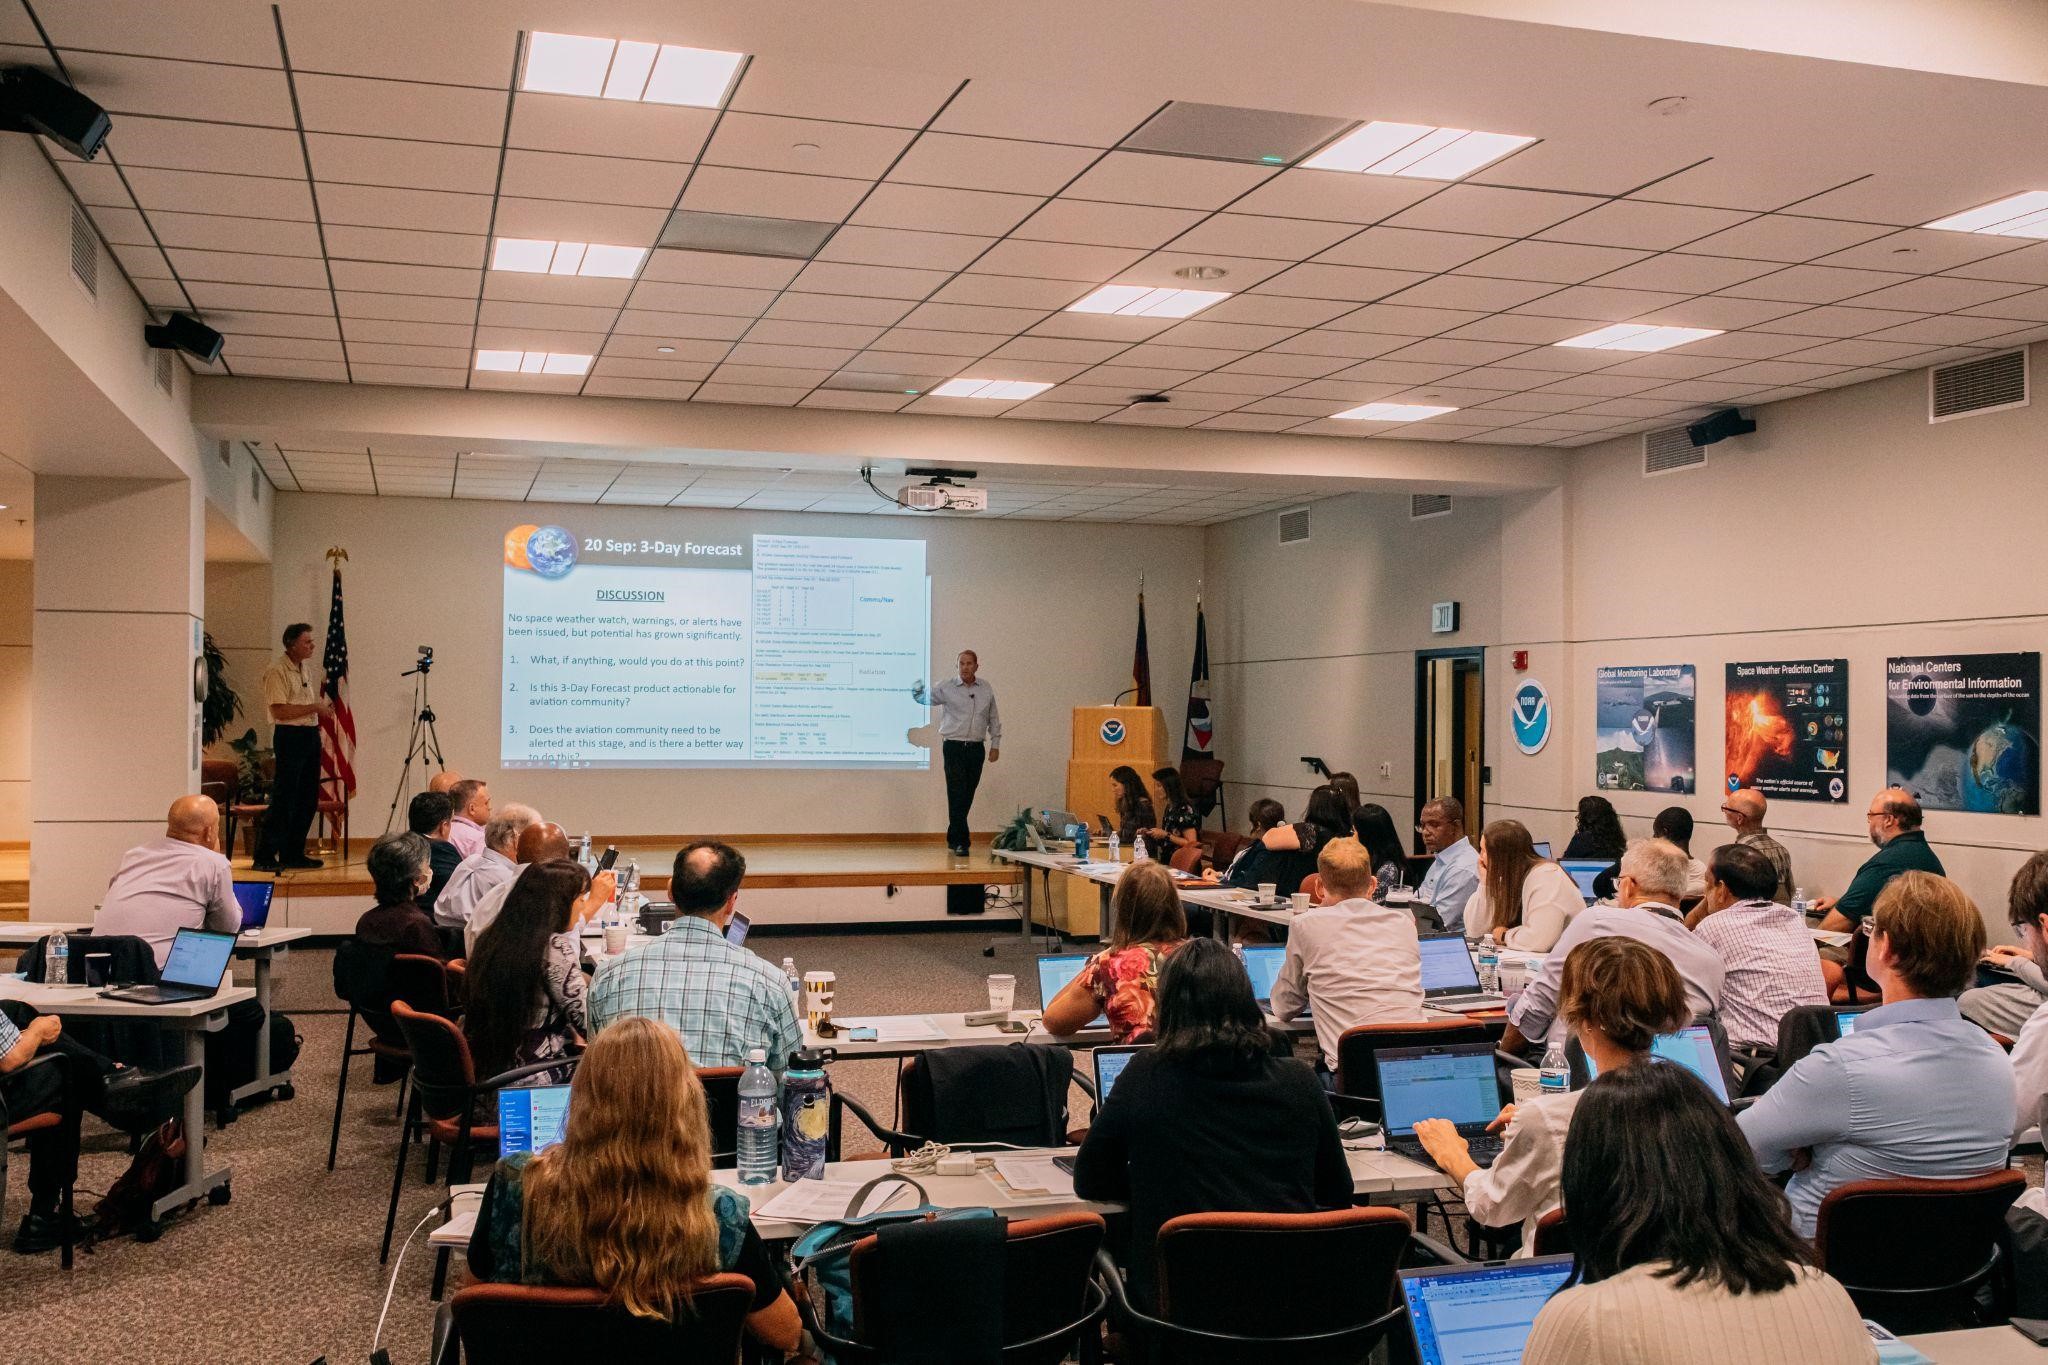
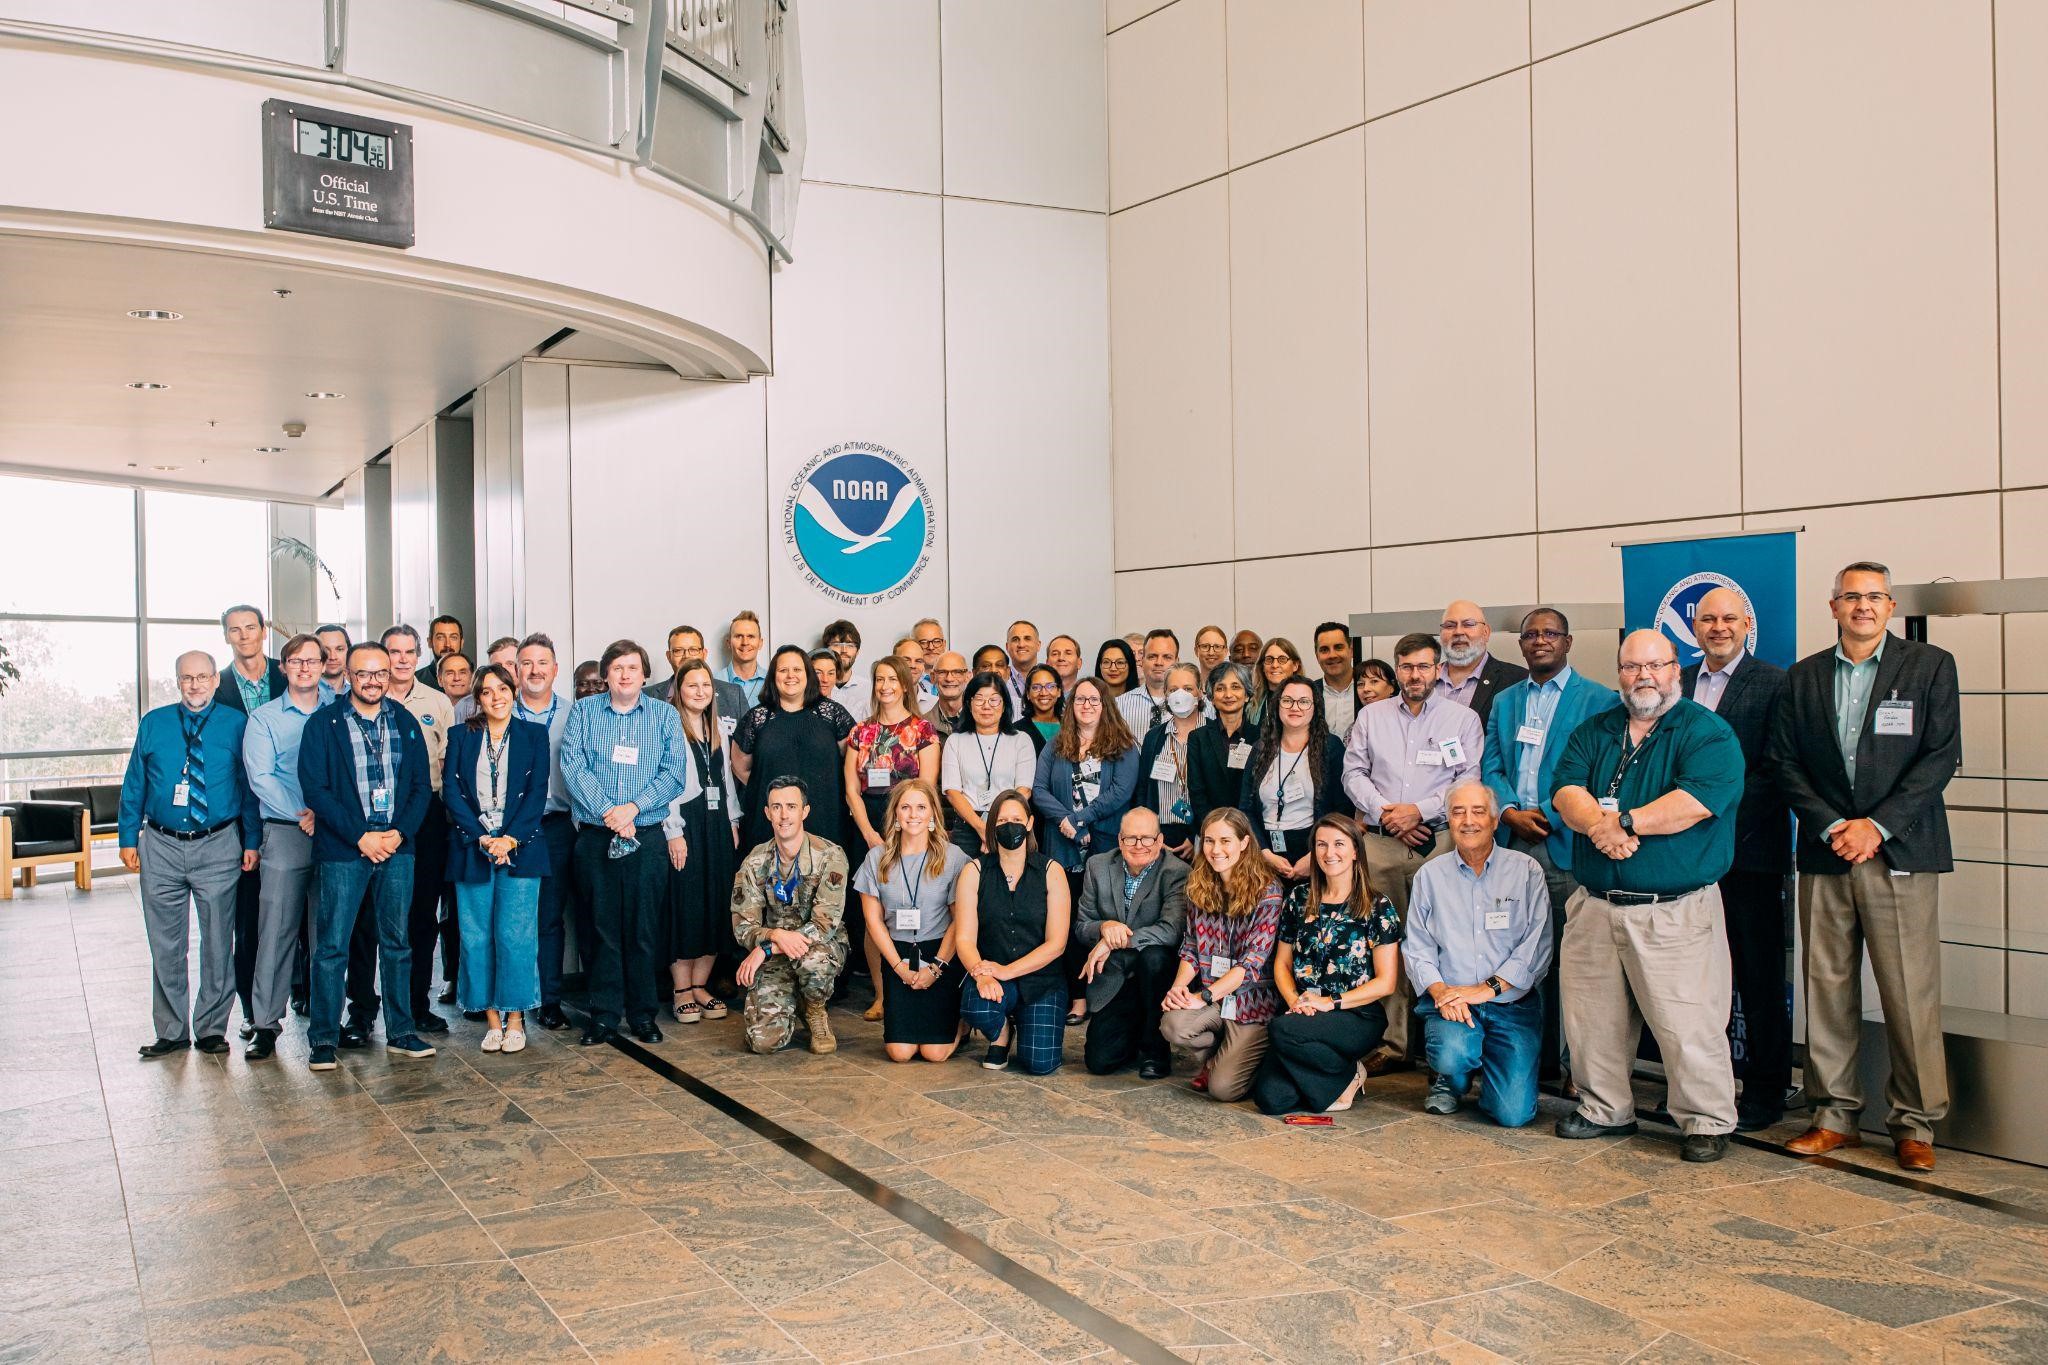
WRN FLYERS Host Live Workshop for General Aviators
The WRN FLYERS (FLYing Education, Resources, and Safety) Team recently hosted its first live workshop specifically for the GA (General Aviation) community in the Kansas City area since the pandemic began in 2020. This workshop focused on turbulence with presentations from operational meteorologists from AWC, ZKC Center Weather Service Unit, and the NWS office in Topeka. The first group of talks focused on low level and high level turbulence mechanisms and detection. In addition to the operational meteorologist perspective, two guest speakers were featured. First up was Mark Boguski, a local instructor pilot, who talked about turbulence impacts on general aviation interests. AWC’s Executive Officer from the NOAA Corps, CDR John Rossi, closed out the workshop discussing the hazards and challenges of working aircraft in turbulence to complete science missions.
Perhaps the highlight of the conference was the face-to-face interaction that hasn’t been able to take place in over two years. AWC and the FLYERS look forward to continued collaboration and additional live workshops in 2023 to promote aviation weather hazard awareness and education.
Attendees received continuing education credit through the FAA’s WINGS pilot proficiency program. WINGS is designed to reward pilots for continued education and includes weather training. If you are interested in learning more about WRN Aviation Ambassadors and FLYERS, WINGS, or general aviation outreach, please contact the team at wrn.flyers@noaa.gov. More information about WRN Aviation Ambassadors can be found on the WRN website.
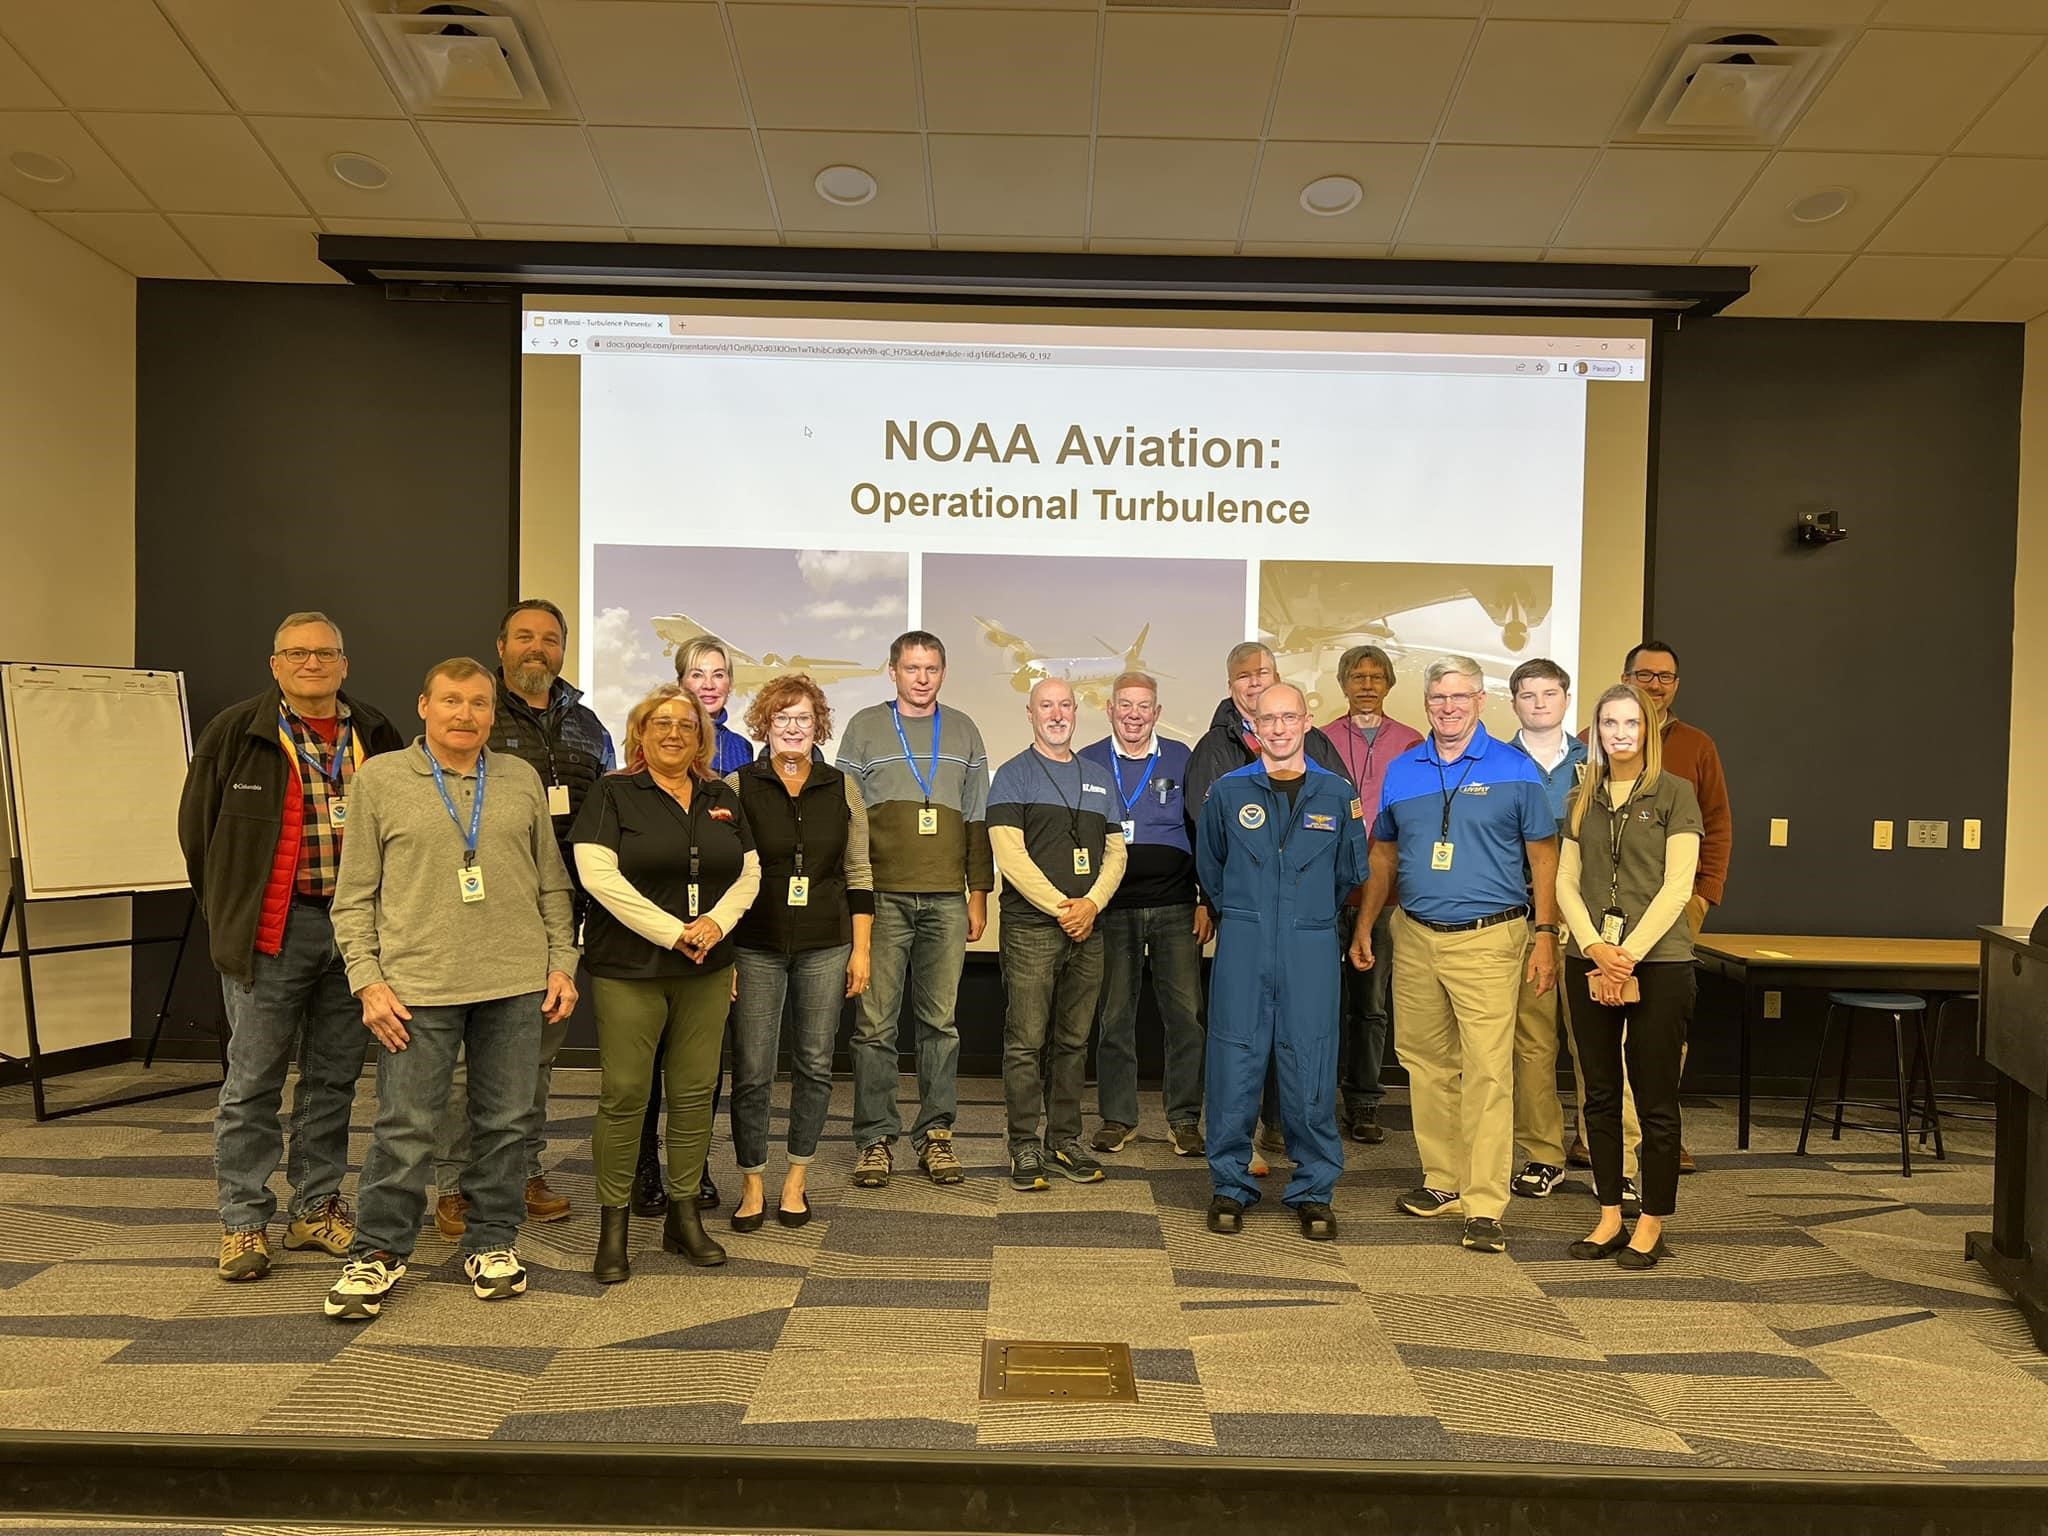
Environmental Modeling Center (EMC) Upgrades the Global Forecast System (GFS)
NCEP implemented the Global Forecast System (GFS) Version 16.3 on Wednesday, November 30, 2022 at 1200 GMT. The GFS was upgraded to improve internal flight planning and global aviation safety; ameliorate an issue with the snow depth prediction; and improve the use of observations and add newly available types. GFS V16.0 overestimates the accumulated snow depth for mixed precipitation events with marginal temperatures and under predicts for events with very cold temperatures. The undesired snow depth predictions are associated with Geophysical Fluid Dynamics Laboratory (GFDL) microphysics and the improper density used in the Noah land surface model for different frozen precipitation types. This issue is being addressed by providing proper density to various frozen hydrometeors in the land surface model. The GFS Unified Post Processing (UPP) system and the World Area Forecast System (WAFS), the GFS physics in the Noah land surface model, and the Grid-point Statistics Interpolation (GSI) Analysis are also upgraded. The UPP and WAFS upgrades increased the vertical/temporal resolution and forecast range on 0.25-degree WAFS products, and the post-processing changed to create continuous bucket precipitation product for WGNE (Working Group for Numerical Experiments). The upgrades in the data assimilation system are to improve the use of existing observations, add newly available observations, enhance the Near Sea Surface temperature (NSST) analysis, and fix several bugs.
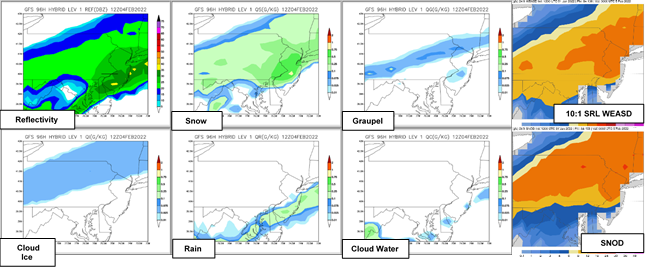
GFSv16.1 overestimated SNOD (accumulated Snow Depth) during the February 2022 winter storm due to cloud ice, graupel, and freezing rain being incorrectly tallied in the SNOD totals. This caused SNOD totals to be even larger than the WEASD (Water Equivalent of Accumulated Snow Depth) totals, which include snow and sleet. GFSv16.3 corrects the density of graupel and freezing rain and reduces the SNOD overestimation. Reducing the amount of precipitating cloud ice is a science change that will be included in the GFSv17 upgrade. Graphics were produced by NCEP/EMC.
TITLE OF ARTICLE: NCEP Central Operations Network Enhancements ARTICLE:
The NCEP Central Operations (NCO), Network and Security Branch (NSB) completed two highly complex projects to 1) improve the network redundancy for OneNWSNet and 2) upgrade the web hosting network throughput in College Park and Boulder; the two major data centers. Before this work, OneNWSNet was not capable of routing Internet traffic through a secondary exit point. NSB created the ability to failover Internet access to the secondary data center in Boulder. This effort took several months of analysis, architectural review and planning, and the modification of hundreds of lines of configuration in order to be successful. This enormous achievement not only improves the resiliency and redundancy of OneNWSNet, but it also lays the foundation for future network optimization and decreases the likelihood of significant network impact during future maintenance. Additionally, NSB increased the NCO web hosting capacity from 40 gigabits per second (Gbps) to 100Gbps. The catalyst for taking on this effort was that over time as user demand grew, a bottleneck was formed that would prevent all of IDP (Integrated Dissemination Program) from operating in one data center at a time. Several project dependencies were identified before NSB was able to upgrade this capacity, including software upgrades on all core networking infrastructure. After months of scheduling, planning, and executing upgrades, NSB was able to seamlessly transition to new hardware and improve the network throughput for IDP.
2022 CO-LABS Governor's Awards for High-Impact Research - Technology Transfer Winners
The annual CO-LABs (https://www.co-labs.org/) Governor's Awards for High-Impact Research celebrate the brilliant ground-breaking discoveries and innovative research from Colorado’s federally-funded laboratories and institutions. This year, a team of SWPC and EMC scientists won the Technology Transfer Award for their work transitioning the physics-based WAM-IPE model into NOAA Space Weather operations. The first of its kind, the coupled Whole Atmosphere Model and Ionosphere Plasmasphere Electrodynamics Model (WAM-IPE Model) was moved into operations in July 2021. This model helps predict how Earth’s upper atmosphere will respond to solar and geomagnetic conditions as well as the perturbations from the lower atmosphere. The implementation of this model represents the culmination of more than a decade of work and serves as an exemplary Research to Operation (R2O) success story. The model enhances the Space Weather Prediction Center’s space weather forecasting capabilities by assisting forecasters in providing better information to the public regarding potential impacts from solar storms and enables mitigation across varied economic sectors. Its real-time and forecast neutral density fields will be available for orbit prediction and space situational awareness purposes, and the ionospheric outputs from the model will also be used to support the International Civil Aviation Organization (ICAO) space weather alerts. As part of the award, in addition to receiving recognition from the Colorado Governor at a reception on December 14th, a short 3-minute video highlighting the science was created by Fireside Production studio.

Caption: Screen capture from the video created for the 2022 Governor's Awards for High Impact Research by Fireside Production studio. Top from left to right, Dr. George Millward, Dr. Timothy Fuller-Rowell, Dr. Zhuxiao Li. Bottom center, Dr. Tzu-Wei Fang.

Caption: The WAM-IPE space weather award team from left to right, Dr. Timothy Fuller-Rowell, Dr. Tzu-Wei Fang, Mr. Adam Kubaryk, Dr. George Millward, Dr. Raffaele Montuoro (EMC), and Dr. Zhuxiao Li. Denver, Colo, Dec. 14, 2022.
Metro Aviation Recognizes Aviation Weather Center Techniques Development Meteorologist Austin Cross
On February 8, AWC Techniques Development Meteorologist Austin Cross was recognized by Matt Johnson on behalf of Metro Aviation “for his dedication and commitment to the advancement of weather products serving Air Medical Helicopters throughout the United States'' at the 9th Annual United States Helicopter Safety Team Low Altitude Aviation Infrastructure Summit for Vertical Flight in Washington, DC. Austin has worked with this partner base for several years to make enhancements to the AWC Helicopter Emergency Services (HEMS) tool, focusing on low-altitude aviation weather and hazard information. Austin’s most recent work has focused on transitioning the HEMS tool to the Graphical Forecast for Aviation - Low Altitude (GFA-LA) tool, seamlessly integrating two tools into one on AWC’s experimental website. The AWC experimental website is slated for official release later this spring.
Congratulations to Austin on this well-deserved recognition!
Pictures caption: Matt Johnson of Metro Aviation presents a plaque to AWC Techniques Development Meteorologist Austin Cross


Aviation Weather Center Attends Women in Aviation International Conference
Warning Coordination Meteorologist Jennifer Stroozas and Senior Meteorologist Brandy Bourque represented the Aviation Weather Center (AWC) at the 34th annual Women in Aviation International (WAI) Conference in Long Beach, CA February 23-25. During this time, a historic storm was also impacting the area with heavy rainfall and even snow down into some surrounding valleys. Despite this, the conference boasted over 4,500 attendees, 136 of which were international representatives from 32 countries. The conference aims to encourage, support, and bring together women in all fields of the aviation industry from flight students, instructors, pilots, aircraft mechanics, the FAA, and military pilots, including those with the Space Force and our own family’s NOAA Corps Hurricane Hunters.
Brandy and Jennifer wo-manned a booth in the packed exhibit hall and brought awareness to the upcoming implementation of AWC’s currently experimental beta website. The upcoming Beta.AviationWeather.gov release is a complete redesign and mobile-friendly version of the current AviationWeather.gov. Private and commercial pilots alike were especially excited about this upcoming switch as many utilize tablets and smartphones to aid in their preflight planning. Also joining the NWS team were meteorologist James Oh of the Los Angeles CWSU and meteorologist Kristen Stewart from WFO Los Angeles. Their addition provided attendees the opportunity to converse and interact with meteorologists on the multiple levels and perspectives of aviation weather hazard communication. Next year’s annual WAI conference will be held in Orlando, FL March 21-23.

Pictured left to right: Meteorologist Kristen Stewart WFO Oxnard, WCM Jennifer Stroozas AWC, Senior Meteorologist Brandy Bourque AWC, Meteorologist James Oh CWSU ZLA

Booth shared by NWS and NOAA Aircraft Operations Center representatives at the 2023 WAI conference in Long Beach, CA
23-24 March 2023 Geomagnetic Storming Summary
On March 23-24, 2023, Earth was impacted by the most significant geomagnetic storm of the current solar cycle. The last G4 event was on November 4, 2021. It began as a Strong (G3) geomagnetic storm on March 23, 2023, at about 1500 UTC and peaked on March 24 at around 04:00 UTC as a Severe (G4) geomagnetic storm. The storm was significantly stronger than expected. On March 22, 2023, the Space Weather Prediction Center (SWPC) issued G1 and G2 watches for March 23rd and 24th respectively. The most likely source of the geomagnetic storm was a March 20th 15:34 UTC long-duration solar flare. SWPC and international partners’ modeling suggested, at best, a weak glancing geomagnetic storm.
Impacts
SWPC provided substantial IDSS to FEMA, NASA, the North American Electric Reliability Corporation (NERC), grid operators in Wisconsin (a particularly vulnerable area) and New York, FAA Air Traffic Control, and the Weather Company supporting United Airlines. SWPC provided 17 national, international, and local market media interviews.
Following the event, the National Security Council requested a hotwash of the G4 event, covering what happened, why the prediction was difficult, and the messaging that went out from NOAA and CISA. The proposed venue is the Homeland Preparedness and Response Interagency Policy Council (IPC), which is tentatively scheduled to meet on April 13th at 1:00 pm ET.
|
When (UTC) |
What |
|
3/23/23 16:53 |
Watches: |
|
3/23/23 09:05-15:00 |
WARNING: G1 - Minor |
|
3/23/23 12:34 |
ALERT: G1 - Minor |
|
3/23/23 14:20-21:00 |
WARNING: G2 - Moderate |
|
3/23/23 14:23 |
ALERT: G2 - Moderate |
|
3/23/23 14:47-18:00 |
WARNING: G3 or greater - Strong to Extreme |
|
3/23/23 14:49 |
ALERT: G3 - Strong |
|
3/23/23 17:22 |
ALERT G1 - Minor |
|
3/23/23 19:42 |
ALERT: G2 - Moderate |
|
3/23/23 19:50-03:00 |
WARNING EXTENDED: G2 - Moderate |
|
3/23/23 21:46 |
ALERT: G2 - Moderate |
|
3/23/23 22:50-03:00 |
WARNING: G3 or greater - Strong to Extreme |
|
3/23/23 23:54 |
ALERT: G3 - Strong |
|
3/24/23 02:00-09:00 |
WARNING EXTENDED: G3 or greater - Strong to Extreme |
|
3/24/23 04:04 |
ALERT: G4 - Severe |
|
3/24/23 08:59 |
ALERT: G3 - Strong |
|
3/24/23 09:01-12:00 |
WARNING EXTENDED: G3 or greater - Strong to Extreme |
|
3/24/23 12:00 |
EVENT ENDED |
Location: 20/1534 UTC Long duration C4.4 filament eruption centered near N29E20 near Rgn 3258. Partial Halo.


Courtesy: Jhelioviewer.org
Multiple parameterizations were made on CME from 20th Mar. Below is the fit and run that the forecast staff agreed on. However, there was no wide angle coronagraph (SOHO/LASCO C3) or STEREO Ahead coronagraph imagery. Location was near the source region which was good. Parameterization looked good. Started to see a rise in Total field around 23/0800z which coincided well with arrival prediction.

Below is the WSA ENLIL Model run on the CME from 20 March 2023. Several fits were conducted with an agreement reached on the parameters to input this run. Each run takes two hours to perform and must be input at specific times.

Below shows the arrival of the CME in NOAA/DSCOVR solar wind data around 0742 UTC on the 23 March. Lower energy protons from the NASA/ACE satellite confirms arrival at around 1000 UTC on 23 March. The CME itself was slow moving. For reference, nominal solar wind speeds run around 400 km/s.


By 1402 UTC on 23 March, Total field had increased to 22 nT while the Bz component reached -15 to -17 nT for over 14.5 hours. The prolonged strong southward Bz caused geomagnetic storming conditions at the G1 (Minor) - G4 (Severe) levels between 1200 UTC on 23 March through 0900 UTC on 24 March. An isolated G4 period was observed at 0404 UTC on 24 Mar.

A New AviationWeather.gov!
On October 16, the Aviation Weather Center’s experimental website, Beta.AviationWeather.gov, transitioned to the new AviationWeather.gov.
Why did we change AviationWeather.gov?
To meet the needs of our users. Most people are accessing the website with mobile devices, and they’re not getting a world-class experience because the current site wasn’t built with that in mind. That’s why we redesigned the site using a mobile-first approach to make sure that it will look good and behave consistently whether it’s being shown on a mobile phone, tablet, desktop computer, or large screen display. We’ve streamlined the menus to make navigation much more intuitive while preserving individual user configuration. This change also improves supportability behind the scenes through modernized code and by combining tools that were previously separate.
What are the biggest changes that will impact users of AviationWeather.gov?
Here are the top 6 biggest changes:
How do you know that these changes are beneficial?
The new site design incorporates years of customer feedback from the aviation community about AviationWeather.gov, including feature requests and general comments about the user experience. We also formally evaluated early versions of the new site in the Aviation Weather Testbed. During these evaluations, social scientists from the FAA’s Aviation Weather Demonstration and Evaluation (AWDE) Services group collected valuable feedback from a variety of users, and that feedback helped refine the website during its experimental period. Additional user feedback from over 500 members of the aviation community has been collected since Beta.AviationWeather.gov’s initial release in March of 2022, and the response has been overwhelmingly positive.
Are there any materials available to help with the transition?
Yes. The Aviation Weather Center has a library of quick snippet YouTube tutorials available. The website itself also has extensive help pages which can be viewed by clicking the “?” in the upper right corner. Information will continue to be communicated via Twitter and Facebook accounts as well. Be sure to follow us and share our content to keep the pilots and aviation community members in your area up to date on the latest changes.
Social Media Links
YouTube Library
https://www.youtube.com/@nwsawc207/videos
Environmental Modeling Center (EMC) Hosted the 9th NOAA Ensemble Users Workshop
EMC organized and hosted the 9th Ensemble Users Workshop during 22-24 August held virtually and at the NCWCP Conference Center. This workshop helps support the NWS transition from deterministic to ensemble-based probabilistic forecasting and to convey forecast uncertainty to users in the most useful manner. There were 80 presentations in total, including international speakers from the European Centre for Medium-Range Weather Forecasts, India’s National Centre for Medium Range Weather Forecasting, China Meteorological Administration, and Meteorological Service of Canada. The workshop included a review of various operational ensemble forecast systems, with an emphasis on the users and applications, ranging from high-resolution prediction of regional weather at a few days’ lead time to large-scale phenomena at subseasonal to seasonal time scales. There were group discussions on the development of the ensemble systems and products that utilize the NOAA Unified Forecast System (UFS) fully coupled to ocean, ice, waves and aerosols. The group participants also discussed requirements and community inputs for future UFS development. The workshop organizing committee also included members from the Office of Science and Technology Integration (OSTI) of NWS; Oceanic and Atmospheric Research (OAR) Weather Program Office (WPO), Physical System Laboratory (PSL) and Global System Laboratory (GSL); and National Center of Atmospheric Research (NCAR) Research Application Laboratory (RAL) and Developmental Testbed Center (DTC).
Evaluating Aviation Workflows in Hazard Services: A Collaborative Effort Between the Aviation Weather Testbed and the Arctic Testbed and Proving Ground
In collaboration with the Aviation Weather Center’s (AWC) Aviation Weather Testbed (AWT), the Arctic Testbed and Proving Ground hosted a 5-day Forecaster Acceptance Test (FAT) for aviation hazard product generation in Hazard Services. This evaluation was a follow on to testing done last May in the AWT as part of the 2023 AWT Spring Experiment. Testing the updated code as well as new functionalities implemented after the AWT May experiment were the primary goals of this FAT.
AWT leads Austin Cross and Stephanie Avey, and AWC-CIRA scientists Amanda Terborg and Jared Schadler made the trek to snowy Anchorage in November (13th-16th) to assist with the FAT. In addition to AWC, representatives from the Honolulu Forecast Office and NOAA’s Global Systems Lab (GSL) were in attendance. While the primary focus of the testing was suitability and readiness for Alaska Aviation Weather Unit (AAWU) operations, the presence of all three Met Watch Offices along with Hazard Services developers allowed for fruitful discussions about the future of aviation hazard product production utilizing Hazard Services (HS).

AWC, GSL, and AAWU staff discuss potential workflows for Graphical AIRMET production in Hazard Services. LtoR Darrel Kingfield (GSL), Jared Schadler (AWC/CIRA), Austin Cross (AWC), Stephanie Avey (AWC), Amanda Terborg (AWC/CIRA), and Nathan Eckstein (AAWU).
Testing of the HS software took place using both the Alaska Region Headquarters AWIPS (VRH) and the GSL AWIPS in the Cloud. Participants testing the software had a mix of experience using HS, and therefore provided a diverse perspective of feedback. Overall, forecasters were generally positive about HS and its potential, stating it is already proving better than the current production platform used by AAWU (IC4D). One of the key elements of in-person, dedicated software testing, is the ability of participants to directly interact and brainstorm with the developers. This allows for almost immediate feedback, and even bug fixes on the spot, which happened throughout the week. At the conclusion of the week, all those involved left with an optimistic outlook for the future of aviation hazard product production.

GSL Senior Scientist Darrel Kingfield works on updating Hazard Services software (front) while AWC staff (Amanda Terborg and Jared Schadler) discuss testing with AAWU Meteorologist in Charge Albert Pietrycha (back).
Environmental Modeling Center (EMC) Implements the NAEFS v7.0.2 Upgrade
NCEP implemented the North American Ensemble Forecast System (NAEFS) version 7.0.2 on Tuesday, December 5, 2023 at 1200 GMT. This upgrade increased the NAEFS members to 52 by adding 10 additional Global Ensemble Forecast System (GEFS) members to the 21 current members in NAEFS, so that all 31 GEFS members are now included. NAEFS was also recalibrated to account for the additional GEFS members. The inclusion of all 31 GEFS members improves the overall accuracy of the forecast system, and for precipitation in particular. The new NAEFS also upgrades the Fleet Numerical Meteorology and Oceanography Center (FNMOC) global model products to 0.5 degree data.
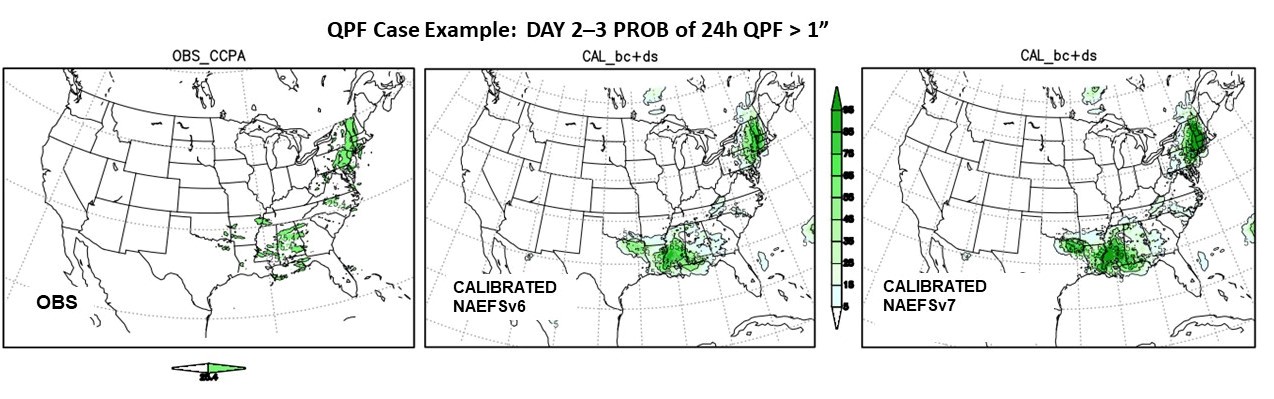
One of the particular improvements in the NAEFS V7 over NAEFS V6 was in Day 2-3 bias-corrected 24-hour precipitation forecasts. This figure shows the Day 2-3 probability of 24h QPF > 1” for the July 2023 Vermont flooding. The NAEFS V7 forecast more accurately depicted a higher probability of > 1” rainfall in New England than NAEFS V6.
Probabilistic Winter Storm Severity Index Now Operational
The Probabilistic Winter Storm Severity Index (WSSI-P) became operational on December 18 across the contiguous United States. The WSSI-P output conveys a range of possibilities of winter weather impacts, enabling enhanced preparedness and decision-making. WPC Director David Novak notes, “This is among the first NWS probabilistic impact prediction products – powering the NWS towards our probabilistic IDSS vision.”
The WSSI-P is created by using the Probabilistic Winter Precipitation Forecast (PWPF) gridded information from the Weather Prediction Center for winter weather elements and combining it with non-meteorological or static information datasets (e.g., climatology, land-use, urban areas). The output is a graphical depiction of the likelihood of potential societal impacts due to expected winter hazards using the following categories: “Minor,” “Moderate,” “Major,” and “Extreme.” It can be used in conjunction with the deterministic WSSI to get expected, low-end, and high-end scenarios.

Probabilities of exceeding specific impact thresholds are shown using the WSSI-P.
The WSSI-P webpage depicts local and national views of the WSSI-P. The webpage is updated at approximately 0200 UTC, 0500 UTC, 1400 UTC, and 1700 UTC. The publicly-shared output is also available in GIS format (KMZ, SHP, REST Service).
For more detailed information, please view:

An infographic describing the WSSI-P.

