Severe thunderstorms are forecast through this weekend along a slow moving cold front and secondary storm system that will impact areas from the southern Plains to the Great Lakes. Large hail and isolated damaging wind gusts are the main threats with these storms along with a risk for heavy to excessive rainfall which could bring flooding. Read More >
Overview - Historic Heat Wave
|
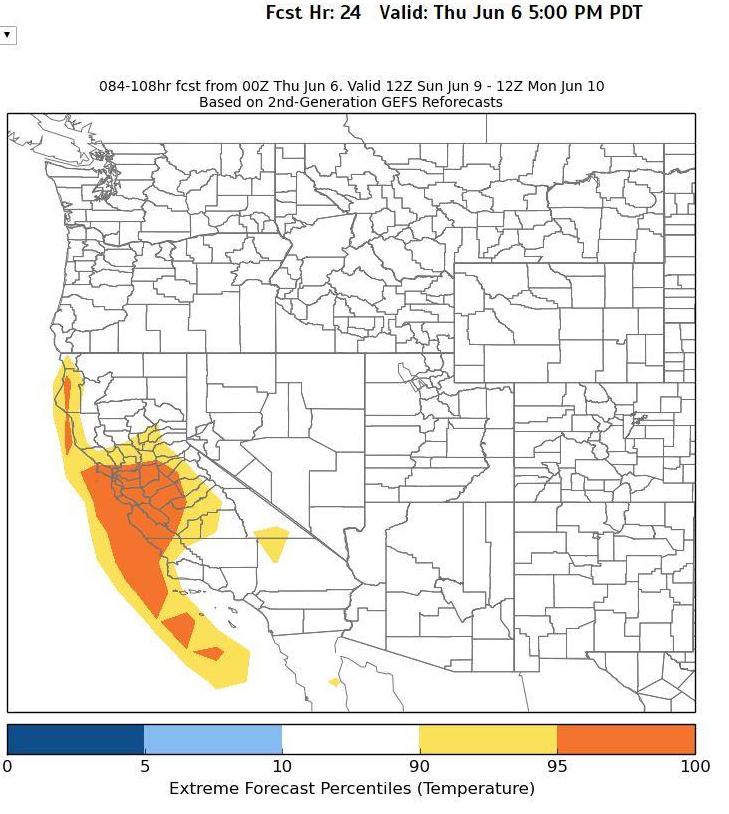
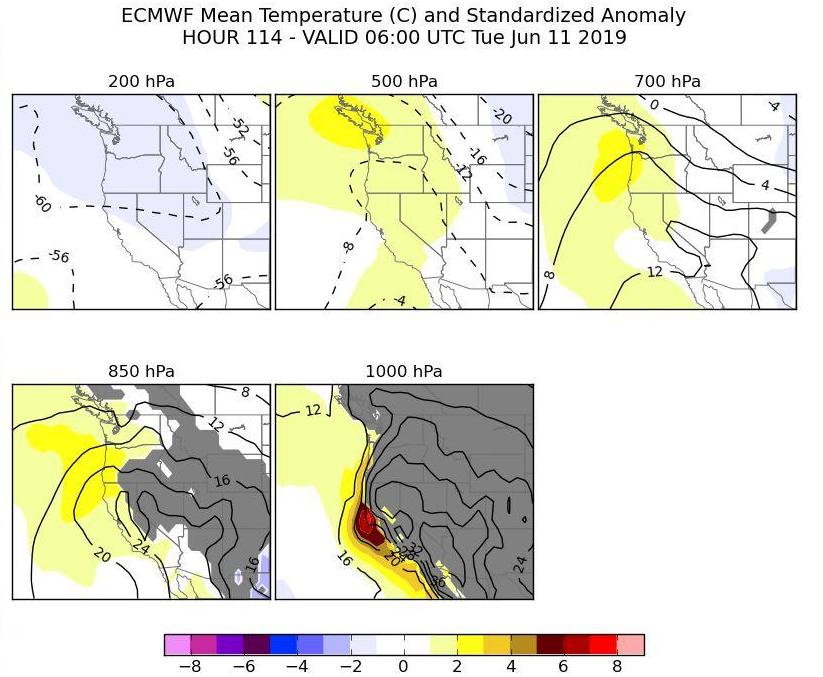
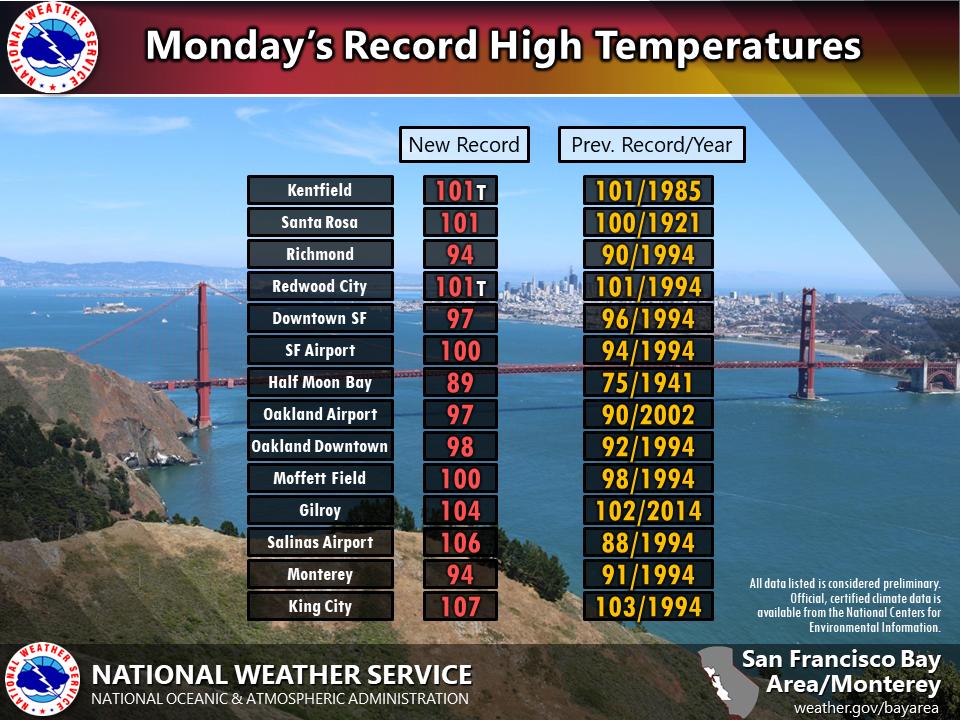
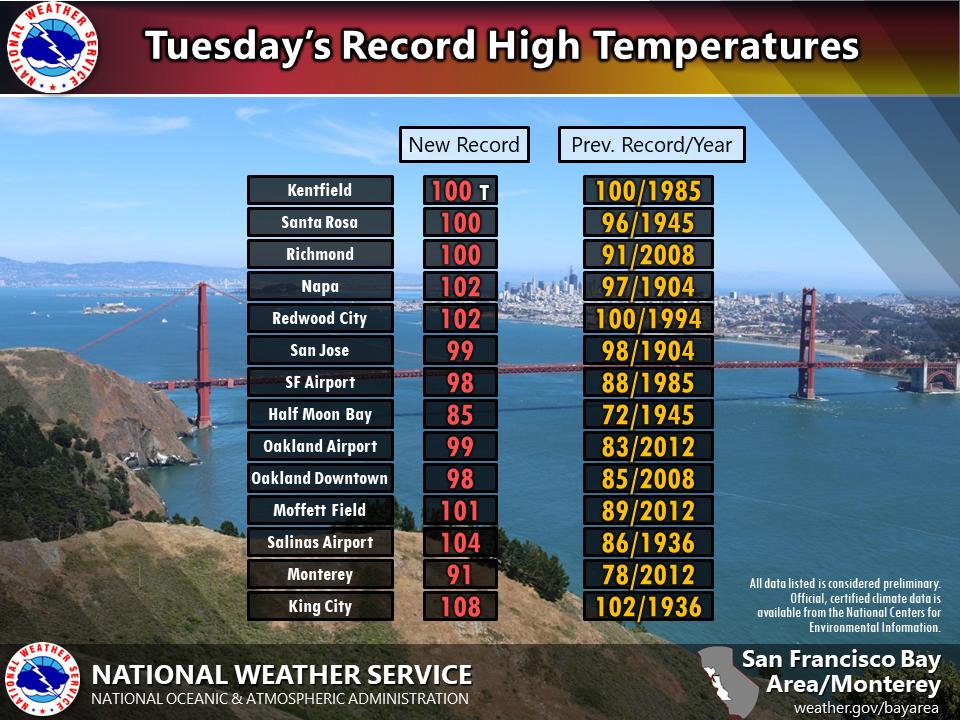
June 9-11, 2019 will be remembered as one of the hottest heat waves for the Bay Area, especially the coast, during meteorological summer (June-August). Numerous records fell for daytime maximum temperatures and maximum overnight low temperatures. Salinas Airport * even set a new record for the entire month of June. Some of the ingredients meteorologists use to diagnose a heat wave for the Bay Area were missing during this event with the exception of one key ingredient, prolonged period of offshore flow (northeast winds). Let’s take a closer look as what made this heat wave extraordinary and why. Historically, most heat waves or hotter than normal temperatures typically occur during the Fall (September and October) thanks to: strong high pressure, a very warm airmass aloft, warmer sea surface temperatures, and climatologically favored offshore flow. There have been other notable heat waves during the summer, like in June 2000 and July 2006. Leading up to the heat wave numerical weather models did suggest warmer than normal temperatures, with a few even suggesting the hottest temperatures so far this year. None of the main numerical weather models adequately captured the extreme nature of the heat near the coast. Taking a closer look at the ensemble numerical weather models (see below), which present a wide range of possibilities, did reveal there was a possibility of extreme heat, but confidence on this verifying was low to moderate. As the event unfolded there was nothing exceptional with regards to 500 mb heights, which were roughly 588-590 DAM or a in the top 90th percentile. Observed 850 mb temperatures were roughly 22° C, which was also in the 90th percentile. If it wasn’t the strength of the high pressure or warmth of the airmass what was it? Two words - offshore flow. Offshore began to kick in Friday, June 7, 2019 and peaked over the weekend with gusty winds in the hills up to 60 mph. The gusty northeast winds helped to completely mix out the marine layer, which is the natural cooling for the coast during the summer. Locally, the wind aligned perfectly with nearby terrain to enhance downslope flow and further warm temperatures. Monterey Airport, Salinas Airport and Half Moon Bay Airport all experienced the local enhancement. Additionally, the forecast called for a “southerly surge”, or a return of onshore flow to develop Monday into Tuesday. The southerly surge was a no show and some hint of offshore flow continued prolonging the heat wave.
*Salinas Airport reporting station likely had some instrumentation errors. Max temp for June 10 has been changed to 105°F.
Composed by: MMehle |
Kids swimming at Ridgeway Swim Center |
Heat Advisory & Warning The onset of the offshore flow event quickly became a fire weather concern resulting in the first issuance of a Red Flag Warning for the season. As the threat for heat related illnesses increased Heat Advisories and Excessive Heat Warnings were issued from June 9 through June 11.
Notable Record Factoids
Factoids gathered by S Rowe
|