
Severe thunderstorms and flash flooding risks increase across the center of the nation today. Meanwhile, ongoing thunderstorms and flash flooding will linger along the Gulf Coast states through the evening. The Great Basin and Intermountain West, warm temperatures and dry fuels with dry lightning may enhance fire weather potential. In addition, across interior Alaska, Red Flag Warning are posted. Read More >
NOTE: These are the top 10 snowfalls since 1940 at each climate site. These are the largest snowfalls for which a sufficient amount of archived synoptic weather data was available to perform a thorough analysis. There were a few larger snowfalls before the early 1900's, but they are not included in the analyses due to very limited synoptic weather data availability. For complete top 10 lists since records began at each climate site separate from the ones analyzed here, see the bottom of the page.
In the analyses, snowfall data was searched for 48 hour periods.
**Click on an event from the list below as a shortcut to skip right to the summary for that event**
Knoxville
Tri-Cities
Chattanooga
**Click the tabs below each event date for details and images**
An area of strong low pressure developed in the northern Gulf of Mexico and moved northeastward through the Southeast United States. This system interacted with a cold airmass in place spreading heavy snow across the southern Appalachian region. The snow began late on February 12 and gradually ended during the morning hours of February 14. Snowfall totals ranged from 8 to 13 inches across the plateau and northern and central valley with generally 8 to 10 inches in northeast Tennessee and southwest Virginia. Slightly higher amounts of 10 to 15 inches fell across the East Tennessee mountains and southwest North Carolina, while lighter amounts of 5 to 10 inches were common across the southern valley.
**Click each image to open it in a new window**

At 00Z 12 February, a deep mid/upper level trough centered near the High Plains placed the Tennessee Valley in deep southwesterly flow. A surface high in the northern Plains supplied arctic air southward, as seen by 850 mb temps of 0 to -5 C across the southern Appalachians. At the same time, a mid level short wave can be seen helping to “dig” the southern stream portion of the trough over Mexico with a 130+ knot jet streak ahead of this feature. This looks to be a favorable pattern for cyclogenesis in the Gulf.

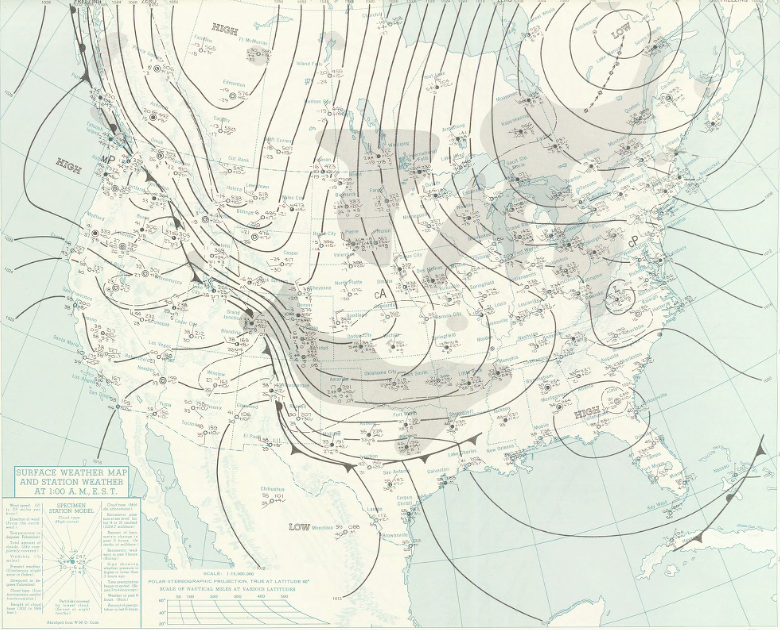
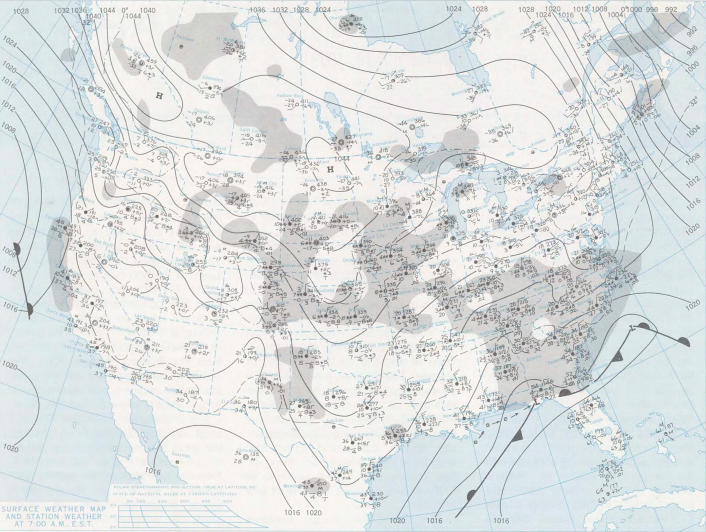
The surface map at 12Z 12 February showed a stationary front in the Gulf that a surface low would develop and track along in response to the mid/upper level short-wave moving out of Mexico.
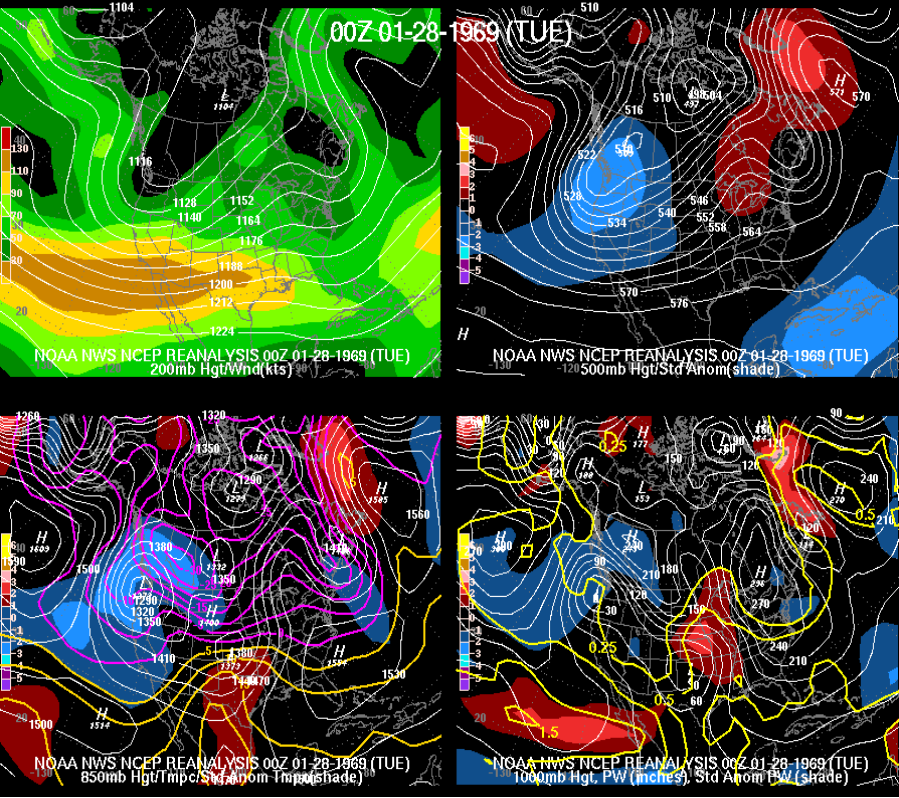
Indeed, by 00Z 13 February, the aforementioned shortwave was now entering the Gulf with a diffluent 130+ knot jet over the southern Appalachians encouraging strong upward vertical motion. The surface high now shifted to the upper Midwest keeping the feed of 0 to -5 C 850 mb temps into the region, and a rapidly developing surface low can be seen in the northern Gulf riding northeastward along a frontal boundary into the Southeast U.S. Ahead of this low, above normal precipitable water values are advecting northward to help support heavy precipitation in the southern U.S. Much of the snow in this phase of the storm was likely caused by isentropic lift.
At 12Z 13 February, the surface low was still in the northern Gulf with the old frontal boundary lifting northward as a warm front ahead of its track. Widespread precipitation continued north of this front due to continuous isentropic lift as the surface high to the north continued to supply cold air.

For the final phase of the storm at 00Z 14 February, the strong surface low was exiting the coast of the Carolinas with the northern and southern stream troughs now more phased together and shifting eastward. Strong cold air advection behind the storm system was cooling 850 mb temps to -5 to -10 C across the southern Appalachians. Wrap around moisture produced a deformation zone or TROWAL of moderate to heavy snow across the southern Appalachians before finally exiting the next morning.

By 12Z 14 February, the strong surface low was centered over the Mid Atlantic coast moving northeastward with the TROWAL-induced snowfall ending across the southern Appalachians region through the morning.
**Click the image to open it in a new window**

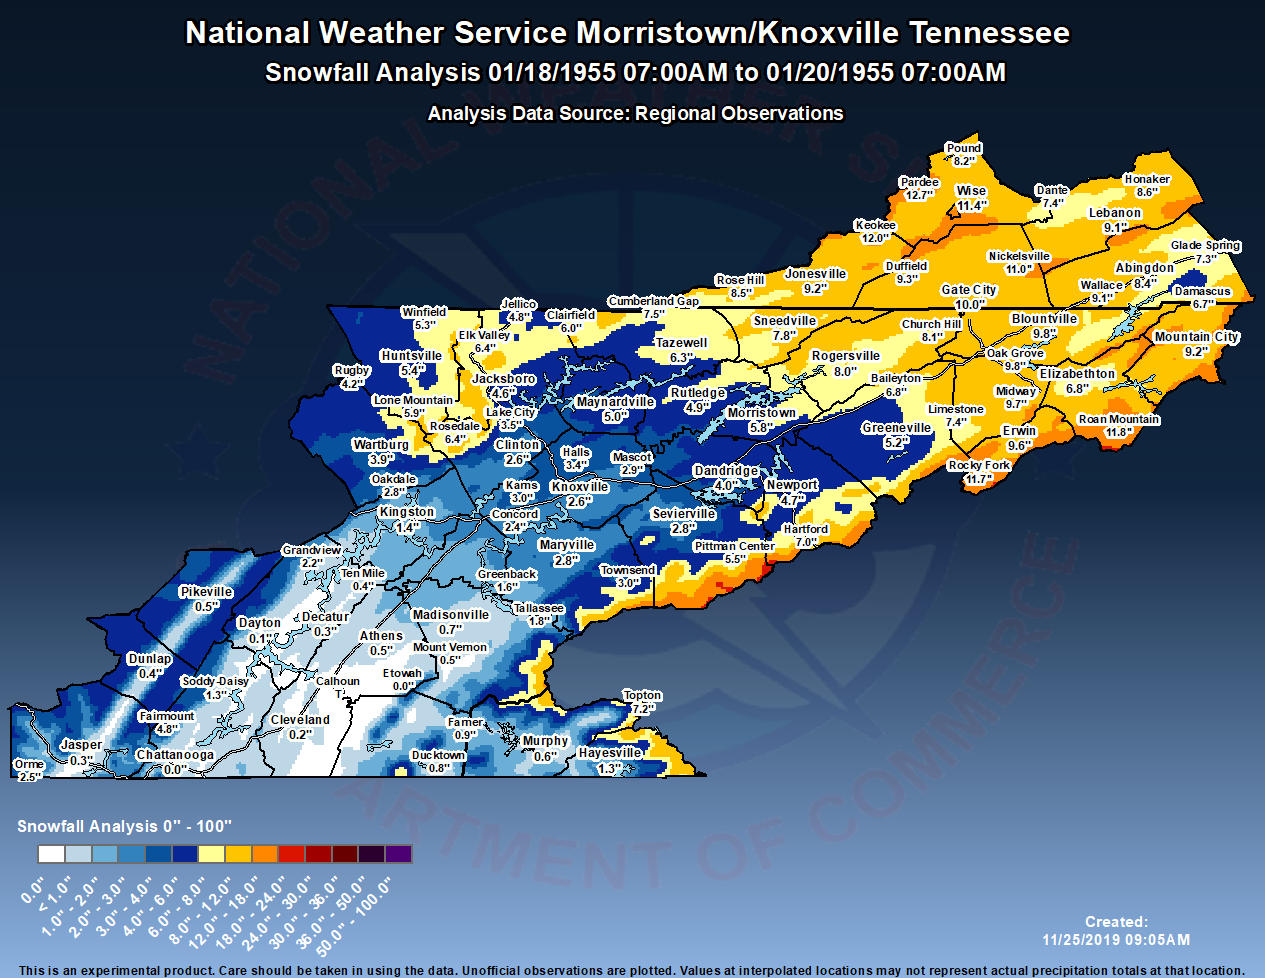
Unofficial observations are plotted from airport observers and COOP observers, and values are interpolated across the map with terrain enhancement. Values at interpolated locations may not represent actual precipitation totals at that location, so care should be taken in using the data.
NOTE: The snowfall map is very coarse due to a lack of reports from this event.
A strong cold front crossed the southern Appalachian region on 20 November allowing much colder air to filter into the region. A low pressure system developed along this front bringing a widespread area of rain showers changing to snow showers during the day on the 20th. This area of low pressure was nearly stationary over the Carolinas for two days causing persistent bands of moderate to heavy snowfall to rotate through the southern Appalachians. The system finally lifted northward on 22 November with the snow coming to an end. A widespread 8 to 15 inches of snow fell from the northern and central valley through northeast Tennessee and southwest Virginia as well as across the higher elevations of southwest North Carolina. Amounts of 10 to 16 inches were common across the East Tennessee mountains. Amounts across the northern plateau ranged from 3 to 6 inches, while lighter totals of a trace to 2 inches generally fell across the southern plateau, southern valley, and lower elevations of southwest North Carolina.
**Click each image to open it in a new window**

At 00Z 20 November, a very deep mid/upper level trough was centered over the Mississippi Valley with its base extending into the Gulf. A blocking ridge near Greenland slowed the eastward progression of the trough. This placed the southern Appalachians in a diffluent southwesterly flow. Temperatures at 850 mb were still too warm for snow above 5 C, but a sharp cold front can be seen stretching from western Pennsylvania through East Tennessee with a surface wave of low pressure tracking northward through the Appalachians along this front.

By 12Z 20 November, the surface cold front had crossed the entire southern Appalachians region with the surface wave of low pressure still in the vicinity of the western Carolinas.
By 00Z 21 November, the mid/upper trough had moved very little, but had further deepened and become negatively tilted as the blocking ridge further strengthened over Greenland. In fact, the trough was now developing a closed circulation over the Tennessee Valley. Cold air had now advected into the southern Appalachians with 850 mb temperatures of 0 to -5 C as the cold front moved farther east, and the surface low can be seen strengthening along this front over South Carolina helping to close off the mid-level trough. This would all result in a nearly stationary storm system that would spin over the southern Appalachian region with a persistent feed of Gulf and Atlantic moisture bringing a prolonged period of wet snow and snow showers.

This nearly stationary surface storm can still be seen over western South Carolina at 12Z 21 November with a surface trough extending back into the southern Appalachian region helping to focus the snowfall.

By 00Z 22 November, the system had become stacked under the blocking ridge to the north with a closed low in the vicinity of Virginia and North Carolina seen from 200 mb down through 1000 mb. Temperatures at 850 mb were still below 0 C to support wet snow as above normal precipitable water values can be seen feeding in from the Atlantic, then wrapping around the low into northeast Tennessee and southwest Virginia. This would finally end the next day as the cut off storm slowly moved northward out of the region.
At 12Z 22 November, the system was slowly pulling away with its surface trough still trailing over the region focusing a few leftover snow showers.
**Click the image to open it in a new window**
.png)
Unofficial observations are plotted from airport observers and COOP observers, and values are interpolated across the map with terrain enhancement. Values at interpolated locations may not represent actual precipitation totals at that location, so care should be taken in using the data.
An intense low pressure system, the 1993 Storm of the Century, developed in the Gulf of Mexico and moved northeastward through the Southeast United States, then up the East coast. Heavy snowfall and very strong winds gusting over 40 mph created blizzard conditions across the southern Appalachian region west of the storm's path. The snow began late on 12 March and ended during the early morning hours of 14 March. Snowfall totals were generally 15 to 24 inches across the Plateau and 15 to 30 inches in southwest Virginia and southwest North Carolina. In the Tennessee Valley and northeast Tennessee, 12 to 18 inches were common with the Chattanooga area seeing close to 20 inches. The mountains of East Tennessee won out with widespread 24 to 36 inch amounts, and an astonishing 40 to 60 inches fell in the highest peaks of Sevier County!
**Click each image to open it in a new window**
At 00Z 12 March, a broad mid/upper level trough covered most of the northern U.S. with a highly amplified ridge along the west coast. A southern stream mid/upper level trough was digging deep into Mexico. A surface high over the northern Rockies combined with the broad troughing to supply a large pool of arctic air across the U.S. with 0 to -5 C 850 mb temperatures already in place across the Tennessee Valley and southern Appalachians.
By 12Z 12 March, a surface low can be seen developing in the western Gulf along a stationary front in response to the mid/upper southern stream shortwave moving out of Mexico.

At 00Z 13 March, the strong mid-level shortwave had moved through the southern stream trough and emerged into the Gulf. Both the northern and southern stream longwave troughs had significantly deepened and were now phasing together. This resulted in the surface low explosively developing in the northern Gulf as it tracked northeastward up the frontal boundary into the Southeast U.S. on the leading edge of the cold air. The surface high further dove into the Rockies keeping the feed of a large area of cold air ahead of the storm. The right entrance region of a 130+ knot jet streak over the southern Appalachians combined with isentropic lift were already supporting widespread precipitation breaking out.

At 12Z 13 March, the surface low was bombing out over southern Georgia tracking northeastward with a TROWAL of heavy snow over the southern Appalachians west of its track. A very tight surface pressure gradient supported very strong north to northeast winds leading to blizzard conditions across the region. In response to the intense low moving northeastward and strong cold air advection on its backside, the old stationary front had transitioned to a strong cold front that swept eastward across the Florida peninsula spawning a line of severe thunderstorms.
By 00Z 14 March, that surface low had completely bombed out into the ’93 Storm of the Century centered over the Mid Atlantic. The associated very intense mid-level shortwave was rounding the base of the deep trough over Georgia and South Carolina with intense cold air advection behind the exiting surface storm dropping 850 mb temps to -10 to -15 C across the Tennessee Valley and southern Appalachians. Much above normal precipitable water values can be seen wrapping around the low into the comma head/TROWAL across our region, prolonging the already heavy snowfall accumulations. This TROWAL had been in place for hours before this time stamp with bands of heavy snowfall pivoting across the region. The record snows would finally end over the next couple of hours.

By 12Z 14 March, the intense surface storm was located near the New England coast with cold surface high pressure settling into the Tennessee Valley and southern Appalachians.
**Click the image to open it in a new window**
.png)
Unofficial observations are plotted from airport observers and COOP observers, and values are interpolated across the map with terrain enhancement. Values at interpolated locations may not represent actual precipitation totals at that location, so care should be taken in using the data.
Low pressure moved along the Gulf coast then turned northeastward up the East coast of the United States while strengthening. This system interacted with an arctic airmass in place to the north to produce heavy snowfall across the southern Appalachian region. Snow spread into the region during the morning on 02 March, then gradually ended during the morning hours of 03 March. Snowfall totals ranged from 8 to 15 inches across much of the central and northern valley through northeast Tennessee and southwest North Carolina with fairly widespread 12 to 24 inch amounts in southwest Virginia and the East Tennessee mountains. Over 30 inches fell in the highest mountain peaks of Sevier County. Snowfall farther southwest was much lighter with 3 to 9 inch amounts on the Plateau and generally 2 to 7 inches in the southern valley.
**Click each image to open it in a new window**

At 12Z 01 March, cold surface high pressure over the Midwest and surface low pressure near northern Maine led to a northerly flow of arctic air across the Tennessee and Ohio Valleys. At the same time, a surface low was developing in West Texas.

By 12Z 02 March, that surface low was strengthening near the southeast Louisiana coast with isentropic lift causing snow to break out well to its north across the Tennessee Valley. The surface high had shifted to Pennsylvania, but it continued to feed a northeasterly flow of cold air into the southern Appalachians.

Late in the day 02 March and through the night into the morning of 03 March, the surface low rapidly deepened and moved northeastward through the Southeast U.S. placing the southern Appalachians in a TROWAL or deformation zone west of its track. This produced bands of heavy snow that pivoted through the region. By 12Z 03 March, the low was centered over the Mid Atlantic with the TROWAL gradually pulling away, so the snowfall ended during the morning. No upper air maps were available for this event due to its distant place in time.
**Click the image to open it in a new window**
.png)
Unofficial observations are plotted from airport observers and COOP observers, and values are interpolated across the map with terrain enhancement. Values at interpolated locations may not represent actual precipitation totals at that location, so care should be taken in using the data.
A weak surface low developed in northern Mexico and tracked eastward along an arctic frontal boundary through southern Texas and the southern and southeastern U.S. This system interacted with a broad area of arctic air to the north to produce a swath of moderate snowfall across the Tennessee Valley and southern Appalachians north of its track. Snow began during the day 09 January and ended during the morning on 10 January. Snowfall totals ranged from 7 to 12 inches across much of the central valley to 6 to 8 inches across the northern plateau and northern valley. Lighter amounts of generally 4 to 8 inches fell in northeast Tennessee and southwest Virginia with 3 to 7 inches across the southern plateau, southern valley, and southwest North Carolina.
**Click each image to open it in a new window**

At 00Z 09 January, a strong mid/upper ridge over the eastern Pacific and another strong ridge over the western Atlantic resulted in a highly amplified and broad longwave trough over much of the U.S. This worked with surface high pressure in the northern Rockies to funnel a massive area of arctic air into the U.S. which made it all of the way down to the Texas Gulf coast. Over the Tennessee Valley and southern Appalachians, 850mb temperatures were already -5 to -10 C. A weak shortwave was organizing at the base of the anomalous trough in Mexico with a weak surface low developing in response across northern Mexico.
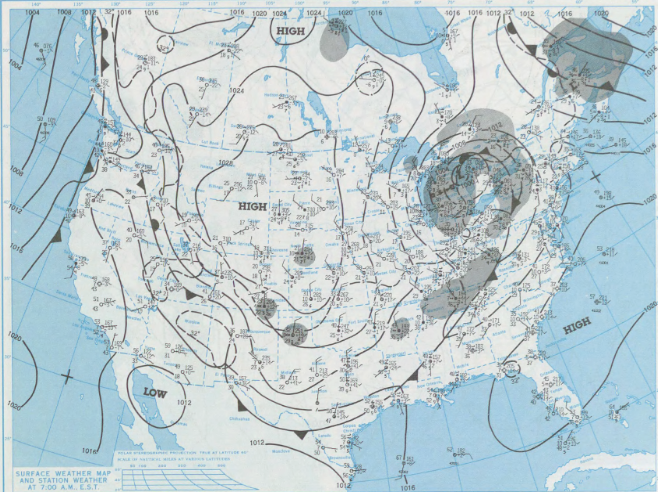
At 12Z 09 January, a surface cold front can be seen near the Texas and Louisiana Gulf coasts with the weak surface low in northern Mexico. This low would track along that arctic frontal boundary.

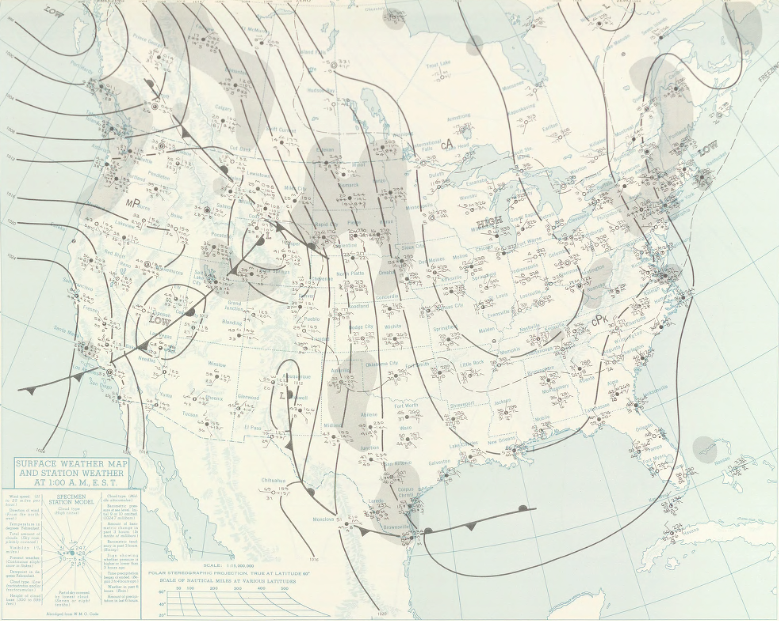
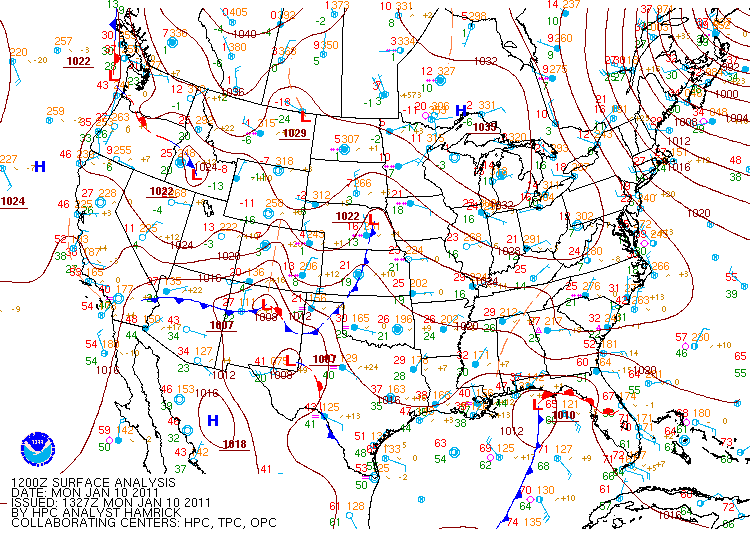
By 00Z 10 January, enhanced upper level flow had developed ahead of the aforementioned mid-level shortwave and weak surface low, with a 110+ knot jet over the Tennessee Valley and southern Appalachians. The surface pressure gradient can be seen tightening from the southern Appalachians to the Gulf coast, so upper level divergence from the jet combined with isentropic lift resulted in a strip of light to moderate snow across the region. At the same time, the surface high moved farther south into the Rockies helping to advect -10 to -20 C 850 mb temperatures into the Tennessee Valley. The weak low tracked along the baroclinic zone/arctic front through the Southeast U.S., and extremely cold temperatures followed in the wake of the snowfall across the southern Appalachian region.

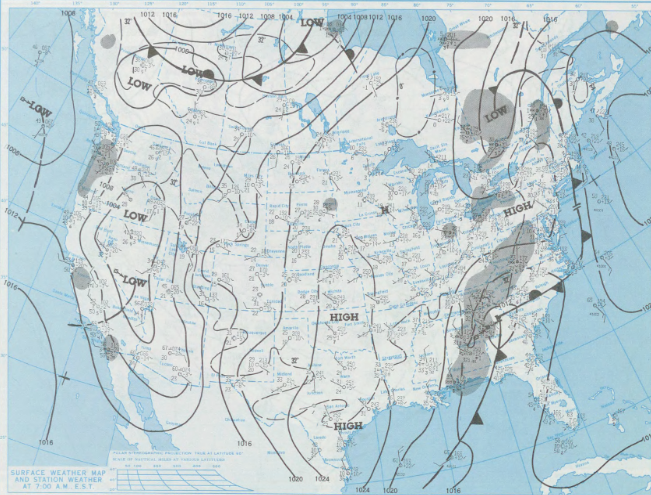
At 12Z 10 January, some light snow remained across the southern Appalachians due to lingering frontogenesis as the weak surface low pulled away. The arctic cold front had pushed well into the Gulf allowing the unusually cold air to pour into the region.
**Click the image to open it in a new window**
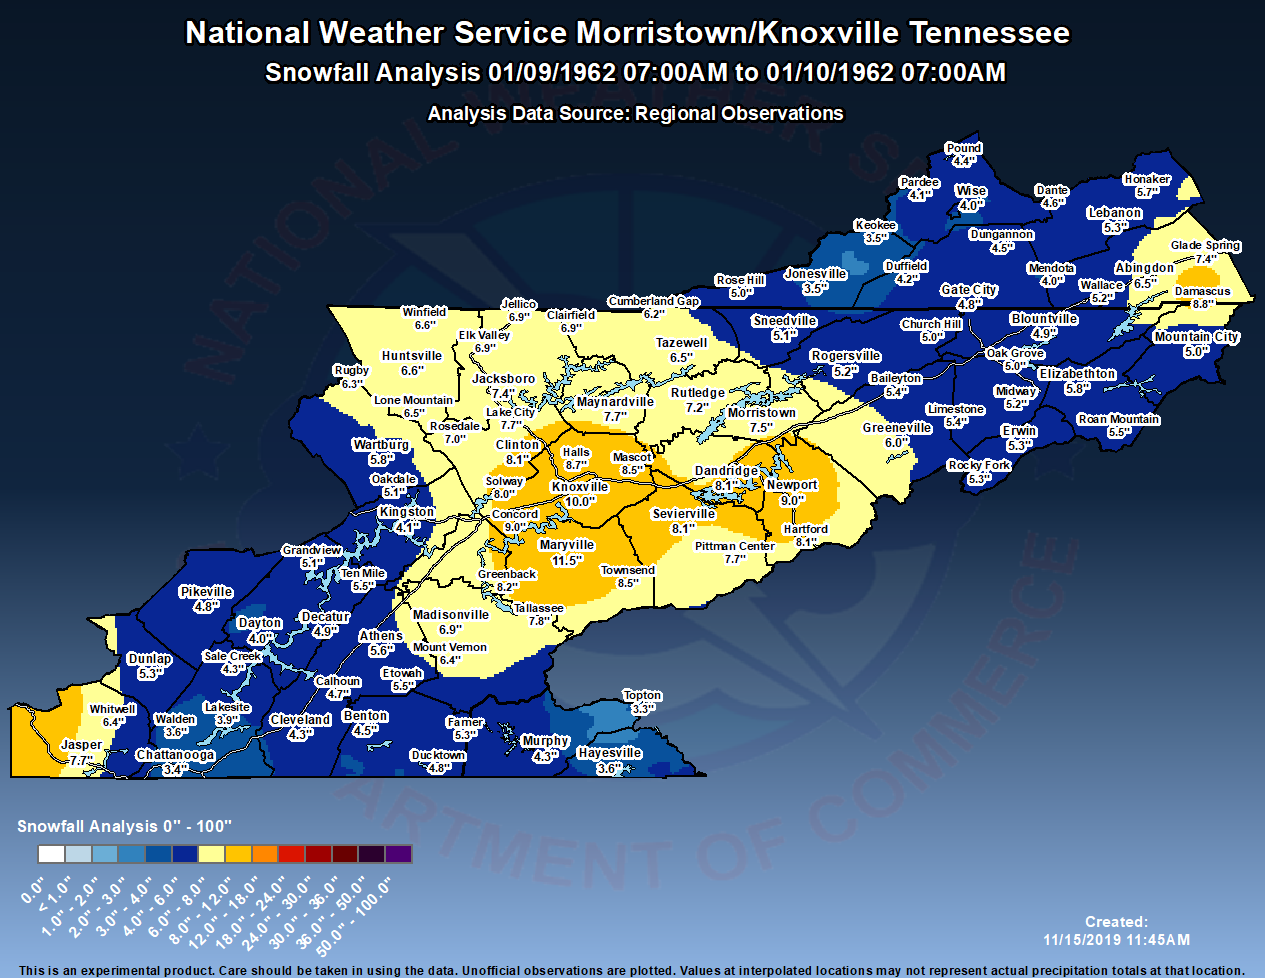
Unofficial observations are plotted from airport observers and COOP observers, and values are interpolated across the map with terrain enhancement. Values at interpolated locations may not represent actual precipitation totals at that location, so care should be taken in using the data.
NOTE: The snowfall map is very coarse due to a lack of reports from this event.
A strong cold front crossed the southern Appalachian region on the morning of 02 April abruptly ending a stretch of mild weather. A low pressure system developed on the tail end of this front that evening in central Texas which tracked northeastward through the Southeast United States and up the East coast bringing a heavy, late season snowstorm to the southern Appalachians. Snow spread into the region during the early morning hours of 03 April and ended during the morning of 04 April. Snowfall totals ranged from 10 to 15 inches across much of the northern plateau, northern and central valley, northeast Tennessee, and southwest North Carolina with 12 to 24 inches common across southwest Virginia. Across the East Tennessee mountains, 20 to 30 inches fell with totals over 36 inches across the highest peaks in southern sevier county. Lighter snowfall occurred farther southwest across the southern plateau and southern valley with generally 3 to 7 inch amounts.
**Click each image to open it in a new window**

At 00Z 02 April, an amplified pattern was in place ahead of the storm system with a deep mid/upper level trough progressing through the upper Midwest and Great Lakes between strong ridging over the western U.S. and north Atlantic. This set up a late season feed of arctic air into the eastern two thirds of the U.S. A strong cold front extended from a surface low in the Great Lakes to the southern Plains with a cold surface high in the northern Rockies. The southern Appalachians were in the warm sector at this point ahead of the front with a surface high near the Southeast coast helping to funnel warm southerly flow into the region. This would all soon change…
By 12Z 02 April, the surface cold front was crossing the southern Appalachian region as the surface low moved into the central Great Lakes.

By 00Z 03 April, the mid/upper trough was now centered in the Great Lakes and had significantly deepened with its base extending to the Gulf coast phasing with the southern branch of the jet. The strong cold front had finished crossing East Tennessee, southwest Virginia, and southwest North Carolina with cold air advection dropping 850 mb temperatures below 0 C in the region. At the same time, a short wave was moving through the base of the deep trough in central Texas with an associated surface low beginning to develop.
By 12Z 03 April, the surface low was strengthening in northwest Georgia while moving northeastward with an associated warm front and trailing cold front developing. Isentropic lift and frontogenetic forcing north of the warm front resulted in widespread snow across the southern Appalachians.

Throughout the day on 03 April, the mid/upper level trough became negatively tilted with the surface low and parent shortwave rapidly strengthening in response as they rounded the east side of the trough axis. This drew in 850 mb temperatures below -5 C with a deformation zone or TROWAL developing in the southern Appalachians to continue heavy snowfall on the west side of the surface low track. By 00Z 04 April, the surface low was centered near the North Carolina/South Carolina border with the snowfall slowly ending the next morning as the low pulled northeastward.

At 12Z 04 April, the TROWAL was exiting southwest Virginia allowing the snow to end, and the surface low was centered near the Virginia coast moving away from the region. However, a large surface high over the Midwest continued to advect unseasonably cold air into the southern Appalachians.
**Click the image to open it in a new window**

Unofficial observations are plotted from airport observers and COOP observers, and values are interpolated across the map with terrain enhancement. Values at interpolated locations may not represent actual precipitation totals at that location, so care should be taken in using the data.
This was a two part event, with the first wave of snow caused by cold northwesterly winds carrying residual moisture from the Great Lakes into the southern Appalachians. This cold and unstable air traveled upslope through the mountains of far East Tennessee and southwest Virginia producing swaths of snow accumulation from the early morning hours of 08 March through mid day. For the second part of the event, low pressure developed in the southern Plains then tracked through the southern Tennessee Valley before turning northeast toward the Mid Atlantic coast. This produced a swath of snow across the southern Appalachians starting during the early morning hours of 09 March and ending during the early morning of 10 March. Snowfall totals ranged from 10 to 18 inches across much of northeast Tennessee and southwest Virginia with 9 to 12 inches across the northern plateau and northern and central valley. Generally 4 to 9 inches fell across the southern plateau, southern valley, and southwest North Carolina.
**Click each image to open it in a new window**

This was a classic northwest flow upslope snow event for the southern Appalachians followed by a synoptic system. Before the system, at 00Z 08 March, broad mid/upper level ridging was in place across the Rockies and western High Plains with a deep trough across the eastern two thirds of the U.S. A cold surface high was dropping through the upper Midwest with 850 mb temperatures below -15 C across the upper Midwest and Great Lakes and below -10 C across the southern Appalachians. This pattern created lake-effect snow bands downwind of the Great Lakes, and this residual moisture, combined with the northwest flow upslope component in the Appalachians, led to significant snow in the TRI Cities area and nearby mountains. Daytime heating enhanced the coverage of snow squalls by creating instability below the cold pool aloft, as if typical with these events.
By 12Z 08 March, the cold surface high was moving into the western Great Lakes maintaining a northerly flow of arctic air into the southern Appalachians, but the northwest flow snowfall was slowly ending as subsidence was developing under the high. A lingering surface trough can still be seen across West Virginia and southwest Virginia, adding convergence to maintain snow showers.

By 00Z 09 March, the mid/upper level trough was lifting out with the northwest flow snow completely shutting off as the surface high shifted into the Ohio Valley. The flow had become more zonal, and a shortwave can be seen approaching the central Plains with an enhanced jet of 90-100 knots across the Tennessee Valley. Surface low pressure was developing over the southern Plains in response to the shortwave. Temperatures ahead of this system were still plenty cold for snow with 0 to -5 C at 850 mb over the southern Appalachians. Warm air advection and isentropic lift combined with the lift from the jet overhead caused a swath of precipitation to develop across the Tennessee Valley. This was a rapidly moving system that would track through the region.

At 12Z 09 March, the weak wave of low pressure was tracking along a cold or quasi-stationary front that stretched from the Tennessee Valley through Arkansas. The isentropic lift induced snow continued across much of the region, but had a sharp northern gradient since the surface high had settled over Virginia.

By 00Z 10 March, snow was still falling across the southern Appalachian region as the mid-level shortwave rotated through the lower Ohio Valley and the surface low crossed southeast Tennessee. A 90+ knot jet was still enhancing lift across the region at this time. The low rapidly moved off to the northeast that night with the snow abruptly ending across the southern Appalachian region.

By 12Z 10 March, the surface low was centered over southern West Virginia with its associated weak cold front extending through the Carolinas. Surface high pressure was starting to build into the Tennessee Valley in its wake.
**Click the image to open it in a new window**

Unofficial observations are plotted from airport observers and COOP observers, and values are interpolated across the map with terrain enhancement. Values at interpolated locations may not represent actual precipitation totals at that location, so care should be taken in using the data.
NOTE: The snowfall map is very coarse due to a lack of reports from this event.
Low pressure tracked from the Louisiana Gulf coast to southwest Virginia, followed by a second and stronger low that formed off the South Carolina coast as the original low weakened. This system interacted with arctic air that was in place to produce heavy snowfall across the southern Appalachian region. Snow began during the day on 06 January and ended during the day on 07 January. Snowfall totals ranged from 12 to 24 inches across much of northeast Tennessee, southwest Virginia, and the East Tennessee mountains with 6 to 10 inches in the northern valley. Amounts of 4 to 10 inches fell across southwest North Carolina with 4 to 8 inches on the northern plateau. Lighter amounts of 3 to 6 inches fell across the southern plateau and central valley with generally 1 to 3 inches in the southern valley.
**Click each image to open it in a new window**

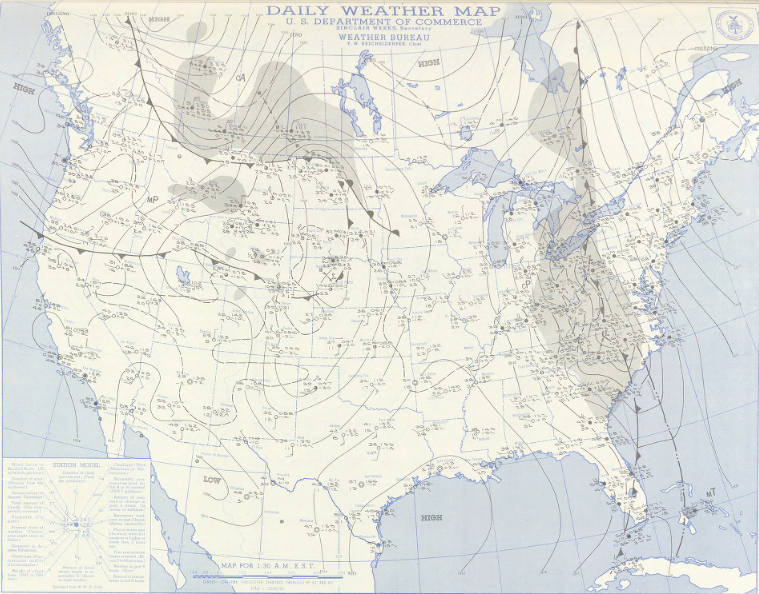
At 00Z 06 January, a large mid/upper level ridge near the west coast of the U.S. helped to amplify a broad trough over the central and eastern U.S. This was a cold mid winter pattern for much of the country, and a surface high in the northern Plains helped to draw 0 to -5 C 850 mb temperatures into the Tennessee Valley and southern Appalachians, and even colder air north of there.

By 12Z 06 January, a surface low was beginning to develop near the Louisiana Gulf coast with a stationary front and inverted trough extending into the southern Appalachians. The cold surface high was still situated over the northern Plains with another surface high in the eastern Great Lakes, and both were funneling a persistent feed of arctic air into the southern Appalachians and Tennessee Valley. Warm air advection and isentropic lift were allowing light snow to break out across the region well north of the low.

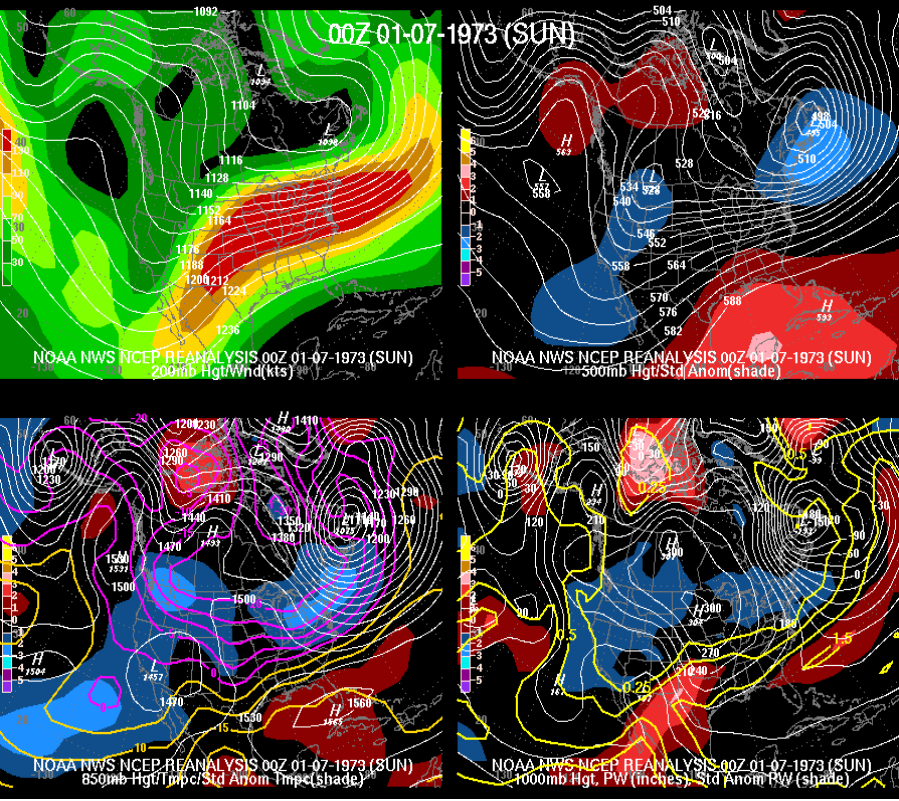
By 00Z 07 January shown above, a strong mid-level shortwave was rotating through the base of the now deepening trough axis over the Delta region. An upper level jet streak associated with this feature was placing the southern Appalachians in the entrance region of a diffluent 130+ knot jet maximum. The surface low associated with the shortwave was rapidly organizing near or just south of the Tennessee Valley with -5 to -10 C 850 mb air following in its wake. Widespread precipitation continued across the region during this day associated with isentropic lift ahead of the low and the strong jet dynamics overhead.

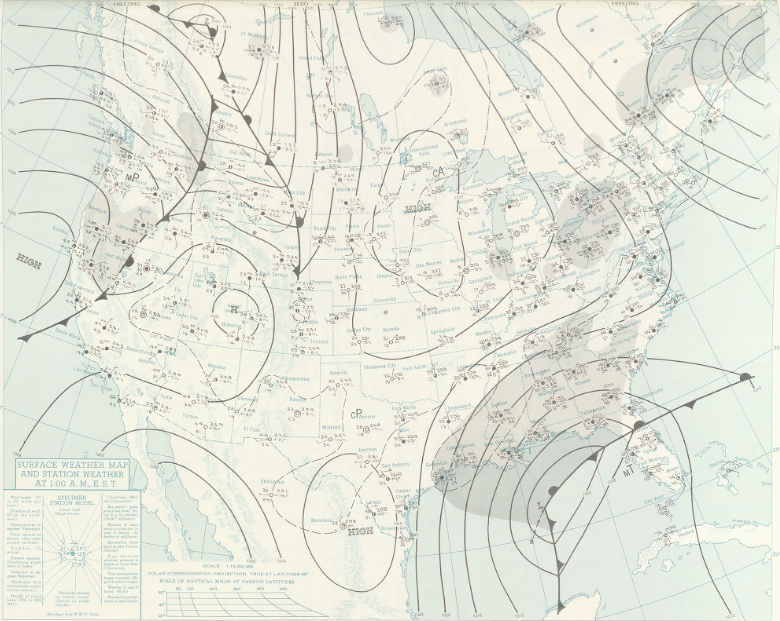
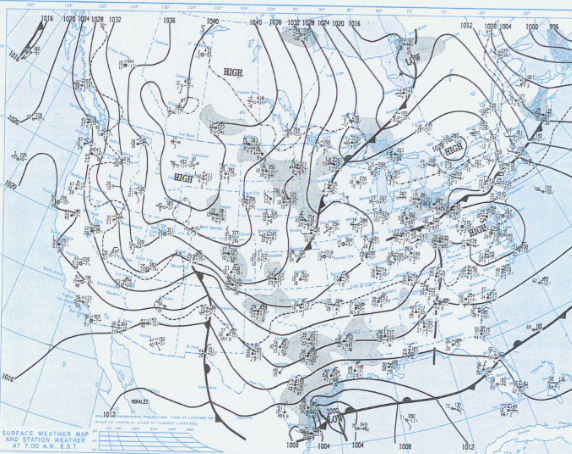
The above upper air maps and the below surface chart show that by 12Z 07 January, a new surface low was bombing out along the South Carolina coast as it turned northeastward up a frontal zone along the east side of the longwave trough axis, while the old inland surface low was slowly weakening in southwest Virginia. The precipitable water anomalies along the east coast indicate the deep moisture being pulled north and west around the circulations. This moisture helped to create bands of heavy snowfall west of the tracks of both surface lows in the southern Appalachians in the TROWAL/deformation zones. Snow ended during the day on 07 January, but a deep trough aloft and surface high in the middle of the U.S. funneled even colder air into the Tennessee Valley in the wake of the storm. This was a classic Miller B storm, and it went on to become the historic Blizzard of ’96 in the Mid Atlantic region later that day.

**Click the image to open it in a new window**
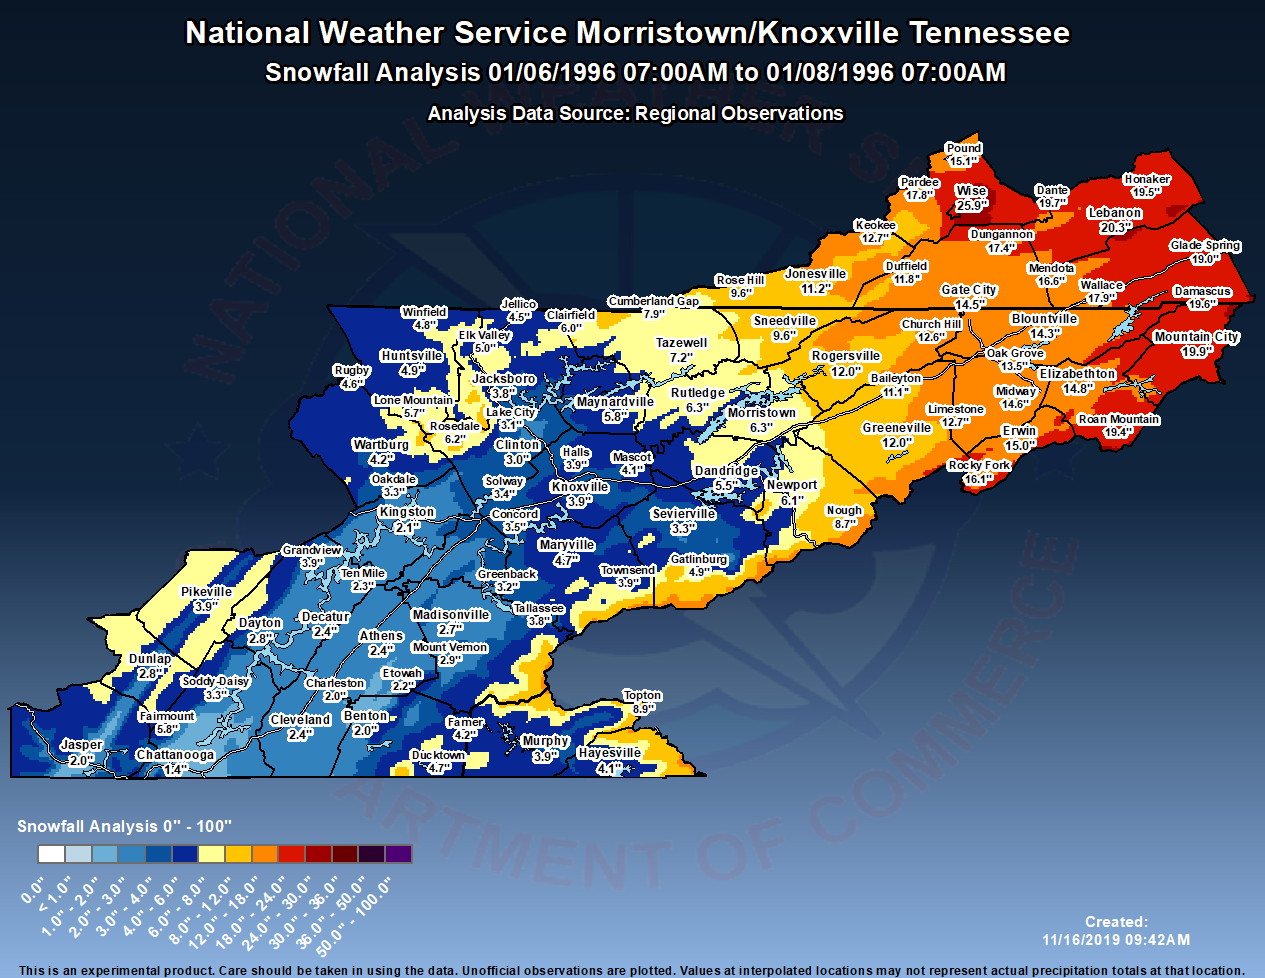
Unofficial observations are plotted from airport observers and COOP observers, and values are interpolated across the map with terrain enhancement. Values at interpolated locations may not represent actual precipitation totals at that location, so care should be taken in using the data.
A strong cold front slowly moved through the southern Appalachian region on 28 February allowing much colder air to flow into the region with rain changing to snow by evening. Throughout the night and the early morning hours of 01 March, low pressure developed along the front in North Carolina and slowly moved northward rotating bands of heavy snow across the southern Appalachians. The snow ended during the day on 01 March as the low continued northward. Snowfall totals ranged from 10 to 16 inches across much of northeast Tennessee and southwest Virginia with 12 to 24 inches across the East Tennessee mountains. Amounts of 8 to 15 inches fell across the higher elevations of southwest North Carolina. Generally 7 to 12 inches fell across the northern valley with 4 to 8 inches on the northern plateau. Lighter amounts of 1 to 4 inches fell in the central valley and the lower elevations of southwest North Carolina with a trace to 1 inch from the southern plateau through the southern valley.
**Click each image to open it in a new window**

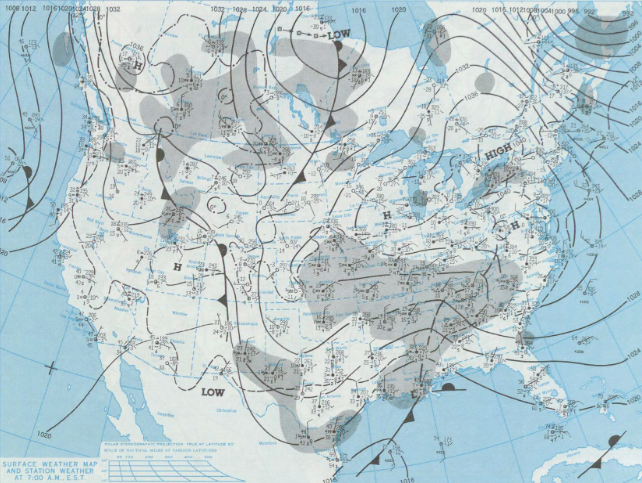
February of 1954 ended mild and wet across the southern Appalachians. At 00Z 28 February, the area was in deep southwesterly flow between a mid/upper ridge along the east coast of the U.S. and a deepening longwave trough over the middle of the U.S. Temperatures at 850 mb were above 10 C across much of the region, but a strong cold front stretched from the Great Lakes through the Delta region signaling that a big change was on the horizon. A wave of surface low pressure was tracking up this front with warm air advection and above normal precipitable water values bringing rain showers ahead of this low from Ohio through the Tennessee Valley.

By 12Z 28 February, the cold front was moving into East Tennessee as the wave of surface low pressure moved north. A trailing surface trough stretched from southern Indiana through northwest Tennessee. This surface trough marked the leading edge of the true cold air.
24 hours later at 00Z 01 March shown above, much colder air was filtering into the southern Appalachians as the aforementioned surface trough was crossing the region. Rain showers were changing to snow showers as the initial wave of low pressure had moved north into Ohio. Behind the front, 850 mb temperatures were falling to 0 to -5 C across the Tennessee Valley. In the mid and upper levels, the longwave trough was becoming negatively tilted with a blocking ridge strengthening between Greenland and the North Atlantic, so signs pointed toward a slow exit of this system and the possibility of a new surface low forming east of the Appalachians.
The upper air maps above and surface chart below show that throughout the night and into the morning hours of 01 March, a surface low rapidly developed in response to the negatively tilted trough and mid-level shortwave rotating up the east side of the trough axis. As the low moved north through the central Appalachians and North Carolina, a deformation zone or TROWAL produced heavy snowfall west of the track of the low in northeast Tennessee and southwest Virginia. The low was located in northwest North Carolina by 12Z 01 March, and much above normal precipitable water values can be seen rotating around the center into southwest Virginia and East Tennessee to support the heavy snowfall. The snow ended during the day as the system continued to move northward, but arctic air with 850 mb temperatures of -5 to -10 C followed in the wake of the storm.
**Click the image to open it in a new window**
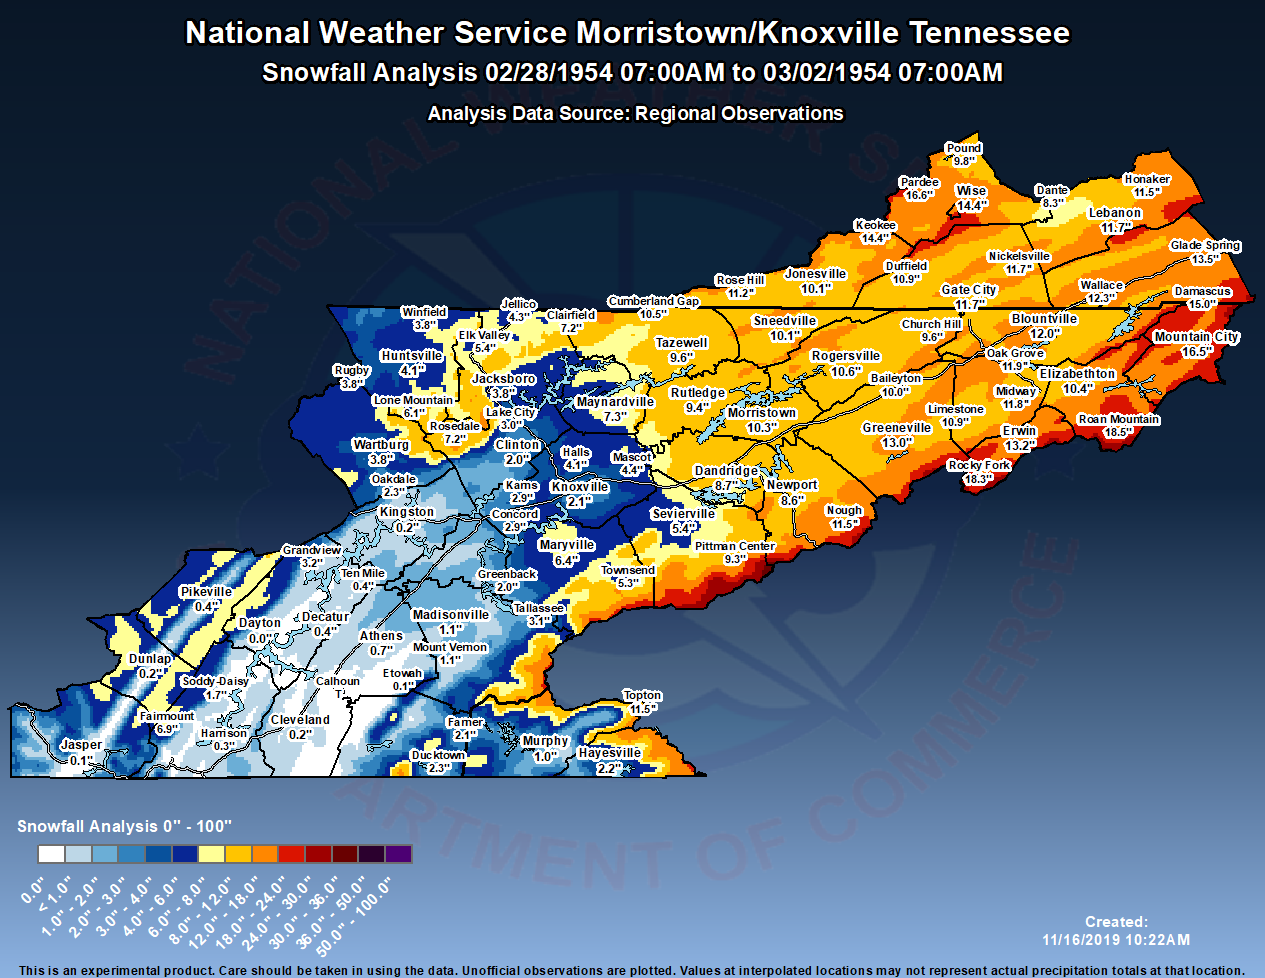
Unofficial observations are plotted from airport observers and COOP observers, and values are interpolated across the map with terrain enhancement. Values at interpolated locations may not represent actual precipitation totals at that location, so care should be taken in using the data.
Low pressure tracked from just offshore of the Louisiana coast to the Florida panhandle before moving offshore of the Georgia and South Carolina coasts. This system produced a swath of moderate to heavy snow north of its track in a cold airmass that was locked in place across the southern Appalachians. Snow overspread the region during the early morning hours of 15 February and lasted through the morning of 16 February before ending. Snowfall totals ranged from 7 to 12 inches across northeast Tennessee and southwest Virginia with 6 to 10 inches across the northern plateau and northern valley. Lighter amounts of generally 3 to 6 inches fell across the central valley with 1 to 5 inches in southwest North Carolina. Farther southwest, 1 to 3 inches fell across the southern plateau and southern valley.
**Click each image to open it in a new window**
At 00Z 15 February, a split flow pattern was in place ahead of this snow event with quasi-zonal flow across the U.S. A southern stream mid-level shortwave was moving through southern Texas, and ahead of this feature, the southern Appalachians were perfectly positioned in the right entrance region of a 100-130 knot upper level jet streak. A surface high in the Great Lakes kept a feed of cold air in place ahead of the shortwave disturbance, with 850 mb temperatures of 0 to -5 C across the southern Appalachian region. A surface low was starting to develop in response to the shortwave offshore of the Louisiana coast.

At 12Z 15 February, the surface low was still in the northern Gulf tracking along a quasi-stationary front, and widespread snow was falling across the Tennessee Valley and southern Appalachians from isentropic lift as the surface high in the Great Lakes continued to feed cold air southward.

Isentropic lift induced snow continued across the region during the day 15 February as the system moved closer, with the jet energy enhancing the strip of snow as well. By 00Z 16 February, the surface low was over the Florida panhandle with its parent mid-level shortwave fairly far displaced over the Tennessee Valley. The surface high had remained in nearly the same position in the Great Lakes, so the feed of cold air into the southern Appalachians and Tennessee Valley was consistent with 850 mb temperatures still between 0 and -5 C. This high kept the storm system on a southern, west to east track, so the northern and southern stream jets never truly phased.

By 12Z 16 February, the surface low was offshore of the Georgia and South Carolina coasts. Lingering wrap around moisture maintained snow showers across the region during the morning before ending.
**Click the image to open it in a new window**

Unofficial observations are plotted from airport observers and COOP observers, and values are interpolated across the map with terrain enhancement. Values at interpolated locations may not represent actual precipitation totals at that location, so care should be taken in using the data.
NOTE: The snowfall map is very coarse due to a lack of reports from this event.
Low pressure tracked along the coasts of Texas and Louisiana before turning northeastward through the Southeast United States and Mid Atlantic coast while strengthening. This system tapped into unusually cold arctic air that was locked in place across the Tennessee Valley and southern Appalachians to produce heavy snowfall across the region north and west of its track. Snow began during the afternoon on 06 January and continued through the early morning hours of 08 January before coming to an end. Snowfall totals ranged from 8 to 12 inches from the southern plateau through the southern valley and southwest North Carolina with generally 4 to 8 inches across the central valley. Lighter amounts of 4 to 7 inches fell from the northern plateau through the northern valley with 4 to 6 inches across northeast Tennessee. Slightly higher amounts of 6 to 8 inches fell across southwest Virginia.
**Click each image to open it in a new window**

At 00Z 06 January, widespread, unusually cold, arctic air was in place east of the Rockies with a broad mid/upper level longwave trough across the eastern two thirds of the U.S. Temperatures at 850 mb were -10 to -15 C across the Tennessee Valley and southern Appalachians. Broad cold surface high pressure covered the Plains and Mississippi Valley. At the same time, a southern stream mid-level shortwave trough was entering southern California.

By 12Z 06 January, a surface low was moving through Utah with an associated warm front developing ahead of it across the Rockies. Widespread isentropic lift induced precipitation was breaking out across the central and southern Plains between this front and the big surface high over the Midwest.

By 00Z 07 January, snow had been falling across the southern Appalachian region due to strong upper level divergence from the right entrance region of a 90-130 knot jet streak, as well as, isentropic lift. Temperatures at 850 mb were still very cold at -5 to -10 C across the Tennessee Valley and southern Appalachians with elongated surface high pressure to the north. The mid-level shortwave was now near the panhandle of Texas, however, it was still separated from the northern branch of the jet. New surface cyclogenesis was taking place near the Texas Gulf coast in response to the shortwave.
At 12Z 07 January, the surface low was strengthening near the Louisiana Gulf coast with widespread isentropic lift snowfall continuing across the Tennessee Valley and southern Appalachians. An inverted surface trough extending north of the low into the Tennessee Valley was also helping to focus heavier precipitation.

The mid-level shortwave continued eastward through the day on 07 January finally phasing with the northern stream jet. This allowed the surface low to quickly deepen as it moved through the southern U.S. into the Southeast U.S. By 00Z 08 January, the surface low was centered in the vicinity of Georgia and South Carolina beginning to turn northeastward along a frontal boundary. This allowed moderate to heavy snow to continue across parts of the southern Appalachians as a deformation zone set up west of the track of the low. Strengthening cold air advection behind the storm continued to deepen the cold air across the Tennessee Valley with the -5 to -10 C 850 mb isotherms dipping farther south. The snow finally ended the next morning as the low rapidly moved up the Mid Atlantic coast.

By 12Z 08 January, the surface storm was offshore of the southeast Virginia coast with only a few snow showers remaining across southwest Virginia as the deformation zone pulled away.
**Click the image to open it in a new window**

Unofficial observations are plotted from airport observers and COOP observers, and values are interpolated across the map with terrain enhancement. Values at interpolated locations may not represent actual precipitation totals at that location, so care should be taken in using the data.
Low pressure rapidly developed and intensified across the northeastern Gulf interacting with a broad area of arctic air across the eastern United States. Snow spread into the southern Appalachian region during the day 31 December as the low moved to the Florida panhandle. The snow continued through the night as the original low continued northward into western North Carolina while a new low developed and strengthened offshore of South Carolina by the morning of 01 January. The system continued moving northward up the Mid Atlantic coast during the day on 01 January allowing the snow to gradually end. Snowfall totals ranged from 6 to 10 inches across much of the southern plateau and southern valley with 5 to 8 inches across the central valley and northern plateau. Lighter amounts of 2 to 5 inches fell across the northern valley, northeast Tennessee, and southwest Virginia with a trace to 2 inches in southwest North Carolina.
**Click each image to open it in a new window**
At 00Z 31 December, the overall pattern was very favorable for a strong winter storm in the Southeast U.S. A deep mid/upper level longwave trough was centered over the Mississippi Valley with its base extending into the Gulf as a longwave ridge amplified over the western U.S. The southern Appalachians were on the east side of this trough axis and near the right entrance region of a 130+ knot upper jet streak. Elongated, cold surface high pressure stretched from the Midwest through the Northeast U.S. with a large pool of 850 mb temperatures between -5 and -10 C across the Tennessee Valley and southern Appalachians.

By 12Z 31 December, surface low pressure was developing in the central Gulf with elongated surface high pressure across the Midwest and Northeast maintaining the feed of arctic air into the Tennessee Valley and southern Appalachians.

During the day 31 December, the mid/upper longwave trough further deepened into the Gulf as a significant shortwave dove through the base of the trough. This resulted in the surface low rapidly strengthening in the northeastern Gulf. Snow fell well ahead of this across the southern Appalachians during the day due to the persistent upper level divergence from the 130+ knot jet streak still nearby and isentropic lift. The upper jet energy also aided in further strengthening the surface low. By 00Z 01 January shown above, the surface low was centered near the Florida panhandle.
The above upper maps and below surface chart show how heavy snow continued across the region through the night as the surface low started to bomb out as it tracked through the Southeast U.S setting up a TROWAL or deformation zone west of its track across the southern Appalachians. The parent mid-level shortwave hung back to the west across middle Tennessee while closing off. By 12Z 01 January, a secondary intense surface low was centered offshore of South Carolina with the original low starting to weaken over western North Carolina. Strong cold air advection on the backside of this major system dropped 850 mb temperatures to below -10 C across the Tennessee Valley and southern Appalachians. A feed of moisture from the Atlantic represented by anomalous precipitable water values can be seen wrapping around the circulations into East Tennessee, southwest Virginia, and southwest North Carolina. This was a classic Miller B storm. The snow ended during the day as the storm tracked up the Mid Atlantic coast.

**Click the image to open it in a new window**

Unofficial observations are plotted from airport observers and COOP observers, and values are interpolated across the map with terrain enhancement. Values at interpolated locations may not represent actual precipitation totals at that location, so care should be taken in using the data.
NOTE: The snowfall map is very coarse due to a lack of reports from this event.
Low pressure developed in southwest Texas then tracked eastward across the Gulf coast through the Florida panhandle. A large area of arctic air was in place across the eastern half of the United States, so a swath of heavy snow fell to the north of the track of the low across parts of the Tennessee Valley and southern Appalachians. The snow began during the day 09 January and gradually ended during the day 10 January. Snowfall totals ranged from 6 to 10 inches across the southern valley and southwest North Carolina with 6 to 8 inches on the southern plateau. Lighter amounts of 2 to 5 inches fell across the northern plateau and central valley with 1 to 3 inches across the northern valley and northeast Tennessee. Farther northeast, only a trace to 2 inches occurred in southwest Virginia.
**Click each image to open it in a new window**

At 00Z 09 January, a large area of arctic air was in place across the eastern two thirds of the U.S. due to broad mid/upper level troughing beneath a blocking ridge over the Arctic and Hudson Bay and a cold surface high over the northern Plains. Temperatures at 850 mb were already -10 to -15 C across the Tennessee Valley and southern Appalachians. A southern stream mid-level shortwave could be seen moving through Mexico with the southern Appalachians near the right entrance of a 130+ knot jet streak. A weak surface low was beginning to develop near southwestern Texas in response to the mid-level shortwave trough.

By 12Z 09 January, the surface low was strengthening and moving along the Texas Gulf coast along a quasi-stationary frontal boundary laying east-west across the Gulf. Cold surface high pressure had moved into the lower Ohio Valley, which kept the storm track further south giving Chattanooga and the southern Valley a more favorable set up for heavy snow.
The surface low tracked to the Louisiana/Mississippi coast by 00Z 10 January shown above with its parent shortwave lifting into the Arklatex region. An inverted trough hung north of the surface low across the Tennessee Valley and southern Appalachians allowing for widespread isentropic lift induced snowfall in Southeast Tennessee and southwest North Carolina which was also aided by the strong jet energy. Temperatures at 850 mb stayed below -5 C in most areas, so this was a drier than normal snow for the region.
By 12Z 10 January, the surface low was just south of the Florida Panhandle with the inverted trough still hanging back into the southern Appalachians focusing additional snowfall from isentropic lift across the region.
The snow gradually ended during the day on 10 January as the surface low and enhanced jet energy finally moved eastward. By 00Z 11 January, the surface low was offshore of the Georgia/Florida coast with a weak trough in northeast Tennessee and southwest Virginia allowing for a few lingering snow showers and flurries. Temperatures remained cold behind the system with 850 mb temperatures staying between 0 and -5 C and generally broad mid/upper troughing across much of the U.S.

The surface low can be seen turning northeastward offshore of the Carolinas at 12Z 11 January, while the secondary trough still lingered in southwest Virginia.
**Click the image to open it in a new window**

Unofficial observations are plotted from airport observers, COOP observers, and CoCoRaHS, and values are interpolated across the map with terrain enhancement. Values at interpolated locations may not represent actual precipitation totals at that location, so care should be taken in using the data.
A strengthening low pressure system moved rapidly northeastward from the western Gulf of Mexico to the Mid Atlantic coast and interacted with a broad, cold airmass across the Tennessee Valley and southern Appalachians to produce heavy snowfall. The snow began during the day on 29 January and ended during the early morning hours of 30 January. Record cold temperatures followed in the wake of this system. Snowfall totals ranged from 8 to 12 inches across the entire plateau to 6 to 8 inches across the central and southern valley and southwest North Carolina. Another area of higher amounts fell across northeast Tennessee, southwest Virginia, and the East Tennessee mountains where 6 to 10 inches were common. The lightest amounts occurred in the northern valley where generally 4 to 7 inches fell.
**Click each image to open it in a new window**

Before this event unfolded at 00Z 29 January, the pattern was very favorable for a strong winter storm in the Southeast U.S. with a deep mid/upper level longwave trough in the middle of the country as a longwave ridge amplified over the western U.S. The base of the trough extended into Mexico and the Gulf with a shortwave moving into the western Gulf and surface low pressure also developing in the western Gulf in response. Downstream of these features, an intense 130+ knot jet streak stretched across much of the southern U.S. A surface high moving into the northern Plains supplied plenty of arctic air with 850 mb temperatures of -5 to -10 C across the Tennessee Valley and southern Appalachians.
The above surface chart and below upper air maps show that by 12Z 29 January, the mid-level shortwave was rotating into the northern Gulf with the surface low moving to near the Mississippi coast and continuing to deepen in response. The southern Appalachians remained near a 130+ knot upper level jet streak which aided in the deepening of the surface storm. Snow fell across the southern Appalachian region during the day from both widespread isentropic lift ahead of the low and quasi-stationary front and the upper level divergence of the jet maximum. Gulf moisture represented by anomalous precipitable water values can be seen advecting northward ahead of the surface low. The surface high remained near the northern Plains continuing to advect -5 to -10 C 850 mb temperatures into the region to keep the precipitation all snow.

By 00Z 30 January shown above, the surface low had bombed out and was quickly moving up the Mid Atlantic coast along a frontal boundary. A deformation zone/TROWAL had continued to bring moderate to heavy snow across the southern Appalachians west of its track during the day on 29 January. Extremely cold air followed in the wake of this storm system with 850 mb temperatures of -20 to -25 C moving into the Tennessee Valley and southern Appalachians in the strong cold air advection regime. In fact, a closed 500 mb vortex can be seen dropping into the lower Ohio Valley, similar to what is usually seen in northern Canada or the Arctic! The snow quickly ended overnight as the surface storm continued to move up the east coast, but the stage was set for a top 5 to 10 record cold outbreak across East Tennessee, southwest Virginia, and southwest North Carolina.

By 12Z 30 January, the surface storm was quickly moving up the New Jersey coast with arctic high pressure building into the Tennessee Valley.
**Click the image to open it in a new window**

Unofficial observations are plotted from airport observers and COOP observers, and values are interpolated across the map with terrain enhancement. Values at interpolated locations may not represent actual precipitation totals at that location, so care should be taken in using the data.
NOTE: The snowfall map is very coarse due to a lack of reports from this event.
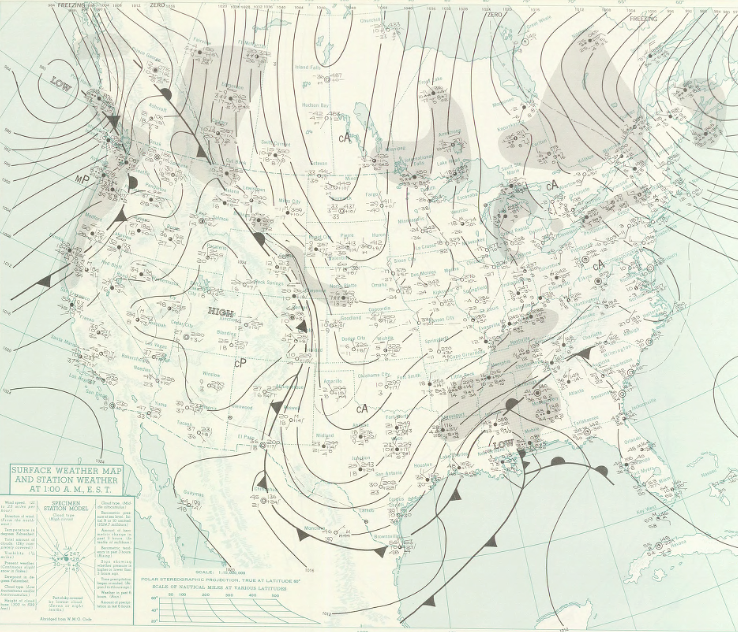
An area of low pressure developed over the southwestern United States and moved eastward along the Gulf coast before turning northeastward up the East coast. This system interacted with widespread arctic air that was in place across the Tennessee valley and southern Appalachians to produce heavy snowfall across the region. Snow began during the early morning hours of 23 January and ended during the morning on 24 January. Snowfall totals ranged from 8 to 12 inches across the entire valley into southwest Virginia with 7 to 9 inches on the southern plateau and 5 to 8 inches on the northern plateau and across southwest North Carolina. Lighter amounts of generally 3 to 7 inches fell across northeast Tennessee.
**Click each image to open it in a new window**

At 12Z 22 January, strong surface high pressure was centered over the northern Rockies with a second surface high sprawling across the southern Plains. A surface low pressure system was located over northern Maine, so a northwesterly flow in between allowed widespread arctic air to flow into the eastern two thirds of the U.S. At the same time, a surface low was developing over the desert southwest with isentropic lift precipitation breaking out ahead of this system across west and central Texas.

That surface low moved eastward across the Gulf coast through the day and the overnight of 22-23 January. The increasing southerly flow ahead of its track brought copious amounts of Gulf moisture northward into the cold air, so isentropic lift snowfall began across the Tennessee valley and southern Appalachians in the early morning hours of 23 January. By 12Z 23 January, the surface low was centered just south of the Florida panhandle. The broad surface high had shifted to the Northeast U.S. continuing the feed of arctic air into the southern Appalachian region.

The surface low turned northeastward during the day 23 January and moved up the Southeast coast, while rapidly deepening in the process. This placed the southern Appalachians in a TROWAL or deformation band of heavy snowfall west of the track of the low through the day and night of 23-24 January. By 12Z 24 January, the surface low had bombed out and was centered offshore of the Mid Atlantic. The snow ended during the morning on 24 January across the southern Appalachians as the storm continued to move northeastward. No upper air maps were available for this event due to its distant place in time.
**Click the image to open it in a new window**
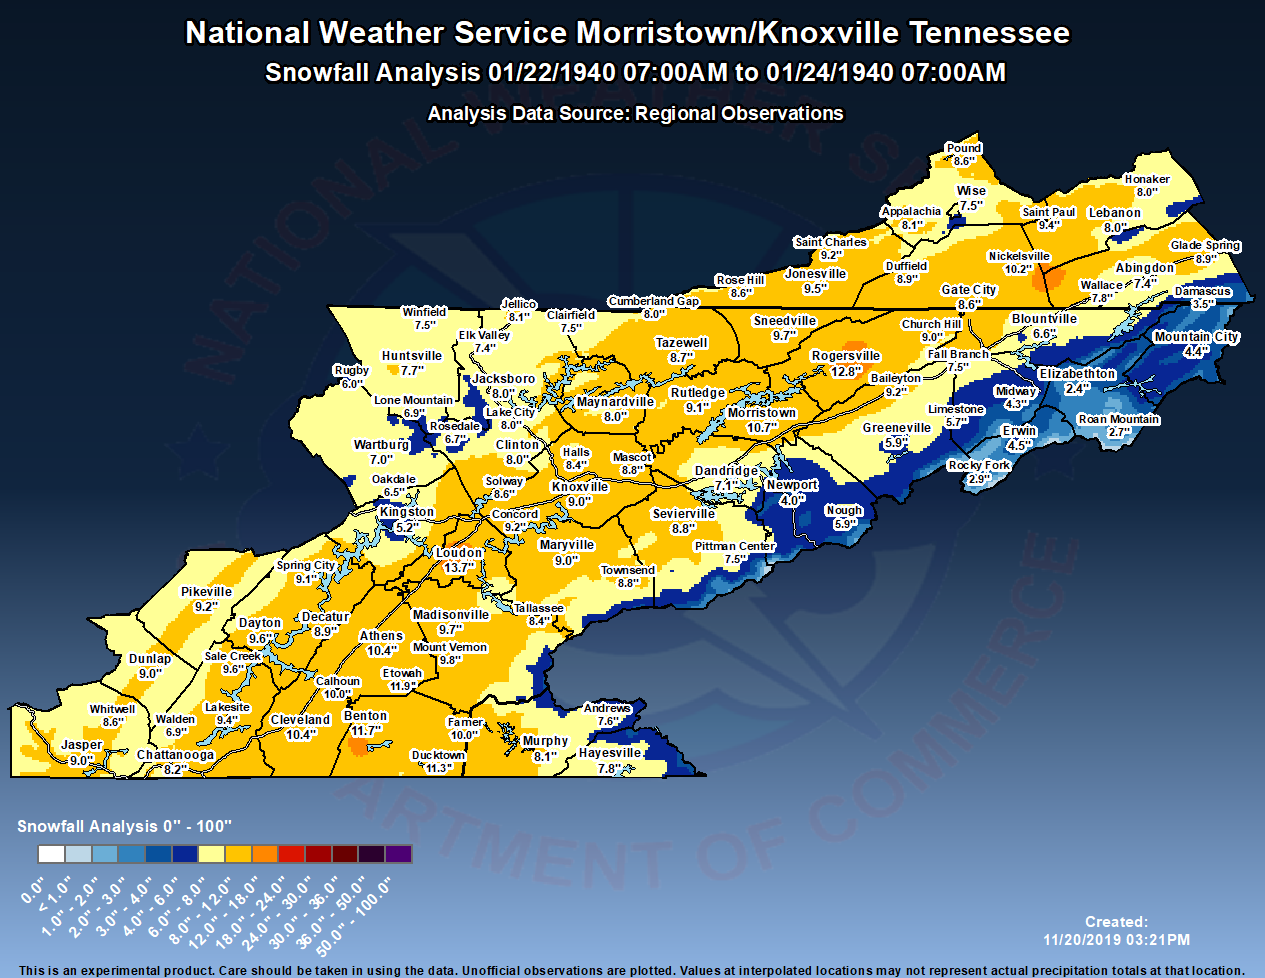
Unofficial observations are plotted from airport observers and COOP observers, and values are interpolated across the map with terrain enhancement. Values at interpolated locations may not represent actual precipitation totals at that location, so care should be taken in using the data.
A low pressure system developed over the Southwest United States and moved eastward along the Gulf coast before exiting the coast of Florida and moving into the Atlantic. This system pulled a large area of moisture from the Gulf of Mexico northward which interacted with arctic air across the Tennessee valley to produce heavy snowfall. The snow began during the day on 07 January and ended during the morning on 08 January. Snowfall totals ranged from 6 to 8 inches across the central valley to 4 to 6 inches across the southern and northern valley and the plateau. Lighter amounts of 2 to 5 inches fell across northeast Tennessee with 2 to 4 inches in southwest Virginia and 1 to 4 inches in southwest North Carolina.
**Click each image to open it in a new window**
At 00Z 07 January, a flat mid/upper level ridge was in place across most of the U.S. east of the Rockies downstream of a longwave trough west of the Rockies. This set up a strong 140+ knot upper level jet across the Ohio and Tennessee valleys with the southern Appalachians region near the right entrance of this jet. At the surface, high pressure over the northern Plains and upper Midwest supplied arctic air southward with 850 mb temperatures of 0 to -5 C across the Tennessee valley and southern Appalachians. A mid level shortwave was moving into southern California rounding the base of the longwave trough, and increasing warm air advection ahead of this shortwave was advecting above normal precipitable water values into the southern Plains.

By 12Z 07 January, surface low pressure associated with the aforementioned shortwave was developing over the Southwest U.S. Widespread isentropic lift induced precipitation was breaking out across the southern Plains and Gulf coast to the north of a quasi-stationary front as the warm and moist air advecting northward ahead of the low overran the cold air that was being continuously supplied southward by the surface high in the vicinity of the northern Plains.

Snow spread into the southern Appalachians during the day 07 January. By 00Z 08 January, the mid level shortwave was located over the Ark-La-Tx with the surface low near the central Gulf coast. The southern Appalachians remained in the right entrance of a 140+ knot upper jet streak which led to strong upper level divergence to enhance lift for snowfall. This combined with strong isentropic lift continuing across the region as moist, southerly surface to 850 mb flow from the Gulf continued to overrun the cold air in place. This can be seen by the above normal precipitable water values advecting northward into the region as 850 mb temperatures remained at 0 to -5 C.
Snow continued across the southern Appalachians through the night and into the morning of 08 January as the surface low moved eastward along the Gulf coast and a TROWAL or deformation zone set up to the northwest of its track. By 12Z 08 January, the surface low was centered over the Florida panhandle with some TROWAL-induced snow continuing across the southern Appalachians. The surface high was still centered over the northern Plains feeding persistent cold air southward. The snow ended during the morning on 08 January as the low continued moving eastward into the western Atlantic.
**Click the image to open it in a new window**

Unofficial observations are plotted from airport observers and COOP observers, and values are interpolated across the map with terrain enhancement. Values at interpolated locations may not represent actual precipitation totals at that location, so care should be taken in using the data.
NOTE: The snowfall map is very coarse due to a lack of reports from this event.
A low pressure system formed in the western Gulf and moved east-northeastward into the Texas Gulf coast, southern United States, then offshore of South Carolina. Warm and moist air flowed north and westward from the Gulf of Mexico and western Atlantic ahead of this system into a cold airmass over the Tennessee valley and southern Appalachians. This resulted in a widespread wet snow across the region. Snow began during the day 18 January and ended during the day 19 January. Snowfall totals ranged from 7 to 13 inches across northeast Tennessee, southwest Virginia, and the higher elevations of southwest North Carolina with 10 to 20 inches across the East Tennessee mountains. Amounts of 4 to 8 inches fell across the northern valley and northern plateau. Lighter amounts of 2 to 5 inches fell across the central valley with a trace to 4 inches across the southern plateau. Only a trace to 2 inches were reported across the southern valley and southwest North Carolina.
**Click each image to open it in a new window**

At 00Z 18 January, a deep mid/upper longwave trough was centered over the western High Plains between a sharp ridge over the Rockies and a fairly broad ridge over the eastern half of the U.S. The base of the trough extended well into Mexico, and a mid level shortwave can be seen emanating from the base of the trough into the western Gulf with a weak surface low developing in response. Ahead of this shortwave and surface low, a 110+ knot upper jet was flowing over the southern U.S. and Tennessee valley with the southern Appalachians in the left exit region. This led to upper level divergence and encouraged strong upward vertical motion to produce precipitation. The airmass was not quite cold enough yet for all snow with 0 to 5 C 850 mb temperatures across the region, but a surface high over the upper Midwest and another over the Rockies were beginning to feed colder air southward.

By 12Z 18 January, the surface low had moved northeastward to the Texas Gulf coast and was still fairly weak. A stationary front extended east from the low across the northern Gulf while another boundary extended north from the low. Southerly flow of warm and moist air ahead of the low was overrunning these frontal boundaries resulting in isentropic lift precipitation developing across the southern Plains and Gulf coast as the surface highs over the Rockies and upper Midwest continued feeding cold air southward.

Snow began during the day 18 January across the southern Appalachians as the surface low and parent mid level shortwave continued northeastward with 90-110 knot upper flow ahead of the system causing widespread isentropic lift precipitation as southerly flow ahead of the storm fed Gulf moisture northward. By 00Z 19 January, the mid/upper trough had advanced into the Mississippi valley and become negatively tilted with the shortwave and surface low nearly stacked over central Alabama. Colder air was filtering in behind the system with 850 mb temperatures falling to 0 C or slightly below across much of the Tennessee valley. Both Gulf and Atlantic moisture was advecting north and westward into the Carolinas and southern Appalachians around the circulation seen by much above normal precipitable water values.
Snow continued through the night into the morning of 19 January as the storm system progressed east-northeastward, with the isentropic lift precipitation transitioning to a TROWAL/deformation band as the southern Appalachians moved into the northwestern flank of the system. At 12Z 19 January, the surface low was centered offshore of South Carolina. A surface high over the upper Midwest had remained nearly stationary throughout the duration of this event which supplied just enough arctic air southward to maintain snow as the dominant precipitation type. The snow ended during the day 19 January as the low moved further offshore into the Atlantic.
**Click the image to open it in a new window**
Unofficial observations are plotted from airport observers and COOP observers, and values are interpolated across the map with terrain enhancement. Values at interpolated locations may not represent actual precipitation totals at that location, so care should be taken in using the data.
Low pressure developed near the Louisiana Gulf coast and moved northeastward through the Southeast United States before exiting offshore of the Carolinas. Abundant moisture from the Gulf of Mexico flowed northward ahead of this system and interacted with cold air moving into the region to produce a band of rain and snow across the southern Appalachians. Once all of the rain changed to snow, significant amounts fell across much of northeast Tennessee and southwest Virginia. Rain changed to snow late in the evening on 9 December and gradually ended during the morning on 10 December. Snowfall totals ranged from 5 to 12 inches across northeast Tennessee and southwest Virginia as well as across the East Tennessee mountains. Amounts of 1 to 4 inches fell across the northern valley and the higher elevations of southwest North Carolina. Lighter amounts of a trace to 2 inches were observed on the northern plateau with a trace to 1 inch across the lower elevations of southwest North Carolina. Only a trace to a few tenths fell in the central valley and southern plateau with little to none in the southern valley.
**Click each image to open it in a new window**

At 00Z 09 December, a strong upper longwave trough was digging through the middle of the country with a strong 100 to 120 knot jet flowing from the Tennessee valley into Ohio as shown above. The southern Appalachians were near the right entrance region of this upper jet producing strong upper level divergence across the region.

At the mid levels, a 500 mb shortwave was rotating northeastward through the lower Mississippi valley at 00Z 09 December as shown above. This led to strengthening surface cyclogenesis near the Gulf coast.

Ahead of the developing surface low near the Gulf coast at 00Z 09 December, strong southerly surface to 850 mb winds were transporting abundant moisture northward toward the southern Appalachians from the Gulf as shown above. Temperatures at 850 mb across the Tennessee valley and southern Appalachians were marginally cold enough for snow ranging from 0 to -3 C, with the coldest temperatures over northeast Tennessee and southwest Virginia. This resulted in primarily rain at the onset.
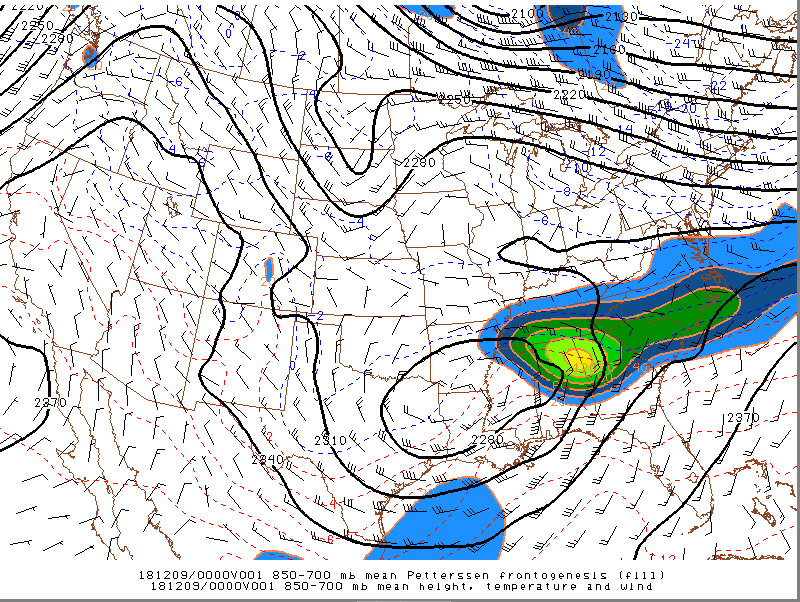
850-700 mb frontogenesis was strong across much of the Tennessee valley and southern Appalachians at 00Z 09 December. This frontogenetic forcing strengthened in response to the strong upper level divergence and jet dynamics aloft, so as the southerly surface to 850 mb winds continued to advect Gulf moisture northward ahead of the developing low, widespread isentropic lift precipitation was focused along this frontal boundary. The southerly flow brought slightly warmer air into the region causing most of the precipitation to fall as rain.

Widespread isentropic lift precipitation, mainly in the form of rain, continued overnight across the southern Appalachians, and by 12Z 09 December, the surface low was located over the Florida panhandle shown above. Two areas of surface high pressure located between the Midwest and the Northeast funneled cold air southward as the southerly flow ahead of the Gulf coast low pumped continuous moisture northward maintaining the band of precipitation along the frontogenesis zone in between. The freezing line had lifted northward through most of East Tennessee which confined most of the snow to higher elevations of southwest Virginia at this time with rain elsewhere.

By 00Z 10 December, much colder air was finally flowing into the region as a broad and deep upper trough dug into the central and eastern U.S. with widespread upper level divergence across the Southeast as a 100-120 knot jet max continued to flow from southwest to northeast as shown above.

Mid level troughing was also firmly in place across the central and eastern U.S. at 00Z 10 December, and the parent mid level shortwave to the surface low was rotating into the vicinity of South Carolina.
The surface low and parent shortwave rotating northeast into the vicinity of South Carolina could be seen in the 850 mb analysis at 00Z 10 December shown above. Winds in the 850 mb layer had become north to northeast with 0 to -2 C 850 mb temperatures advecting into the region. This allowed rain to gradually change to wet snow across all of southwest Virginia, northeast Tennessee, the northern and central valley, and the northern plateau through the night and morning hours of 10 December. Isentropic lift precipitation transitioned to a TROWAL/deformation band to the northwest of the track of the low as the system continued to move through South Carolina.
By 12Z 10 December, the surface low had moved offshore of the Carolinas with the TROWAL of steady snowfall pulling away from the southern Appalachians during the morning. The surface high over the Midwest was slowly moving southward allowing deeper cold air to filter into the region in the wake of the system. Scattered snow showers lingered during the day as a east-west surface trough maintained some convergence across the region, but this did not amount to much in the way of accumulation.
**Click the image to open it in a new window**

Unofficial observations are plotted from airport observers, COOP observers, and CoCoRaHS, and values are interpolated across the map with terrain enhancement. Values at interpolated locations may not represent actual precipitation totals at that location, so care should be taken in using the data.
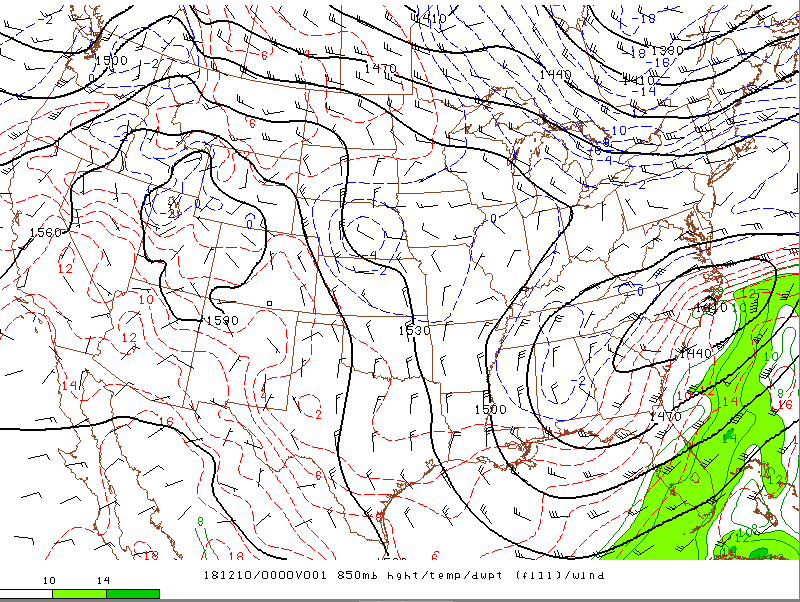
A low pressure system moved from west Texas into the Southeastern United States, then rapidly strengthened as it phased together with a second storm system over the upper Midwest. This strong low pulled arctic air southward into the southern Appalachians causing rain to change to heavy snow across the region. Snow began during the late morning on 25 December and ended during the morning 26 December. Snowfall totals ranged from 8 to 13 inches across northeast Tennessee and southwest Virginia and the higher elevations of southwest North Carolina with 10 to 20 inches in the East Tennessee mountains. Totals of 7 to 10 inches were reported across the northern plateau and northern valley with 5 to 9 inches in the central valley and 5 to 8 inches across the lower elevations of southwest North Carolina. Slightly lower amounts of 2 to 7 inches fell across the southern plateau and southern valley.
**Click each image to open it in a new window**

At 00Z 25 December, quasi-zonal mid/upper flow extended across the U.S. east of the Rockies downstream of a longwave ridge over the western U.S. A southern stream mid level shortwave was moving across New Mexico with surface cyclogenesis taking place in response in west Texas. A northern stream mid level shortwave was also digging southeastward into the northern Plains. Cold surface high pressure over the eastern Great Lakes supplied cold air southward with 850 mb temperatures below 0 C across northeast Tennessee and southwest Virginia, while warmer air characterized by 850 mb temperatures of 0 to 5 C persisted farther south across southeast Tennessee and southwest North Carolina.

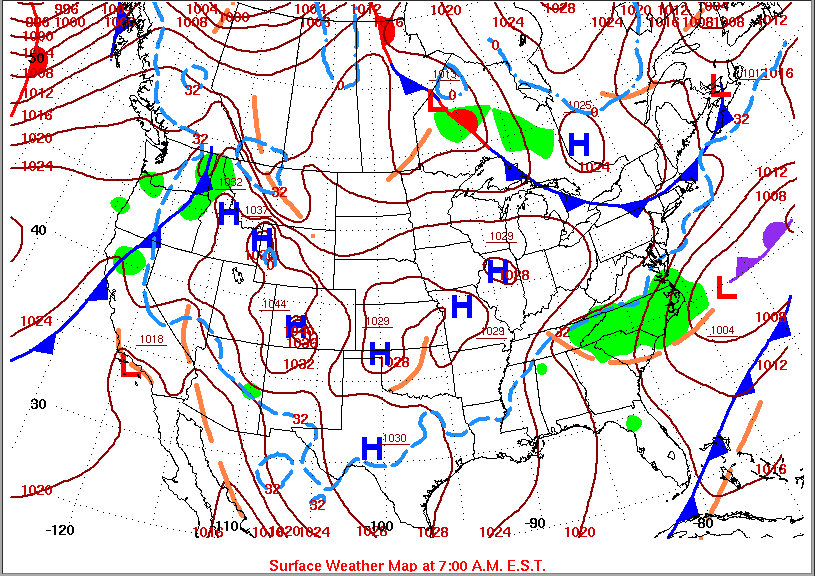
By 12Z 25 December, the southern stream surface low had moved eastward and was centered near the Texas/Louisiana border, while low pressure associated with the northern stream shortwave was organizing across northern Minnesota. The surface high had moved to the vicinity of New England but was still feeding cold air southward into the southern Appalachians. A southerly flow of moist air from the Gulf ahead of the southern stream low was overrunning the cold air to the north causing isentropic lift precipitation to break out, and this moved into the southern Appalachians during the late morning on 25 December. The precipitation fell as snow across northeast Tennessee and southwest Virginia where the coldest air was, but primarily fell as rain farther south across southeast Tennessee and southwest North Carolina.

As the northern and southern stream shortwaves continued eastward during the day 25 December, they began to phase, and by 00Z 26 December, a deep longwave trough was digging through the Mississippi valley and becoming negatively tilted. These factors led to a rapidly deepening surface storm as the low progressed northeastward through Alabama and Georgia. Strong warm air advection ahead of the low pulled copious amounts of Gulf moisture northward to continue producing isentropic lift precipitation in the cold air, and this can be seen by the above normal precipitable water values advecting into the southern Appalachians. Cold air was deepening behind the low with 850 mb temperatures now below 0 C across the entire southern Appalachian region, so rain was finally changing to snow farther south across southeast Tennessee and southwest North Carolina.

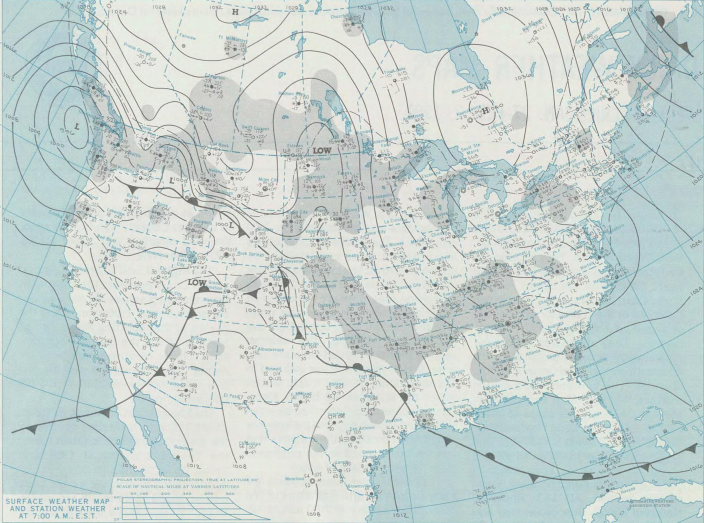
The surface low continued to rapidly deepen while moving up the East coast overnight, and this allowed a TROWAL or deformation band to produce heavy snow west of its track across the southern Appalachians. By 12Z 26 December, the storm had bombed out and was centered near the New Jersey shore while a strong surface high over the northern Plains enhanced the northerly flow of arctic air into the Tennessee valley and southern Appalachians. The snow ended during the morning on 26 December as the system quickly pulled away.
**Click the image to open it in a new window**
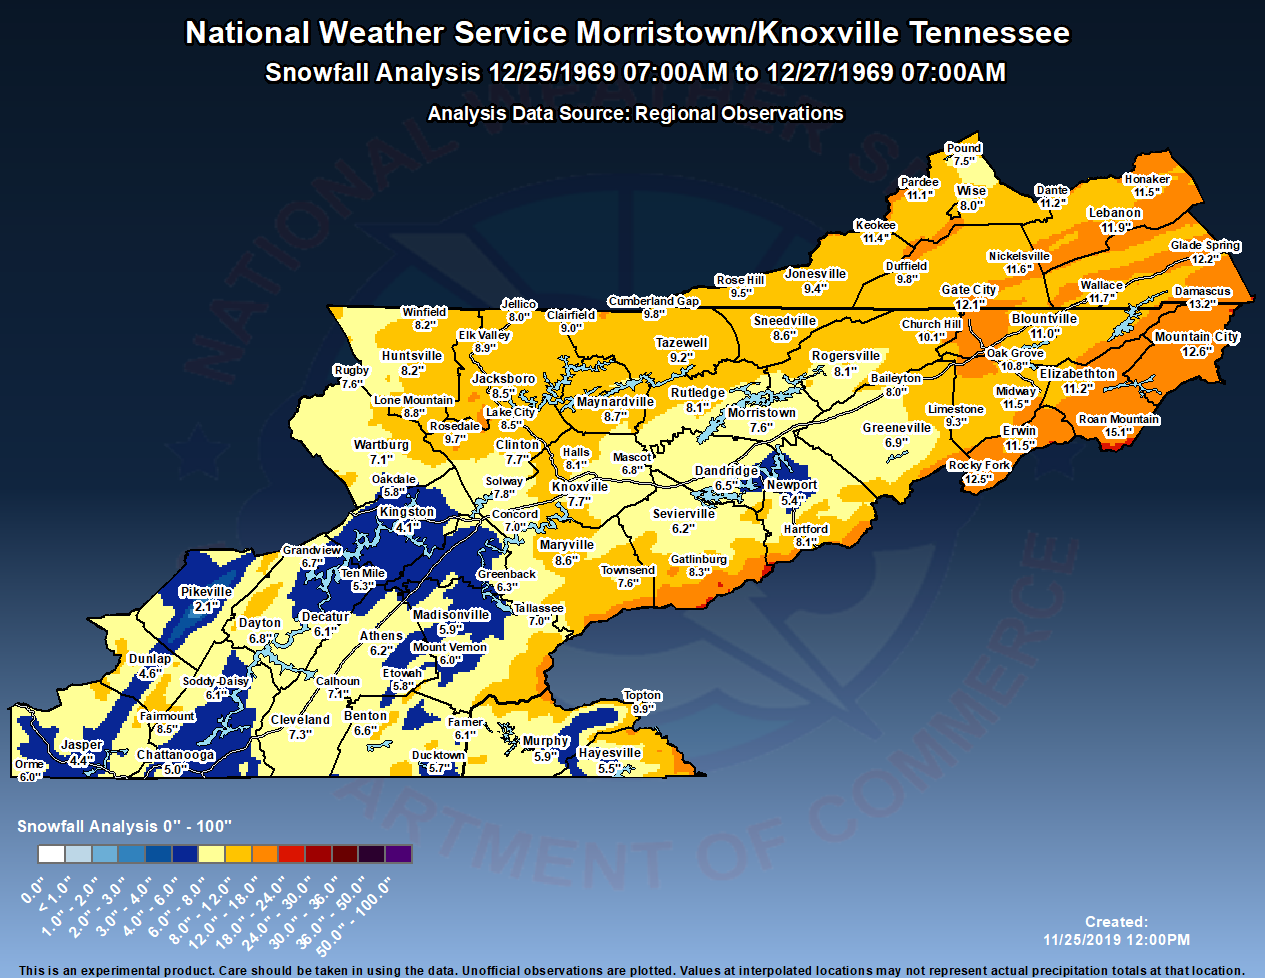
Unofficial observations are plotted from airport observers and COOP observers, and values are interpolated across the map with terrain enhancement. Values at interpolated locations may not represent actual precipitation totals at that location, so care should be taken in using the data.
a weak low pressure system and warm front that moved from the Southwest United States into the lower Mississippi valley interacted with very cold air in place across the Tennessee valley and southern Appalachians to produce a swath of light to moderate snow across the region. The snow began late in the evening on 26 January and ended during the evening 27 January as much warmer air surged into the region changing the snow to rain. Snowfall totals ranged from 3 to 7 inches across the southern plateau and southern valley to a trace to 3 inches across southwest North Carolina. Lighter amounts of a trace to 1 inch fell across the central valley with only a trace to a few tenths across the northern valley, northern plateau, northeast Tennessee, and southwest Virginia.
**Click each image to open it in a new window**

At 00Z 26 January, an amplified pattern was in place with a deep mid/upper longwave trough covering the eastern half of the U.S. centered in the Great Lakes and a broad ridge over the Rockies and western Plains. A mid level low was centered near Hudson Bay, and arctic surface high pressure was located over the upper Midwest. A shortwave was moving through the Southwest U.S., and ahead of it, a belt of 110+ knot upper flow extended across the central Plains into the Tennessee valley placing the region in diffluent flow favorable for upward vertical motion. Plenty of cold air was in place with 850 mb temperatures of -5 to -10 C across the Tennessee valley and southern Appalachians.

At 12Z 26 January, the shortwave had induced surface cyclogenesis, and this low was centered over northeastern New Mexico. A surface trough stretched east-southeastward from this low across the southern Plains into the deep South dividing cold air supplied by the upper Midwest surface high from warmer air near the Gulf. Isentropic lift precipitation was breaking out ahead of these features across the Plains.

By 00Z 27 January, the shortwave and attendant surface low were moving into the southern Plains, and warm and moist advection ahead of it was running into the lingering arctic air. This led to a continued expansion of the insentropic lift snowfall. The airmass remained plenty cold enough since the surface high was still centered over the upper Midwest continuing to supply -5 to -10 C 850 mb air southward into the Tennessee valley and southern Appalachians. The isentropic lift snow moved into the region during the late evening of 26 January.
By 12Z 27 January, the weak surface low had continued tracking along the aforementioned surface trough. Its center could not be easily found at this time, but that trough was now lifting northeastward as a warm front over the lower Mississippi valley. Widespread isentropic lift snowfall continued well ahead of this boundary across the southern Appalachians, with the heaviest falling across the southern valley of southeast Tennessee.
By 00Z 28 January, the snow was nearly done across the region. A deep mid/upper longwave trough was progressing into the western U.S. forcing rapid height rises across the eastern U.S., and a shortwave moving out of the trough was leading to strong surface cyclogenesis over the southern Plains. This was setting up a stronger warm air advection pattern across the southern Appalachians, and 850 mb temperatures had warmed to 0 to 5 C as the weak shortwave that caused the snowfall moved away from the region. Any lingering isentropic lift precipitation as the height rises took place fell as rain.

By 12Z 28 January, warm air was firmly in place across the southern Appalachians with additional rain approaching the region as low pressure and an attendant cold front approached from the Mississippi valley.
**Click the image to open it in a new window**

Unofficial observations are plotted from airport observers and COOP observers, and values are interpolated across the map with terrain enhancement. Values at interpolated locations may not represent actual precipitation totals at that location, so care should be taken in using the data.
Low pressure developed over the Texas Gulf coast and moved northeastward through the Southeast United States while rapidly strengthening. The storm then moved up the East coast into the Northeast United States. This storm system pulled in abundant moisture from the Gulf of Mexico and the Atlantic which interacted with an unusually broad area of arctic air to produce a swath of heavy snow across parts of the Tennessee valley and southern Appalachians. Snow began late in the evening on 11 February and ended during the morning on 13 February. Snowfall totals ranged from 6 to 12 inches across southwest Virginia, northeast Tennessee, and the East Tennessee mountains with generally 5 to 10 inches across the northern and central valley. Generally 4 to 7 inches fell in the southern valley with 3 to 6 inches on the southern plateau and higher elevations of southwest North Carolina and 2 to 5 inches on the northern plateau. Lighter amounts of 2 to 4 inches fell in the lower elevations of southwest North Carolina.
**Click each image to open it in a new window**

At 00Z 12 February, a strong upper trough was amplifying across the central U.S. shown above producing a 100 to 140 knot upper level jet max from the Tennessee valley through the Mid Atlantic. This led to strong upper level divergence across the region.

In the mid levels at 00Z 12 February, a potent southern stream 500 mb shortwave trough was digging through southern Texas as seen above, and this was combining with the strong divergence aloft to induce surface cyclogenesis near the Texas Gulf coast.

As the surface low developed near the Texas Gulf coast at 00Z 12 February, southerly surface to 850 mb winds increased ahead of it allowing copious amounts of Gulf moisture to advect northward shown above. A surface high near the Great Lakes was feeding cold air southward into the Tennessee valley and southern Appalachians ahead of this incoming moisture with 850 mb temperatures of 0 to -5 C.

The upper level divergence and jet dynamics across the Tennessee valley and Mid Atlantic strengthened 850-700 mb frontogenesis along the frontal boundary which separated the cold air advancing south from the warm and moist air advecting north out of the Gulf. This focused a band of isentropic lift precipitation across the Tennessee valley and southern Appalachians as the warm and moist air overran the cold air. The snow began across the region late in the evening on 11 February and during the early morning hours of 12 February. This frontogenetic forcing is shown above at 00Z 12 February.

By 12Z 12 February, the surface low was located near the western Florida panhandle shown above with the southerly flow of moisture advection ahead of it continuing to focus isentropic lift snow along the frontal zone over the southern Appalachians. Strong surface high pressure had moved to the Northeast U.S. and was feeding cold air unusually far south. The freezing line was located over northern Alabama and central Georgia, so all areas in the southern Appalachians continued to see snow as the precipitation type.
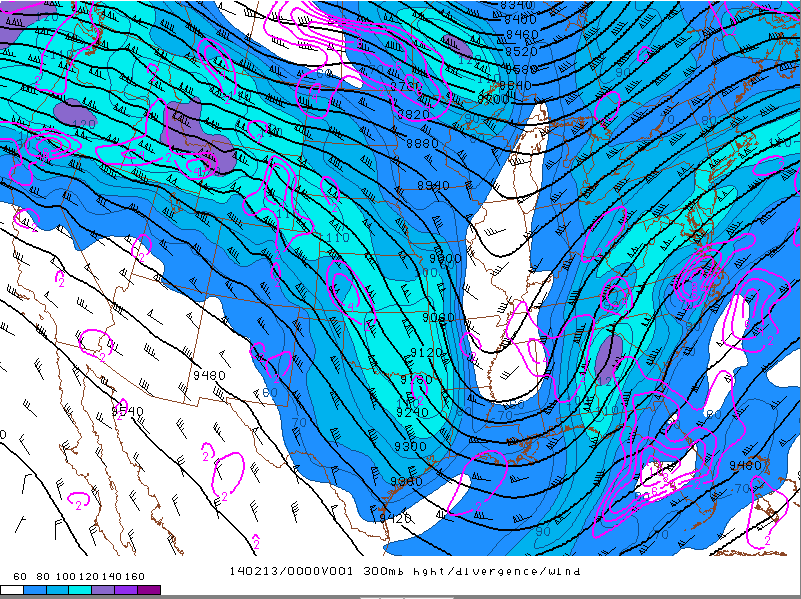
The upper trough continued to advance eastward during the day 12 February, and by 00Z 13 February, a sharp and very deep trough was centered in the Mississippi valley as shown above. Strong upper level divergence associated with a 100 to 140 knot jet max continued across the southern Appalachians and Mid Atlantic. The strong and persistent upper divergence and the digging trough helped the surface low to rapidly intensify as it lifted northeastward.

The 500 mb shortwave associated with the strengthening storm system was also advancing through the Southeast U.S. at 00Z 13 February shown above, and this helped to further deepen the surface cyclone and carve out deep mid/upper troughing in its wake.
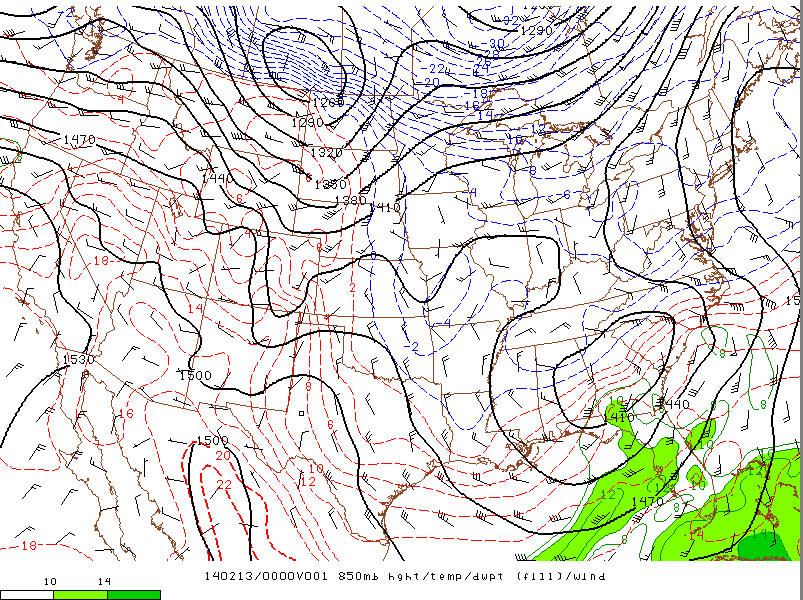
As the surface low and parent shortwave moved through the Southeast U.S., surface to 850 mb winds were becoming east to northeast across the southern Appalachians with 850 mb temperatures staying consistently at -2 to -5 C in the cold air advection behind the low as shown above at 00Z 13 February. Strong moisture transport from both the Gulf and Atlantic continued to wrap around the circulation into the southern Appalachians region to maintain the band of isentropic lift snowfall, and a TROWAL or deformation band also set up northwest of the low.

The TROWAL/deformation zone to the northwest of the surface low could be seen as an 850-700 mb frontogenesis band oriented from northeast to southwest over the southern Appalachians shown above at 00Z 13 February. As the Gulf and Atlantic moisture wrapped around the circulation, this enhanced convergence produced bands of heavy snowfall.

The snow slowly ended during the morning on 13 February as the surface low continued to move up the East coast. By 12Z 13 February, the surface low was centered near the Virginia coast with the TROWAL gradually moving east and northeastward out of the southern Appalachians. Arctic air remained in the wake of the system as surface high pressure over the northern Great Lakes funneled arctic air southward.
**Click the image to open it in a new window**
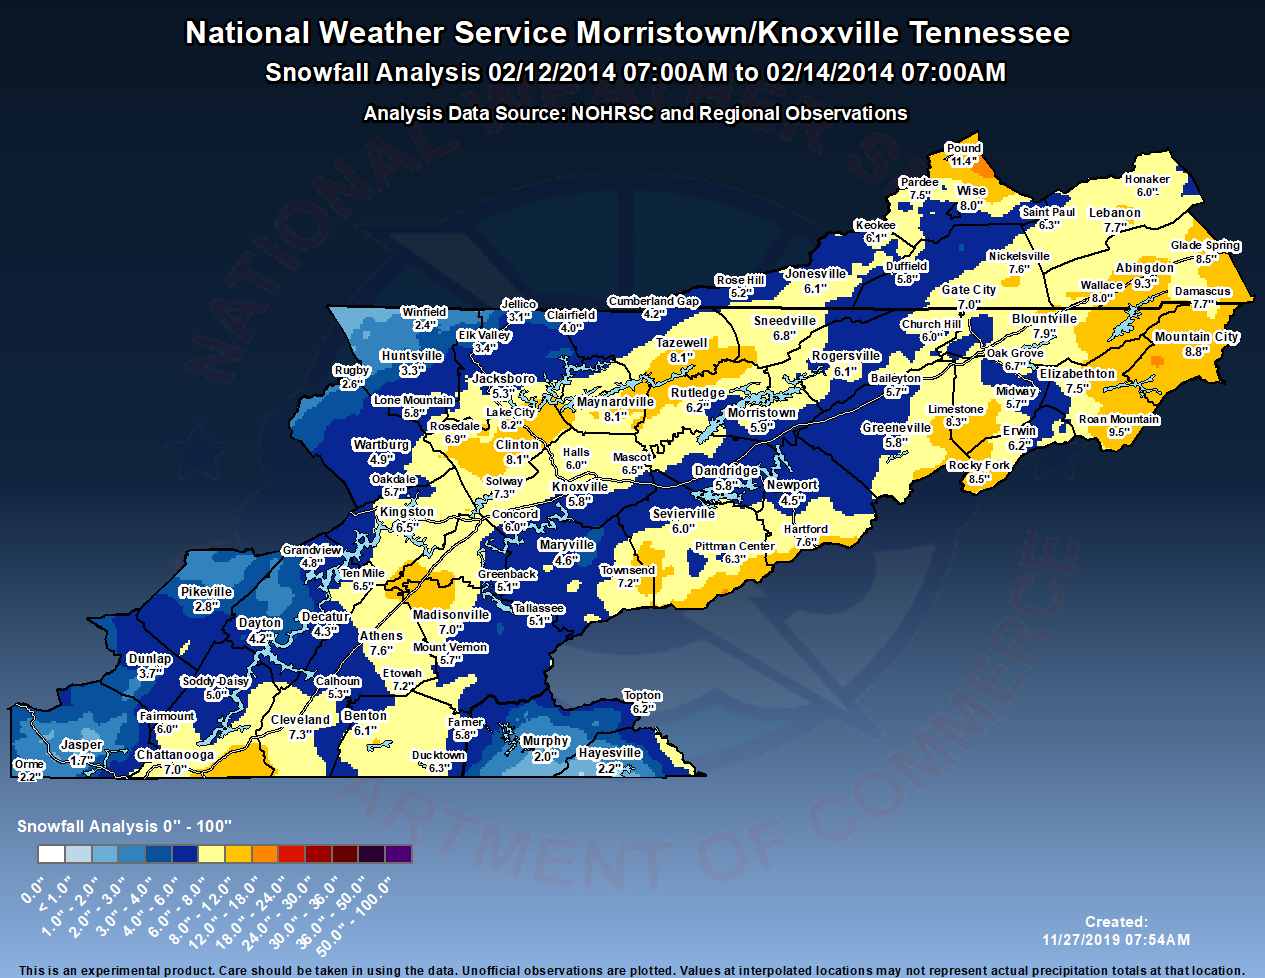
Unofficial observations are plotted from airport observers, COOP observers, and CoCoRaHS, and values are interpolated across the map with terrain enhancement. Values at interpolated locations may not represent actual precipitation totals at that location, so care should be taken in using the data.
A low pressure system developed in the central Gulf of Mexico and rapidly intensified as it lifted northeastward through the Southeastern United States and Mid Atlantic coast as it interacted with a strong surge of arctic air moving into the Tennessee valley and southern Appalachians. This produced a prolonged period of heavy snowfall across the southern Appalachians region. Snow began during the evening on 14 February and gradually ended during the morning on 16 February. Snowfall totals ranged from 6 to 12 inches across northeast Tennessee and southwest Virginia with 10 to 20 inches in the East Tennessee mountains and 10 to 15 inches in the higher terrain of southwest North Carolina. Amounts of 5 to 8 inches accumulated across the northern valley and northern plateau with 4 to 9 inches on the southern plateau, 3 to 7 inches across the southern valley and lower elevations of southwest North Carolina, and 3 to 5 inches in the central valley.
**Click each image to open it in a new window**
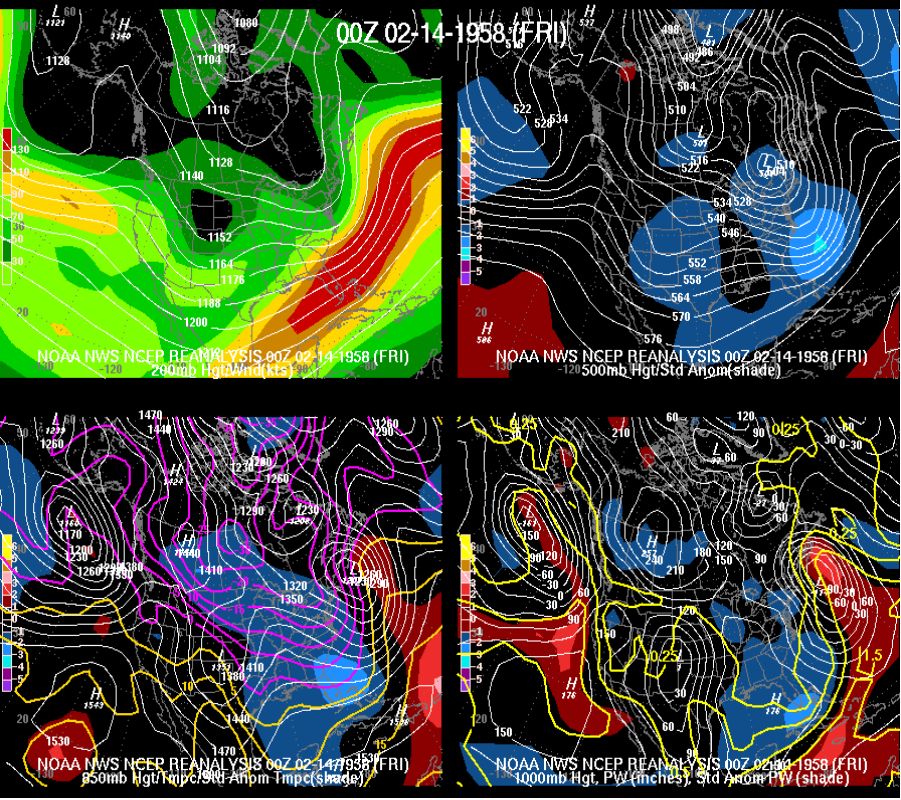
At 00Z 14 February, split flow was in place across the country with a northern stream mid/upper shortwave trough digging into south central Canada and a southern stream shortwave moving across the eastern Rockies. Another northern stream mid/upper trough was situated across the Northeast U.S. A belt of very fast 130+ knot southern stream upper jet winds extended across the eastern Gulf and western Atlantic causing significant diffluence over the area. Large arctic high pressure at the surface covered most of the central and eastern U.S. with 850 mb temperatures of -5 to -10 C across the Tennessee valley and southern Appalachians.
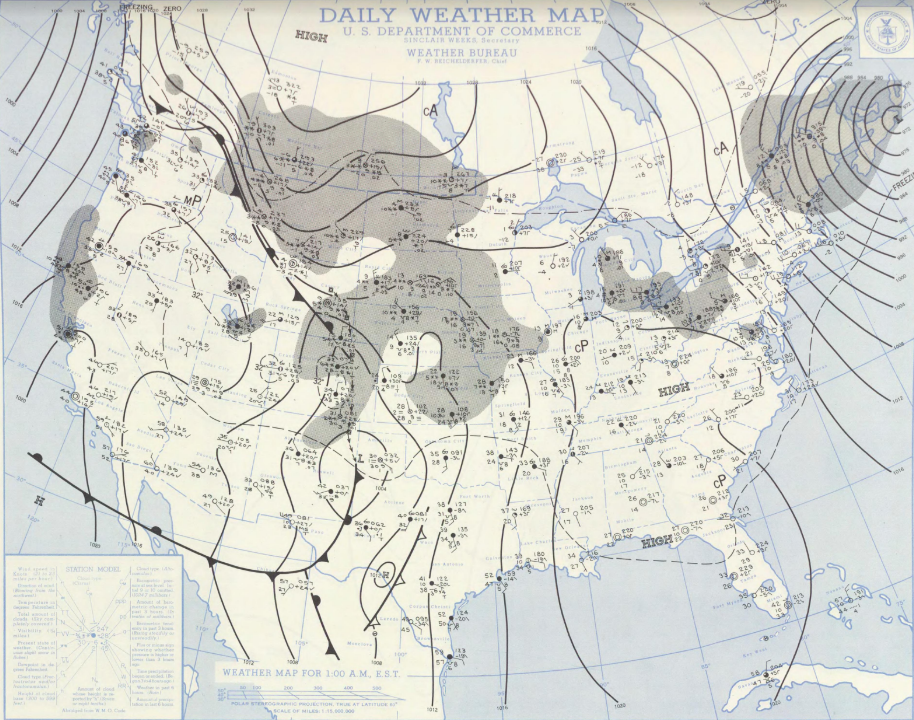
By 12Z 14 February, the aforementioned southern stream shortwave over the eastern Rockies was spinning up a surface low over the Texas panhandle. Large arctic high pressure at the surface still covered much of the eastern U.S. Increasing southerly flow and moisture advection from the Gulf ahead of the Texas panhandle low was overrunning the arctic air with widespread isentropic lift snow developing across the northern and central Plains.

The southern stream mid/upper shortwave continued to dig south into the southern Plains during the day 14 February with the northern stream shortwave also digging south into the northern Plains. By 00Z 15 February, the northern and southern streams were beginning to phase with a solid longwave mid/upper trough starting to take shape across the middle of the country as a ridge amplified west of the Rockies. The base of the trough extended into the Gulf, and the surface low that was located over the Texas panhandle 12 hours earlier was now rapidly intensifying over Louisiana in response to the digging and phasing troughs. A strong upper jet max of 130+ knots continued across the Gulf, far southern U.S., and western Atlantic, and strengthening southerly flow of Gulf moisture ahead of the low worked with this strong divergence aloft to rapidly expand isentropic lift precipitation across the Tennessee valley and southern Appalachians. Snow reached the region during the evening on 14 February with all areas seeing snow as the precipitation type due to 850 mb temperatures still at 0 to -5 C across the southern Appalachians.
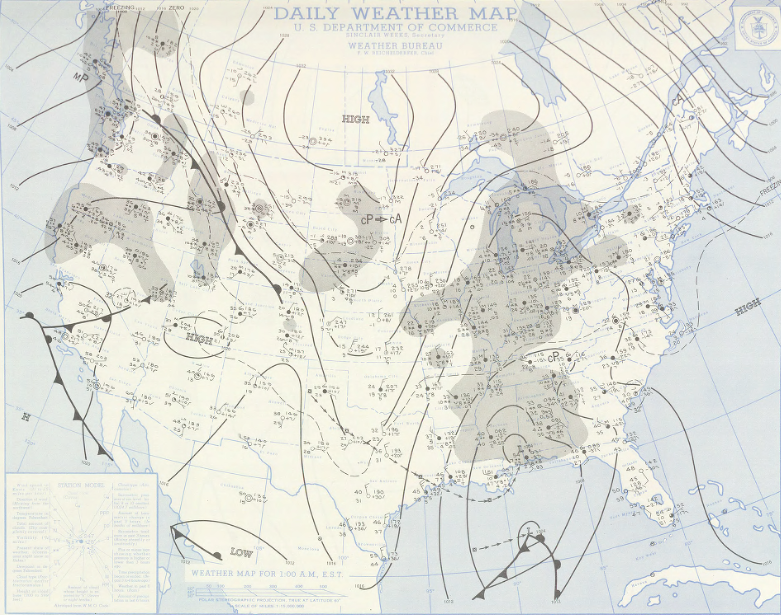
At 12Z 15 February, isentropic lift snow continued across much of the Tennessee valley and southern Appalachians. The mid/upper trough had continued to dig south overnight, so a new surface low was rapidly developing in the central Gulf as the original low near Louisiana was weakening. This double low structure continued to pump copious amounts of moisture into the southern U.S. around the circulations, and a new surface high moving into the northern Plains maintained the feed of arctic air southward.

The new surface low in the Gulf bombed out as it lifted northeastward during the day 15 February in response to the deep mid/upper trough becoming negatively tilted across the central and eastern U.S. By 00Z 16 February, the strong cyclone was centered near the Mid Atlantic. This caused heavy snow to continue across the southern Appalachians as a TROWAL/deformation zone set up west of the track of the low. Strong moisture transport continued around the circulation with both Gulf and Atlantic moisture wrapping into the TROWAL as seen by the much above normal precipitable water values. The strong northerly flow behind the storm combined with the strong arctic surface high in the northern Plains to bring frigid air into the southern Appalachians with 850 mb temperatures dropping to -5 to -10 C and -15 C 850 mb air just northwest of the region!
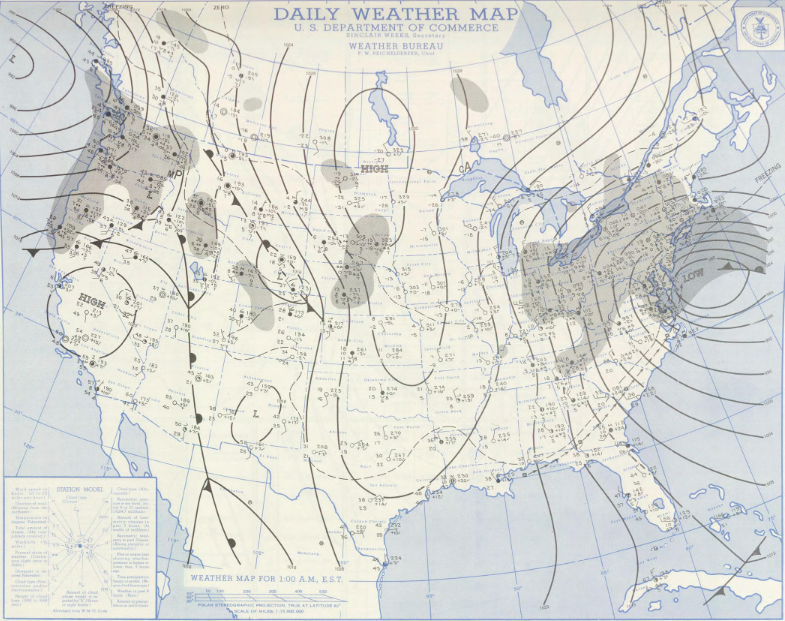
The snow gradually ended during the morning on 16 February as the deep low continued moving up the East coast. At 12Z 16 February, the surface low was centered offshore of New Jersey. Some upslope flow snow showers continued in the mountains of East Tennessee and southwest Virginia for a few more hours before ending. Arctic high pressure at the surface continued to build in and bring frigid air into the region in the wake of the storm.
**Click the image to open it in a new window**

Unofficial observations are plotted from airport observers and COOP observers, and values are interpolated across the map with terrain enhancement. Values at interpolated locations may not represent actual precipitation totals at that location, so care should be taken in using the data.
Knoxville
1. 18.8 inches: February 12-14, 1960
2. 18.2 inches: November 20-22, 1952
3. 16.4 inches: December 4-5, 1886
4. 14.7 inches: March 12-14, 1993
5. 12.7 inches: March 1-3, 1942
6. 12.0 inches: January 8-10, 1962
7. 11.7 inches: February 6-7, 1895
8. 11.3 inches: March 15-16, 1900
9. 10.7 inches: April 2-4, 1987
10. 9.9 inches: January 28-30, 1966
records began January 1, 1884
Tri-Cities
1. 17.1 inches: November 20-22, 1952
2. 14.2 inches: March 12-14, 1993
3. 13.0 inches: March 8-10, 1960
4. 13.0 inches: January 6-7, 1996
5. 12.9 inches: April 2-4, 1987
6. 12.9 inches: February 28-March 1, 1954
7. 11.8 inches: February 15-16, 1969
8. 9.8 inches: January 18-19, 1955
9. 9.8 inches: December 9-10, 2018
10. 9.7 inches: December 25-26, 1969
records began October 1, 1937
Chattanooga
1. 20.0 inches: March 12-14, 1993
2. 12.9 inches: December 4-5, 1886
3. 11.1 inches: February 24-25, 1894
4. 11.0 inches: March 1-2, 1927
5. 10.6 inches: January 18-19, 1893
6. 10.2 inches: January 6-8, 1988
7. 10.1 inches: February 10-11, 1912
8. 10.0 inches: January 9-10, 1892
9. 9.4 inches: March 11-12, 1926
10. 9.1 inches: January 26-27, 1921
records began January 1, 1879


 Local Radar
 Huntsville Radar
 Regional Satellite
 Graphical Forecast
 Weather Map