National Weather Service United States Department of Commerce

Heavy Rainfall and Flooding Threats in the Midwest and Ohio Valley; Heat Continues in the Plains and Southeast

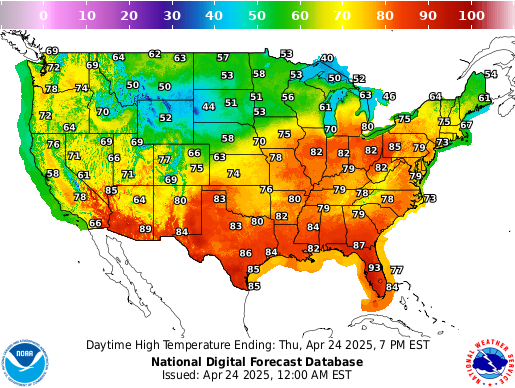
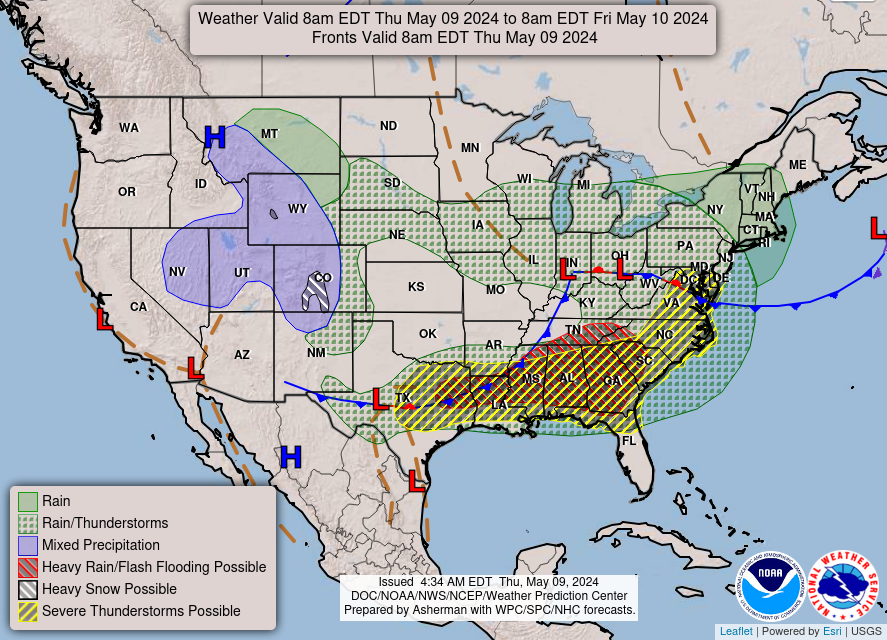
An active pattern will continue to bring heavy to excessive rainfall and flash flooding threats to the Midwest and Ohio Valley over the next couple of days. Dangerous heat continues across the central/southern Plains and Southeast U.S. into next week. There is potential for record-tying/breaking temperatures with many areas forecast to see their hottest temperatures so far this year. Read More >

Click a location below for detailed forecast.

Last Map Update: Thu, Aug 13, 2026 at 4:32:20 pm EDT


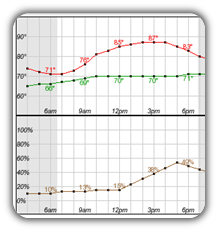
Increasing temperatures and Heat Index values are expected Friday and into the weekend. Plan ahead and practice heat safety!
Chances for showers and storms continue this afternoon and again on Friday. Isolated flooding and damaging straight line winds remain possible. Temperatures increase Friday and into the weekend, with Heat Index values nearing advisory levels. Isolated showers will be possible in the afternoon Saturday and Sunday.
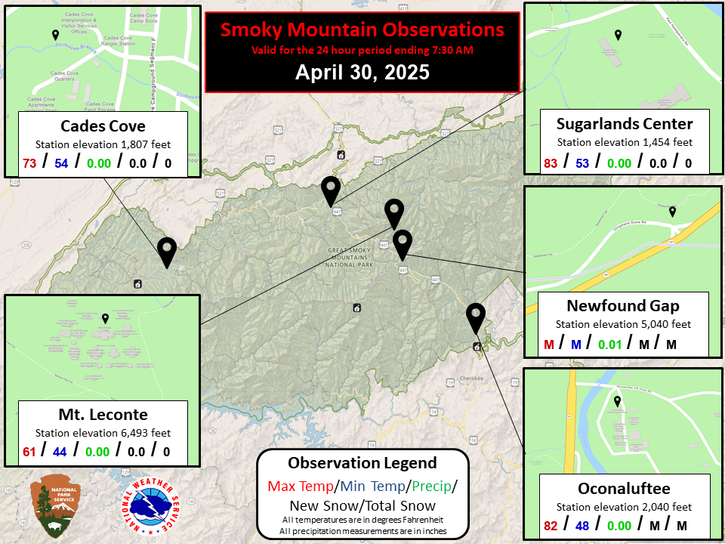
Each observation point is apart of our COOP program (Cooperative Observer Program). Each site has a 24 hour observation period that ends and begins at 8 am local time. Each site records temperature, precipitation, and snowfall data. More information about the COOP program can be found here www.nws.noaa.gov/om/coop/ Data began being collected at: Cades Cover on 01/01/1999 || Mount LeConte on 07/01/1987 || Newfound Gap on 01/01/1991 || Sugarlands Visitor Center on 12/01/1921

 Current Weather Observations...
Location Time
(EDT)
Weather Vsby.
(SM)
Temp.
(ºF)
Dewpt.
(ºF)
Hum.
(%)
Wind
(mph)
Wind Chill / Heat Index
(ºF)
Pres.
(in)
Abingdon VA16:15Overcast10787178SW 6-30.08
Andrews-Murphy NC15:55Partly Cloudy10877261ESE 393 [HI]30.07
Chattanooga TN15:53Towering Cumulus Clouds Observed10957349WSW 10105 [HI]30.00
Crossville TN15:53Mostly Clear10887157W 994 [HI]30.07
Dalton GA16:15Mostly Clear10907868ESE 8105 [HI]30.01
Knoxville TN (McGhee-Tyson)15:53Cumulonimbus Clouds, Lightning Observed10917355SW 10100 [HI]29.99
Middlesboro KY16:15Lightning Observed10867774CALM98 [HI]30.01
Monroe Cnty TN15:55Mostly Clear10917866VRB 7106 [HI]30.01
Morristown TN16:15Mostly Clear8848088CALM97 [HI]30.02
Oak Ridge TN15:53Clear10957450VRB 3106 [HI]30.01
Tazewell Cnty VA14:55Overcast10747084WSW 5-30.14
Tri-Cities TN15:53Lightning Observed10837269CALM-30.05
Wise VA16:15Rain \ Lightning Observed10777388WSW 6-30.12
Greeneville, TN15:55Mostly Cloudy10847574CALM92 [HI]30.05


Local Weather History For August 13th...
In 2001, heavy rain hit Greene and Cocke Counties. Wet ground aided in $1.1 million flood damage.


Briefing Hydrology Past Weather Events Graphical Hazardous Weather Outlook for East Tennessee East Tennessee Observations
Decision Support Hydrology Past Weather Events GHWO Observations Gridded Forecast
Daily Climate for Middle Tennessee Local East Tennessee Climate Tornado Database Tropical Weather Information NOAA Weather Radio
IDSS Point Forecasts Daily Climate Local Climate Tornado Database Tropical Weather Radio
Daily Climate for Middle Tennessee Probabilistic Data for East Tennessee Virtual Tour of the NWS Morristown Office Skywarn Spotter Training for East Tennessee  
Being Prepared Estar Preparado Probabilistic Virtual Tour Spotter Training