September 2024 Climate Summaries
Mobile Alabama and Pensacola Florida Area
National Weather Service Mobile Alabama
October 1, 2024
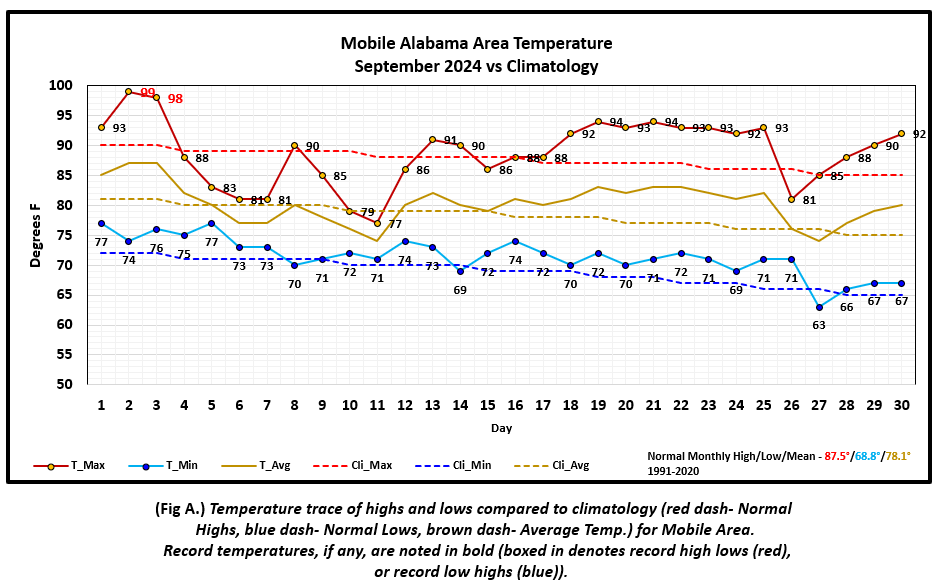
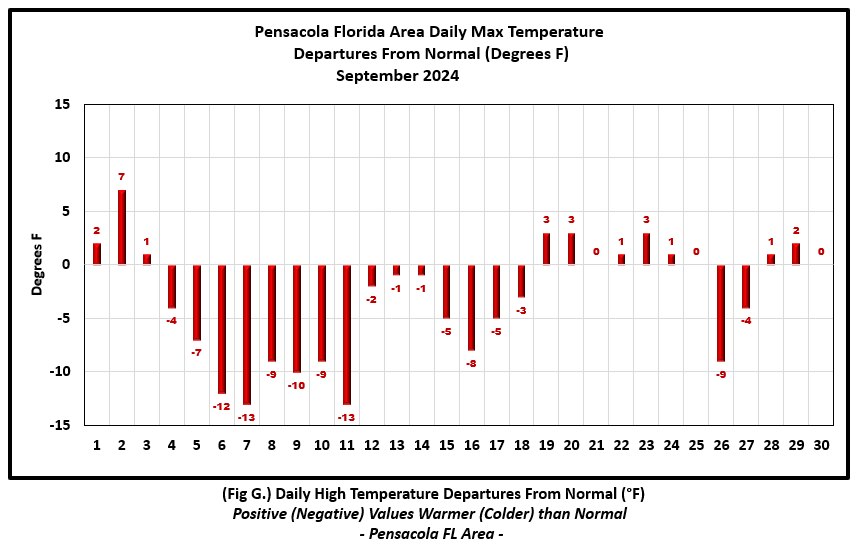
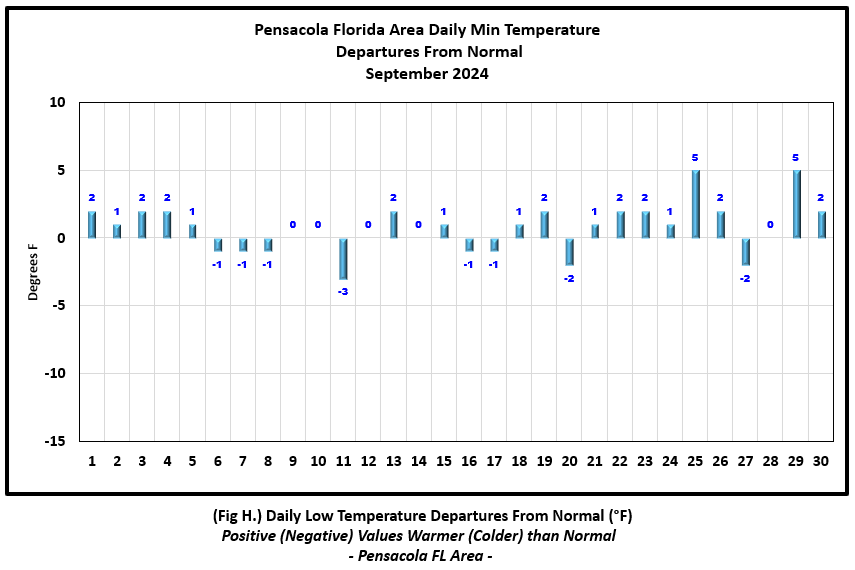
September 2024 in Review - High temperatures throughout the month showed quite a bit more variability about the daily means than shown in the low temperature traces. Opening up the month, the daily high was well above normal at Mobile with numbers flirting with, but just short of the century mark on the 2nd and 3rd which were also record setting days of heat for the month. Following, a more cloudy and unsettled, wet period resulted in daily highs averaging some 7° below normal from the 4th to the 12th, trending back to mostly well above normal the second half of the month. The Mobile area morning lows averaged just shy of 3° above normal but was more steady state about the means. At Pensacola, the hottest day and well above normal for early September was the 2nd at a toasty 97°. This day was followed by a similar pattern as that of the Mobile area, but seeing a much cooler and a more substantial below normal trend in highs from a lengthy period of clouds and wet weather. Highs averaged 14.5° below normal for the period from the 4th to the 18th and then at or a few degrees above normal for much of the remainder of the month. The cooler portion of the month contributed to the average high being a few degrees cooler than normal. No record temperatures were set at Pensacola. The Pensacola area morning lows averaged just shy of 1° above normal and was also found to be more steady state about the means with a gradual lowering throughout the month.
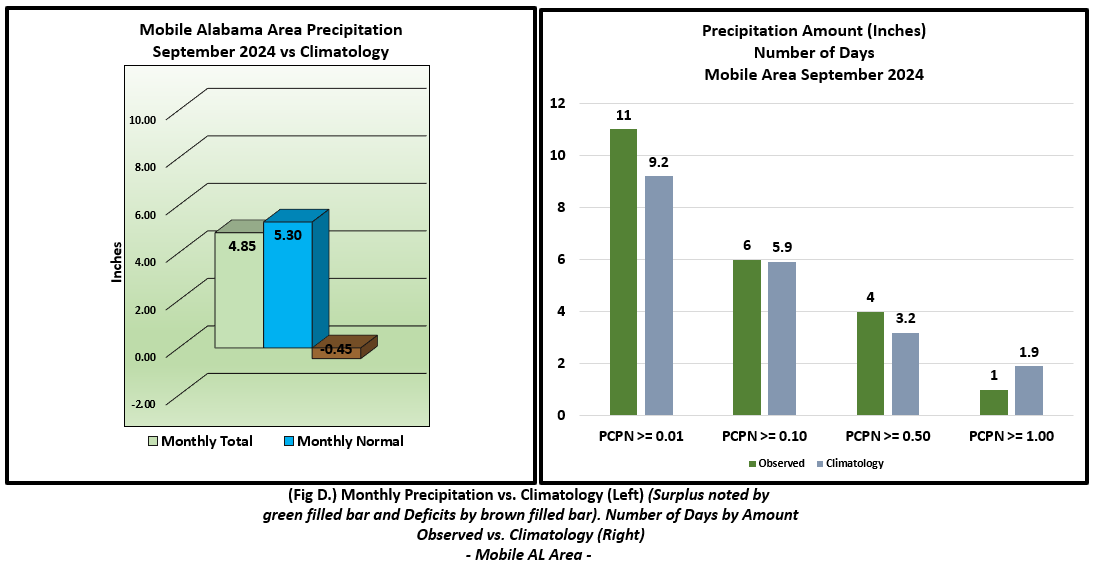
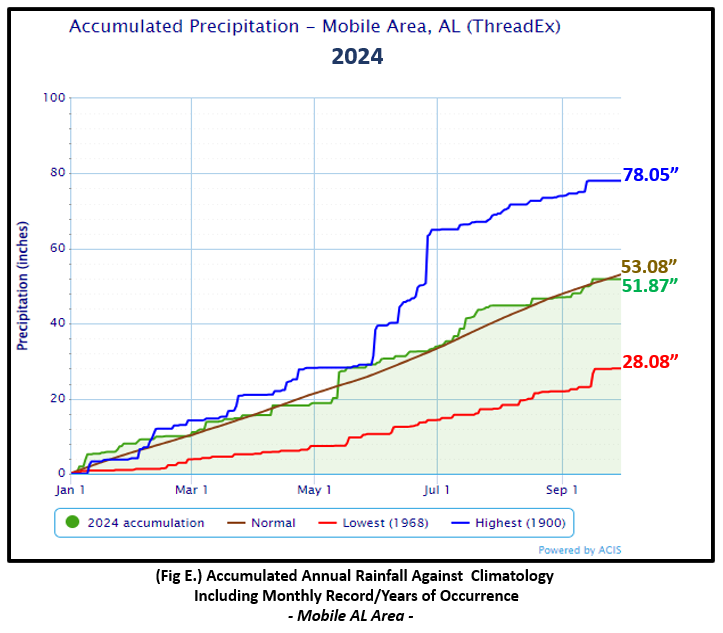
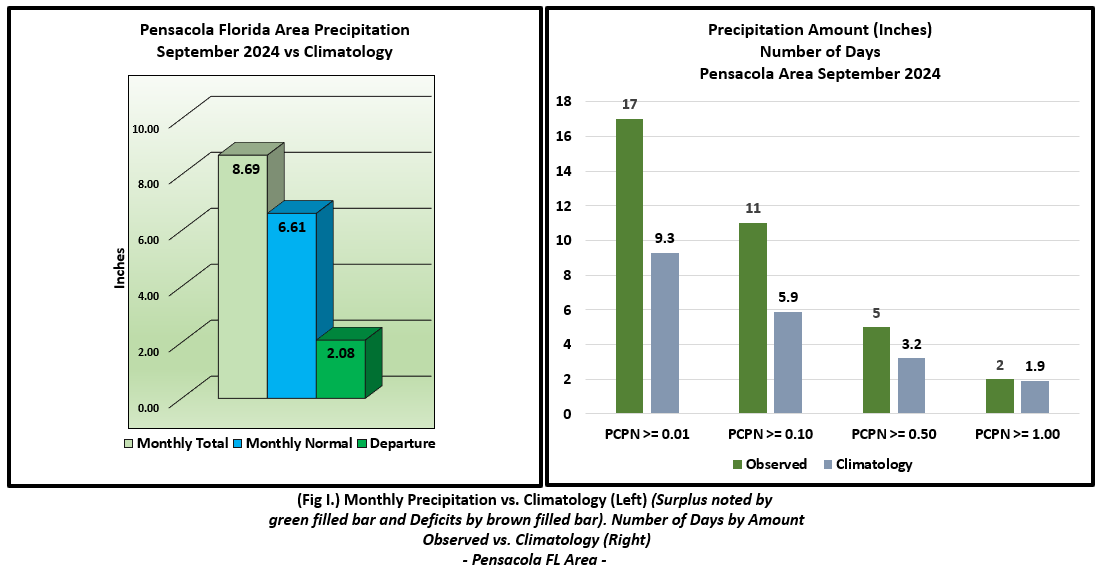
The rain gauge at Mobile collected just shy of 5" for the month falling short of normal by near a half inch. Hurricane Francine coming ashore along the southeast coast of Louisiana late Wednesday September 11th and lifting northward over southwest Mississippi Thursday September 12th did not produce much in the way of storm total rainfall for Mobile. The greater amount actually occurred over Pensacola when 2.90" or 33% of the monthly rainfall total that way fell in the two day span. Pensacola's rain gauge caught well over 8" for the month, slightly over 2" above the monthly normal. To close out the month, Major Hurricane Helene's axis of heavier rainfall was well off to the east of Mobile and Pensacola.
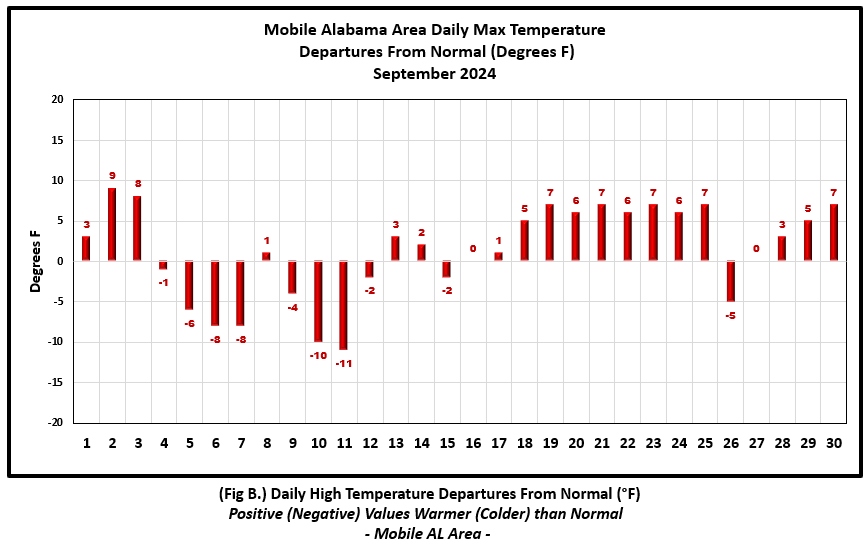
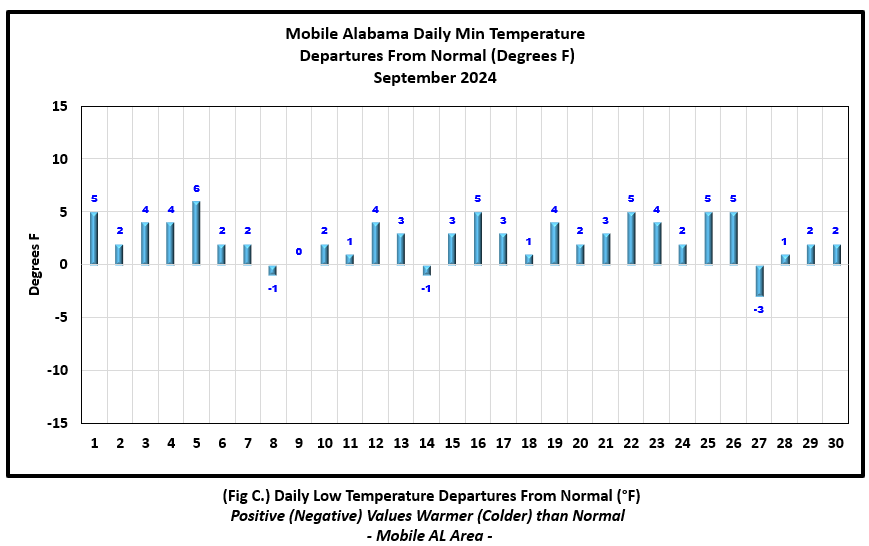
Mobile Alabama Area [Climate Normal Period 1991-2020, Climate Record Period 1872 to Present]- The average monthly high of 88.8° was 1.3° above normal. The average monthly low was 71.4° or 2.6° above normal. The average monthly temperature of 80.1° was 2.0° above normal. There were two record highs. The highest temperature for the month was 99° on the 2nd or 9° above the normal for the date. This also set a new record high, surpassing the previous record of 98° set on this date in 1989 and 1964. The other record high occurred on the 3rd at 98°, which broke the previous record on this date of 97° set in 1944. The lowest temperature for the month was a cool 63° on the 27th, 3.0° below normal for this date. (Fig. A) shows a graphical representation of how the Mobile area temperatures compared to the seasonal normal daily highs and lows, which are shown by the colored dashed lines. Bar graphs reflecting the daily high/low temperature departures from normal are provided in the table below (Figs. B and C). The rain gauge measured 4.85" (Fig. D), 0.45" below the monthly normal. Annual rainfall deficits are a little over an inch at 1.21" (Fig. E).
September top records for the month during the Period of Record for the Mobile Area:
Click on the Mobile Alabama area climate graphics below to expand:
|
|
|
|
|
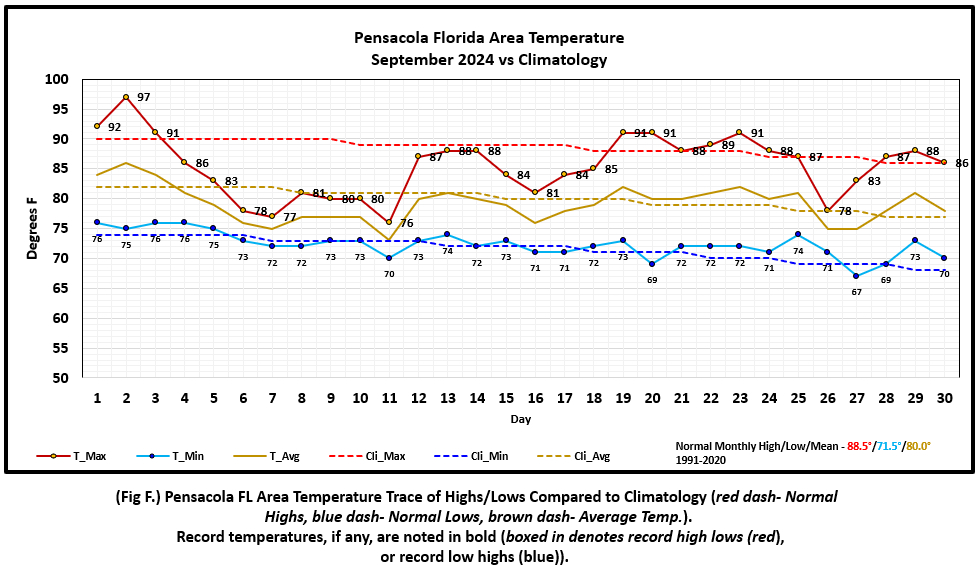
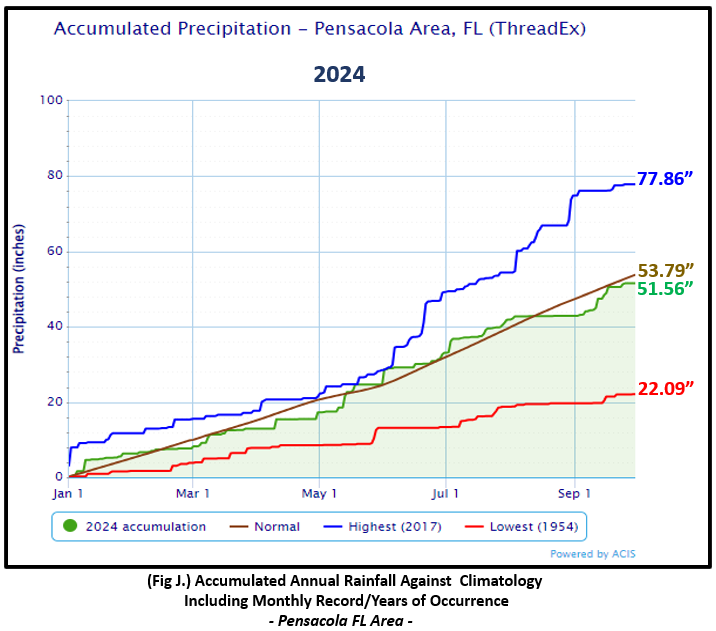
Pensacola Florida Area [Climate Normal Period 1991-2020, Climate Record Period 1879 to Present] - The average monthly high of 85.5° was 3.0° below normal. The average monthly low was 72.3° or 0.8° above normal. The average monthly temperature of 78.9° was 1.1° below normal. The highest temperature for the month, 97° on the 2nd, was 7° above the normal daily high temperature for the date. The lowest temperature for the month, 67° on the 27th, was 2° below the normal daily low temperature for this date. No record temperatures were set at Pensacola. (Fig. F) shows a graphical representation of how the Pensacola area temperatures compared to the seasonal normal daily highs and lows, which are shown by the colored dashed lines. (Figs. G and H) shows the daily high/low temperature departures from normal. Pensacola saw a surplus in monthly rains with a gauge catch at 8.69" (Fig. I), 2.08" above the monthly normal. Annual rainfall deficits are a little over two inches at 2.23" (Fig. J).
September top records for the month during the Period of Record for the Pensacola Area:
Click on the Pensacola Florida area climate graphics below to expand:
|
|
|
|
|
Additional September 2024 Climatology and Topics
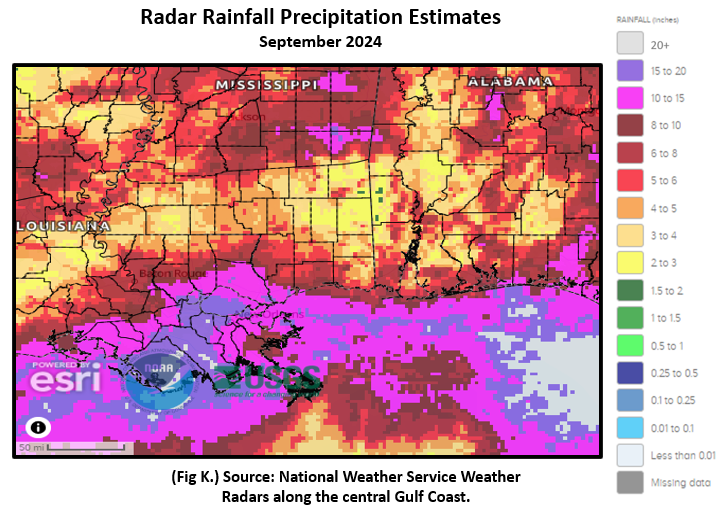
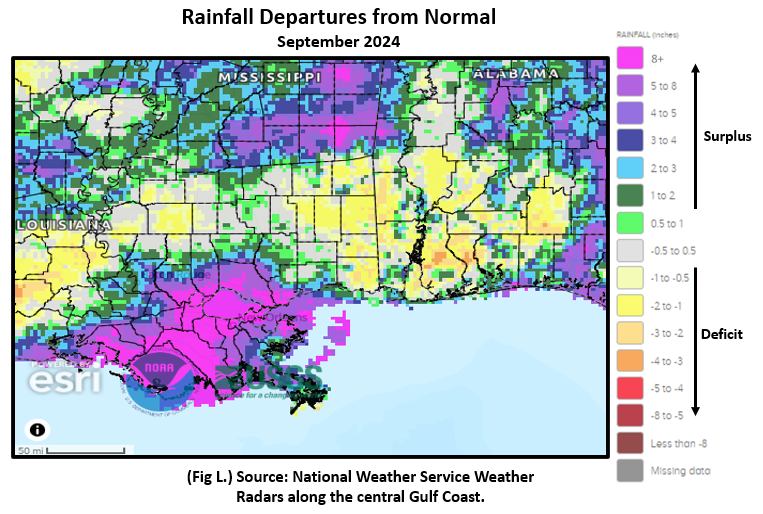
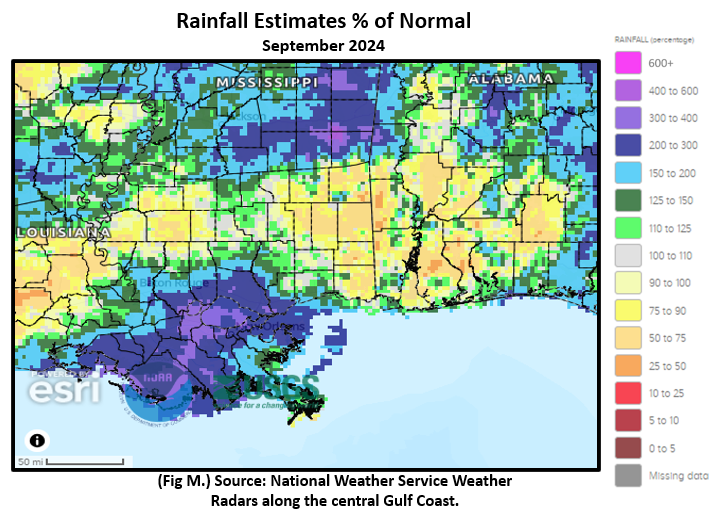
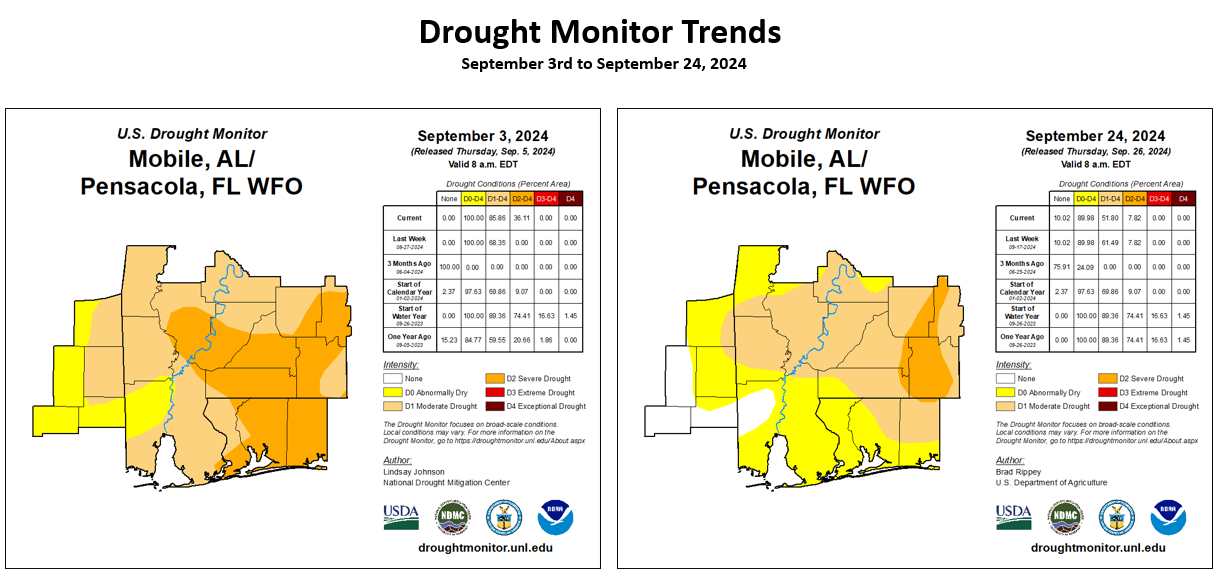
The heavier rainfall footprints for the month were most notable from southeast Louisiana with Hurricane Francine, eastward to over the Alabama and western Florida coastal waters, to the Florida Big Bend in association with Major Hurricane Helene. The coastal areas also saw the better focus of heavier rains with a small portion of southeast Santa Rosa to southwest Okaloosa Co. Florida seeing upwards of 10 to 20" of excessive rainfall. Even so, above normal monthly rainfall was spotty. (Fig. K) shows the areal distribution of monthly rainfall, (Fig. L) shows the areal rainfall departures from normal and (Fig. M) percent of normal rains. We entered the month of September with moderate to severe drought having a firm grip over much of the local area, but ended the month with drought conditions improving from west to east (Fig. N).
The latest September 2024 Monthly Climate Summary for Eglin Air Force Base (KVPS) and Duke Field (KEGI) has been provided courtesy of Mr. David Biggar, Staff Meteorologist, 96th Weather Squadron. Provided by permission.
|
|
|
|
October 2024 Climatology, Seasonal Climatology and Outlooks:
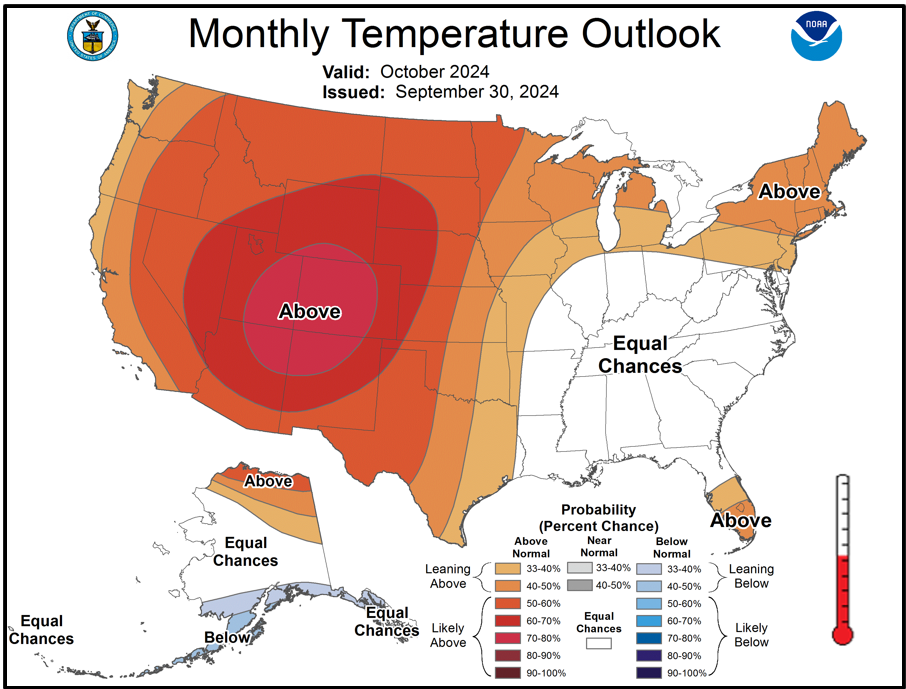
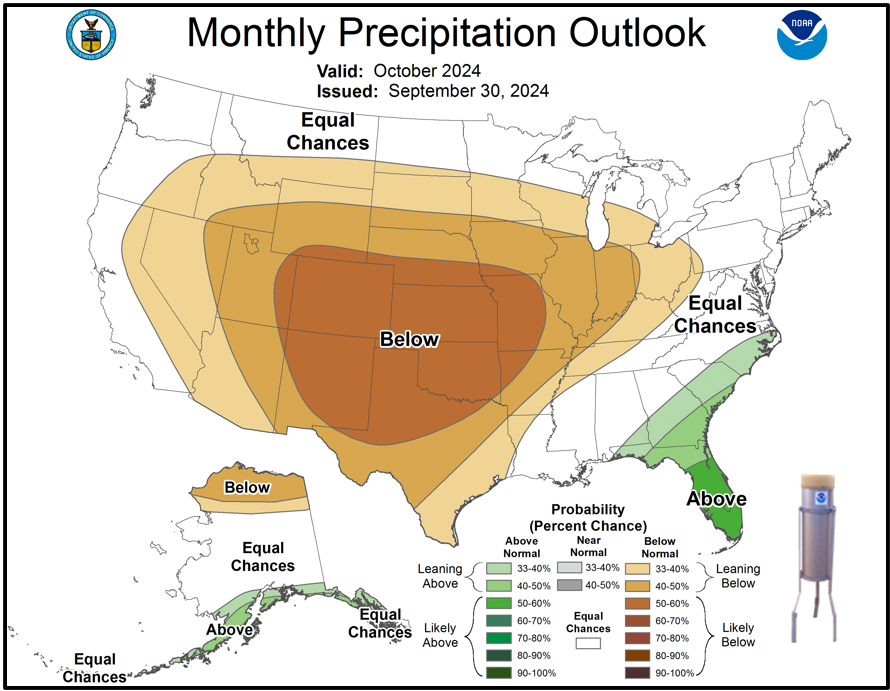
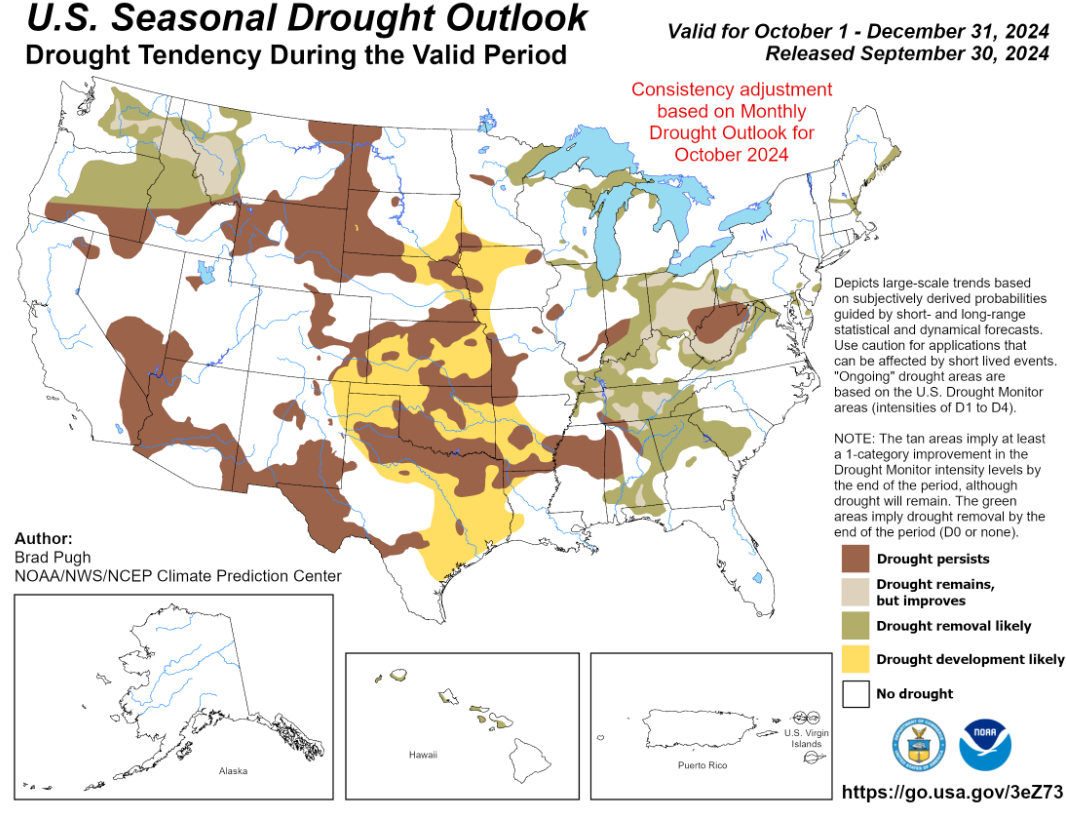
Looking ahead to October, there appears to be equal chances of above or below normal temperatures over the lower to mid Mississippi River Valley, and east to the Mid-Atlantic into northern Florida. The southeast US is favored to see precipitation leaning above normal with likely above normal extending south across the Florida Peninsula. Drought, at least in the shorter term, may maintain its grip into the month of October, but there are indications of improvement in Seasonal Drought Outlook. For more detailed information on weekly drought and outlooks, see the latest drought statements. Although we have moved out of the climatological peak of hurricane season, take note that October does see a climatological spike in tropical cyclone occurrences with the points of origin typically from the northwest Caribbean, Gulf and off the southeast US coast.
Click on the snap shots below to expand:
 October Normals October Normals |
|
Outlook |
Outlook |

|

|

|

|

|
Additional Climate Links:
The National Weather Service Mobile Alabama's Climate and Past Weather page provides climate data at your fingertips for many observation points in the local forecast area by accessing the NOWData tab as well as many other climate resources. The Climate Prediction Center Link provides short and longer range climatic outlooks and education about the larger scale global circulations that impact temperatures and weather. With the large agriculture and farming presence along the central Gulf coast, the Drought Monitor link provides updates on drought trends and impacts. Another very helpful resource is the Community Collaborative Rain Hail and Snow (CoCoRaHS) network, which is a large group of volunteers working together to measure and map precipitation (rain, hail and snow). The aim of CoCoRaHS is to provide the highest quality data for natural resource, education and research applications. You can be a part of the CoCoRaHS team by becoming a volunteer rainfall observer.