September 2020 Climate Summaries
Mobile Alabama and Pensacola Florida Area
Joe Maniscalco - Observation Program Leader (OPL)/Meteorologist
POC for Observation, Climate, and COOP
National Weather Service Mobile Alabama
October 2, 2020
September 2020 in Review - High temperatures were above normal by a nearly steady state for the first couple weeks of the month. Thereafter, a substantial lowering trend in highs occurred between the 14th and 22nd. In fact, during this period, there were a few days that highs dipped to 14 to 19 degrees below normal which included a few record low high temperatures. Night-time lows saw a couple of dips to below normal the end the month. The most notable was the last two days of the month when a strong cold front brought a substantial cooling trend with lows sinking to some 10 to 15 degrees below normal. All in all, average temperatures were not too far off seasonal normal. Rainfall was the highlight for this month. With Hurricane Sally making landfall over Gulf Shores Alabama at 445 AM Wednesday morning the 16th, the heaviest event total rains (around 30") or nearly a half of the annual rainfall occurred over just a few days for some areas near where Sally's center made landfall. To the east of the landfall location, Pensacola saw just shy of 17" for storm total rainfall. A new top monthly one day record rainfall, just shy of 12", occurred at Pensacola on the 16th alone. With the help of Sally's excessive rainfall, Pensacola has surpassed its annual rainfall average with three more months to go to conclude 2020.
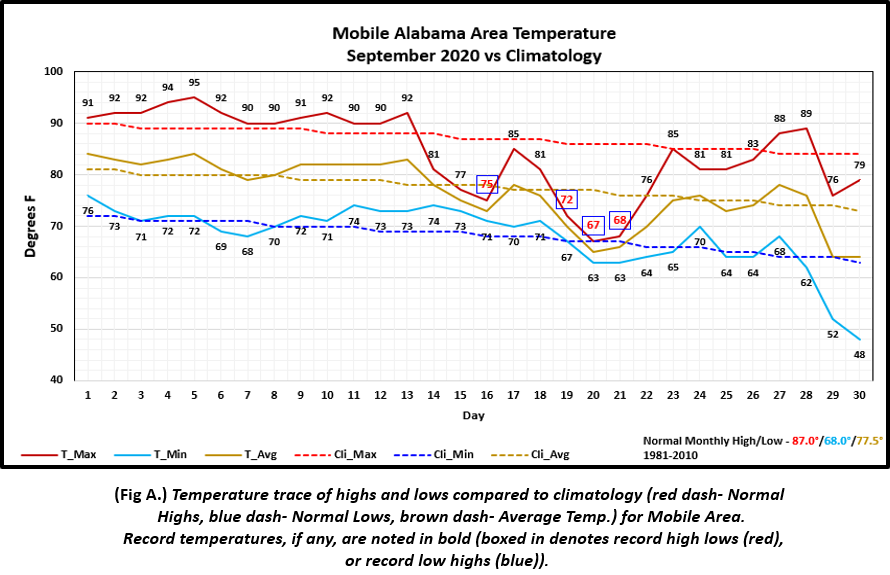
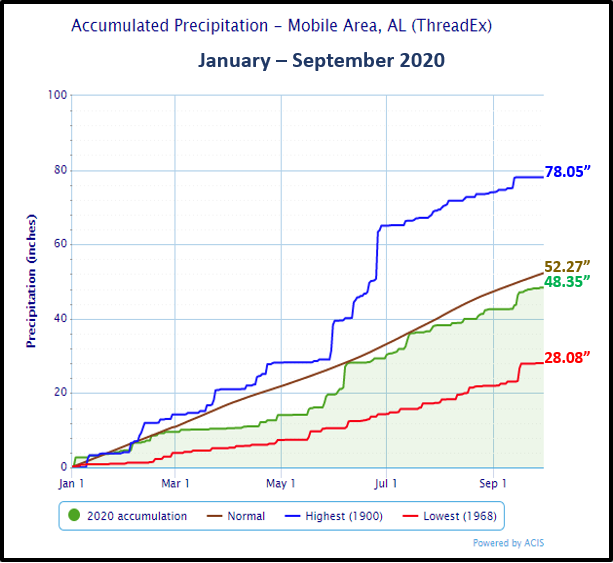
Mobile Alabama Area [Climate Normal Period 1981-2010, Climate Record Period 1872 to Present]- The average monthly high of 84.5° was 2.5° below normal. The average monthly low was 68.1° or 0.1° above normal. The average monthly temperature of 76.3° was 1.2° below normal. The highest temperature for the month, 95°, occurred on the 5th. The lowest temperature of 48° occurred on the 30th. Four record low high temperatures occurred. 75° on the 16th tied the previous record on this date back in 1954, 72° on the 19th broke the previous record of 74° set on this date back in 1981, 67° on the 20th broke the previous record of 69° set on this date way back in 1887, and 68° on the 21st broke the previous record of 71° set on this date back in 1918. (Fig. A) shows a graphical representation of how the Mobile area temperatures compared to the seasonal normal monthly highs and lows, which are shown by the colored dashed lines. Total rainfall for September (Fig. B) measured 5.77" or just 0.66" above normal. A precipitation trace for the Mobile area since January 1st is provided in the graphics below showing how it compares to normal year to date totals. With Sally coming ashore over southern Baldwin county, rainfall for the Mobile area was not as excessive. The overall yearly deficit continues by a few inches. Annual rainfall, at 48.35", is 3.92" below normal.
September top records for the month during the Period of Record for the Mobile Area:
Click on the Mobile Alabama area climate graphics below to expand:
|

|
|
Pensacola Florida Area [Climate Normal Period 1981-2010, Climate Record Period 1879 to Present] - The average monthly high of 85.7° was 0.8° below normal. The average monthly low of 71.9° was 1.6° above normal. The average monthly temperature of 78.8° was 0.4° above normal. The highest temperature for the month was 98°, occurring on the 5th. The lowest temperature for the month was 52°, occurring on the 30th. Two record low high temperatures occurred. 77° on the 15th tied the previous record on this date back in 1945, 69° on the 20th smashed the previous record of 76° set on this date back in 1929. (Fig. C) shows a graphical representation of how the Pensacola area temperatures compared to the seasonal normal monthly highs and lows, which are shown by the colored dashed lines. Total rainfall for September was record setting at Pensacola, thanks to the approach and passage of Hurricane Sally which was a slow mover. (Fig. D) shows the total monthly rain added up to 18.51". This was nearly a half foot above normal at 5.98". 11.85" of this amount, falling on the 16th, became both a new one day and new top monthly one day record rainfall for the period of record. The previous record of 11.68", stood for 64 years before being broken September 16th 2020. An annual precipitation graph for the Pensacola area is provided in the graphics below showing how it compares to normal year to date totals. Sally's excessive rainfall has built the annual rainfall collection to 64.51" thus far for the Pensacola area which surpasses the annual normal by 2.96".
September top records for the month during the Period of Record for the Pensacola Area:
Click on the Pensacola Florida area climate graphics below to expand:

|

|

|
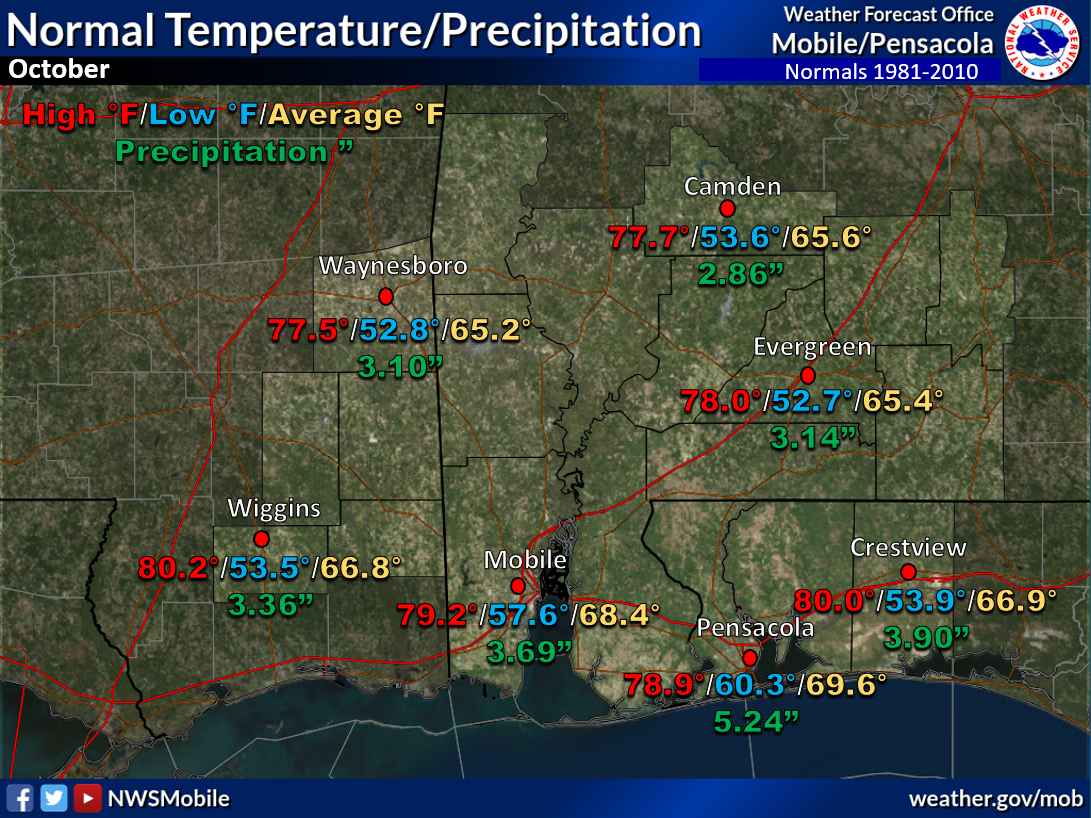
October Climatology and Outlooks:
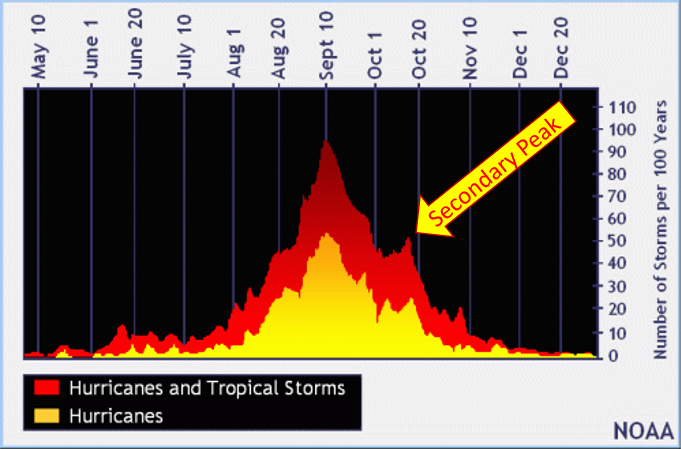
The long range weather pattern favors below normal temperatures over the deep south and southeast US during the month of October. A narrow zone where equal chances of above/below normal precipitation is outlooked from southern Louisiana to across the southeast US. Although we are on the back edge of the climatological peak of the Atlantic Basin Hurricane Season, climatology shows that October sees a secondary spike in tropical cyclone occurrence. Favored tropical cyclone origin is typically from the northwest Caribbean, Gulf of America to the western Atlantic as we move into the month of October.
Click on the snap shots below to expand:
|

Outlook |

Outlook |

|
|

|
Climate Prediction Center's Interactive Long Range Outlooks
Additional Climate Links:
The links below are intended to provide additional climate information, education and outlooks. The National Weather Service Mobile Alabama's Climate and Past Weather page provides climate data at your fingertips for many observation points in the local forecast area by accessing the NOWData tab as well as many other climate resources. The Climate Prediction Center Link provides short and longer range climatic outlooks and education about the larger scale global circulations that impact temperatures and weather. With the large agriculture and farming presence along the central Gulf coast, the Drought Monitor link provides updates on drought trends and impacts. Another very helpful resource is the Community Collaborative Rain Hail and Snow (CoCoRaHS) network, which is a large group of volunteers working together to measure and map precipitation (rain, hail and snow). The aim of CoCoRaHS is to provide the highest quality data for natural resource, education and research applications. You can be a part of the CoCoRaHS team by becoming a volunteer rainfall observer. To learn more click on the CoCoRaHS link below.
National Weather Service Mobile AL Climate and Past Weather
Climate Prediction Center (CPC)
CoCoRaHS Network Water Year Summaries
Questions or Comments:
Contact: Joe Maniscalco, WFO Mobile, AL at joe.maniscalco@noaa.gov


