September 2018 Graphical Climate Summaries
Mobile Alabama and Pensacola Florida Area
National Weather Service Mobile Alabama
October 4, 2018
September 2018 in Review - It was an unseasonably warm month for the central Gulf coast where the average monthly temperature broke into the top 5 warmest Septembers on record at Mobile and into the top 10 warmest at Pensacola. One record high was reached at both Mobile and Pensacola. Tropical Storm Gordon made landfall just west of the Alabama/Mississippi Gulf Coast border late Tuesday night September 4th. Spiral rain-bands from Gordon resulted in a repeated occurrence of heavy rain on both the 4th and 5th with both days seeing a new daily rainfall record at Pensacola. Gordon's rains contributed greatly to lifting Pensacola into the top 5 wettest Septembers on record. Although Gordon's center was closer to Mobile, rains associated with the storm moved quickly through, resulting in a limited duration of heavier rains there. Mobile saw monthly rain that was closer to normal.
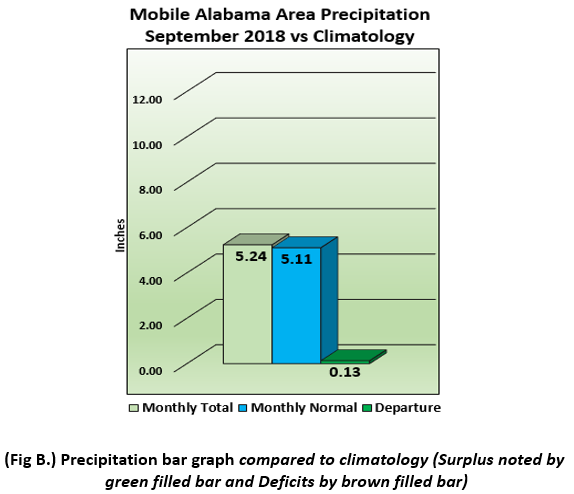
Mobile Alabama Area - The average monthly high was 90.6° or 3.6° above normal. The average monthly low was 73.8° or 5.8° above normal. The average monthly temperature was 82.2° or 4.7° above normal, also places 4th warmest on the period of record dating back to 1872. A record high of 96° occurred on the 18th. This tied the previous record which occurred back in 2005. (Fig. A) shows how temperatures compared to the seasonal normal monthly highs and lows, which are shown by the colored dashed lines. September rainfall measured 5.24" or 0.13" above normal (Fig. B). The total rainfall year to date now stands at 45.62" or 6.65" below normal.
Click on the Mobile Alabama area climate graphics below to expand:

|
|

Against Climatology |
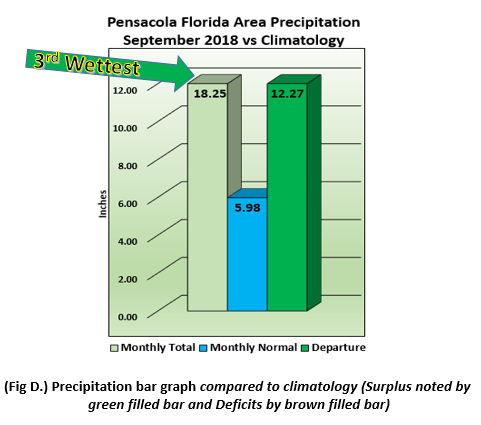
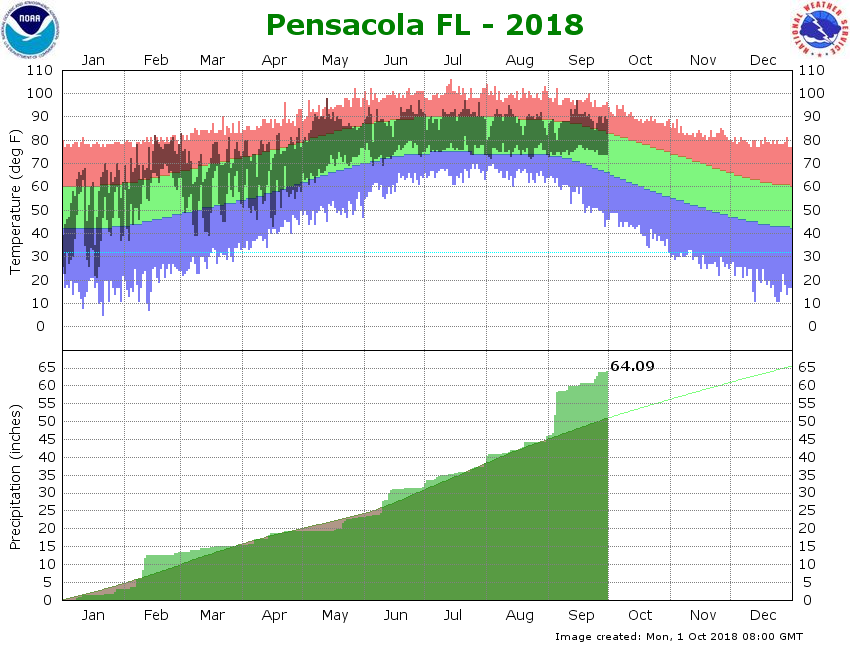
Pensacola Florida Area - The average monthly high was 88.8° or 2.3° above normal. The average monthly low was 75.3° or 5.0° above normal. The average monthly temperature was 82.1° or 3.7° above normal, which places 6th warmest on the period of record dating back to 1879. A record high of 97° occurred on the 15th. This surpassed the old record of 95° which occurred back in 1991. (Fig. C) shows how temperatures compared to the seasonal normal monthly highs and lows, which are shown by the colored dashed lines. With the help of Tropical Storm Gordon, September rainfall measured a whopping 18.25" or over a foot, 12.27" above normal, also making September 2018 the 3rd wettest on record. (Fig. D). During approach and following landfall of Tropical Storm Gordon over the central Gulf coast, record one day total rainfall was observed. 5.06" on the 4th and 6.40" on the 5th. The year to date total rainfall now stands at 64.09" or well over a foot, 13.34" above normal.
Click on the Pensacola Florida area climate graphics below to expand:

|
|
Against Climatology |
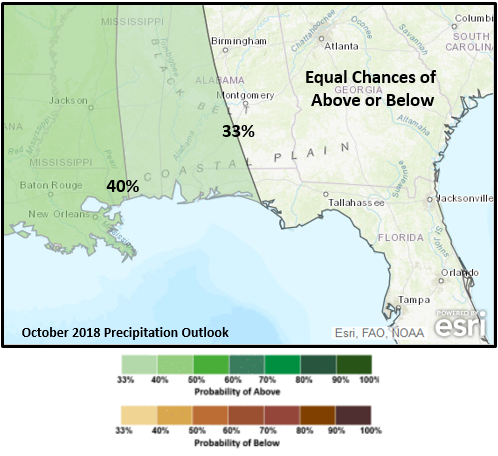
October:
Click on the snap shots below to expand:

|

Outlook |
Outlook |

Outlook |

Information |
Climate Prediction Center's Interactive Long Range Outlooks
Additional Climate Links:
The links below are intended to provide additional climate information, education and outlooks. The National Weather Service Mobile Alabama's Climate and Past Weather page provides climate data at your fingertips for many observation points in the local forecast area by accessing the NOWData tab as well as many other climate resources. The Climate Prediction Center Link provides short and longer range climatic outlooks and education about the larger scale global circulations that impact temperatures and weather. With the large agriculture and farming presence along the central Gulf coast, the Drought Monitor link provides updates on drought trends and impacts. Another very helpful resource is the Community Collaborative Rain Hail and Snow (CoCoRaHS) network, which is a large group of volunteers working together to measure and map precipitation (rain, hail and snow). The aim of CoCoRaHS is to provide the highest quality data for natural resource, education and research applications. You can be a part of the CoCoRaHS team by becoming a volunteer rainfall observer. To learn more click on the CoCoRaHS link below.
National Weather Service Mobile AL Climate and Past Weather
Climate Prediction Center (CPC)
CoCoRaHS Network Water Year Summaries


