October 2020 Climate Summaries
Mobile Alabama and Pensacola Florida Area
National Weather Service Mobile Alabama
November 2, 2020
October 2020 in Review - Opening up and closing out the month, temperatures were well below normal, bounded by a lengthy period of temperatures mostly well above normal where daily highs averaged 4 to 5 degrees above normal. The same can be said for lows with the most notable warm trend occurring between the 6th and 28th where lows averaged between 8 and 9 degrees above normal which is very uncharacteristic for October. Monthly temperatures averaged between 1 and 3 degrees above normal for the Mobile area and 3 to 5 degrees above normal for the Pensacola area. The Mobile area broke one record high low temperature this month, while the Pensacola area tied one record high and also broke a record high low temperature. Another tropical system brought impacts to the Gulf coast late in the month and this was Hurricane Zeta which made landfall over southeast Louisiana late in the afternoon on Wednesday the 28th before lifting rapidly northeast across interior southeast Mississippi and southwest AL that evening. The heaviest rains associated with Zeta occurred west of the Mobile area. The Mobile and Pensacola area saw monthly rainfall just shy of normal.
Mobile Alabama Area [Climate Normal Period 1981-2010, Climate Record Period 1872 to Present]- The average monthly high of 80.7° was 1.5° above normal. The average monthly low was 60.8° or 3.2° above normal. The average monthly temperature of 70.8° was 2.4° above normal. The highest temperature for the month, 90°, occurred on the 7th. Halloween morning saw the lowest temperature for the month, a freakishly cool 44°. A record high low temperature of 74° on the 28th broke the previous record of 71° on this date set way back in 1881. (Fig. A) shows a graphical representation of how the Mobile area temperatures compared to the seasonal normal monthly highs and lows, which are shown by the colored dashed lines. Total rainfall for October (Fig. B) measured 3.54", just shy of the normal by 0.15". A precipitation trace for the Mobile area since January 1st is provided in the graphics below showing how it compares to normal year to date totals. The Mobile area has observed 51.89" of rain which continues as an annual deficit by a little over 4".
October top records for the month during the Period of Record for the Mobile Area:
Click on the Mobile Alabama area climate graphics below to expand:

|

|

|
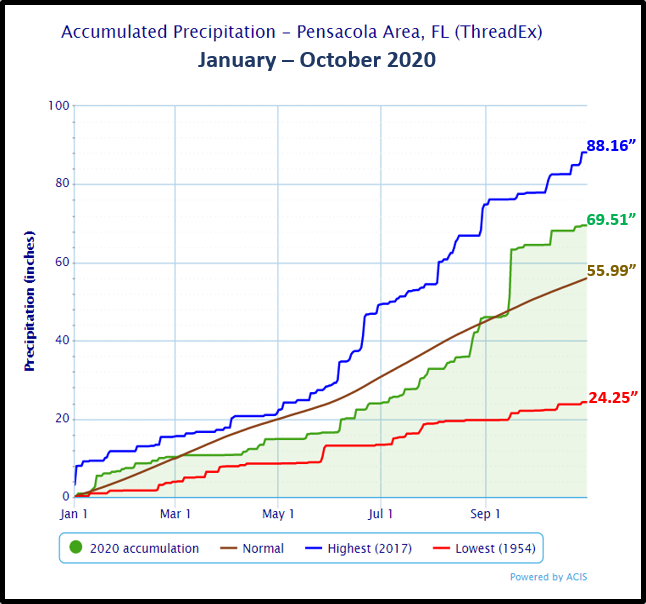
Pensacola Florida Area [Climate Normal Period 1981-2010, Climate Record Period 1879 to Present] - The average monthly high of 82.1° was 3.2° above normal. The average monthly low of 65.5° was 5.2° above normal. The average monthly temperature of 73.8° was 4.2° above normal. The highest temperature for the month was 91°, occurring on the 12th. The lowest temperature for the month was 50°, occurring on the 30th. Two record temperatures were set. A record high temperature of 90° on the 13th tied the previous record occurring on this date back in 2017. A record high low temperature of 78° on the 28th broke the previous record of 75° set on this date back in 1984. (Fig. C) shows a graphical representation of how the Pensacola area temperatures compared to the seasonal normal monthly highs and lows, which are shown by the colored dashed lines. 5.00" even of total rainfall was measured at Pensacola which was shy of normal by nearly a quarter inch. An annual precipitation graph for the Pensacola area is provided in the graphics below showing how it compares to normal year to date totals. We are now closing in on 70 inches for annual rainfall.
October top records for the month during the Period of Record for the Pensacola Area:
Click on the Pensacola Florida area climate graphics below to expand:

|

|
|
November Climatology and Outlooks:
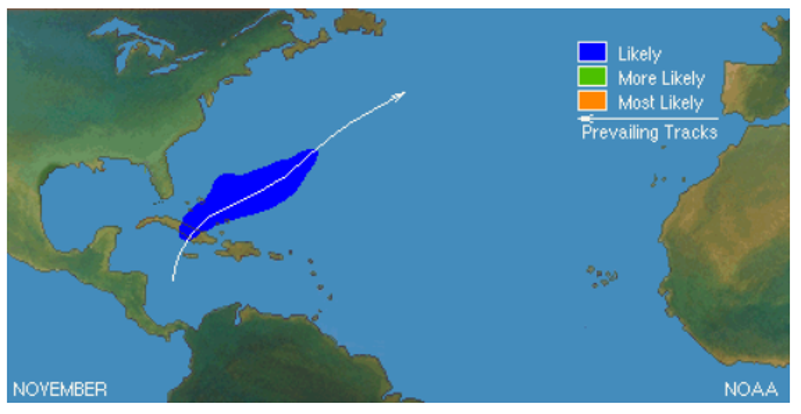
The long range weather pattern favors above normal temperatures and precipitation over the deep south during the month of October. Although we are entering the final month of the climatological Atlantic Basin tropical season, this year has proven all to well we are going to have to remain vigilant. The season has been an anomaly and relentless in the number of named storms, many of which have impacted the US coast. As we move deeper into fall, a graphic has been added below showing average first freeze dates and record earliest date of occurrence across several sites over the region.
Click on the snap shots below to expand:
|

Outlook |

Outlook |

|
|

|
Climate Prediction Center's Interactive Long Range Outlooks
Additional Climate Links:
The links below are intended to provide additional climate information, education and outlooks. The National Weather Service Mobile Alabama's Climate and Past Weather page provides climate data at your fingertips for many observation points in the local forecast area by accessing the NOWData tab as well as many other climate resources. The Climate Prediction Center Link provides short and longer range climatic outlooks and education about the larger scale global circulations that impact temperatures and weather. With the large agriculture and farming presence along the central Gulf coast, the Drought Monitor link provides updates on drought trends and impacts. Another very helpful resource is the Community Collaborative Rain Hail and Snow (CoCoRaHS) network, which is a large group of volunteers working together to measure and map precipitation (rain, hail and snow). The aim of CoCoRaHS is to provide the highest quality data for natural resource, education and research applications. You can be a part of the CoCoRaHS team by becoming a volunteer rainfall observer. To learn more click on the CoCoRaHS link below.
National Weather Service Mobile AL Climate and Past Weather
Climate Prediction Center (CPC)
CoCoRaHS Network Water Year Summaries


