November 2021 Climate Summaries
Mobile Alabama and Pensacola Florida Area
National Weather Service Mobile Alabama
December 3, 2021
November 2021 in Review - Although temperatures oscillated between below and above normal several times during the month, the temperature trace began a downward trend as we begin the cold season. Temperatures averaged nearly two degrees below normal. Individually, overnight lows in Mobile averaged roughly two times more below normal than Pensacola while daytime highs averaged near a degree below normal at both Mobile and Pensacola. There was one record high tied at Pensacola. No record temperatures were reached at Mobile.
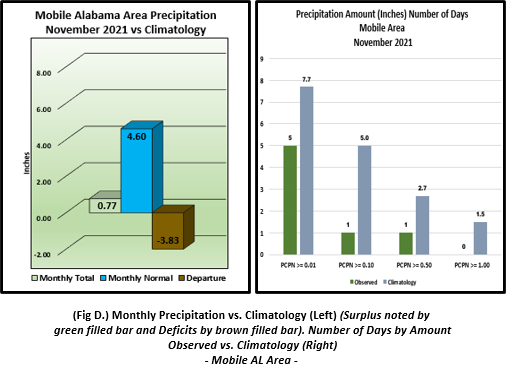
Rainfall continues to make weather headlines, with this month on the flip side than mentioned over the past few months. Rainfall was poorly lacking with abnormal dryness returning to the central Gulf coast. After a substantial surplus of rain the past several months, the rain gauge at Mobile and Pensacola has been short of normal rainfall by nearly four inches for the month of November. Both sites failed to received an inch of rain for the month which is unusually dry by Gulf coast standards. In fact, November 2021 rainfall or lack thereof at Pensacola broke into the top five driest Novembers on record.
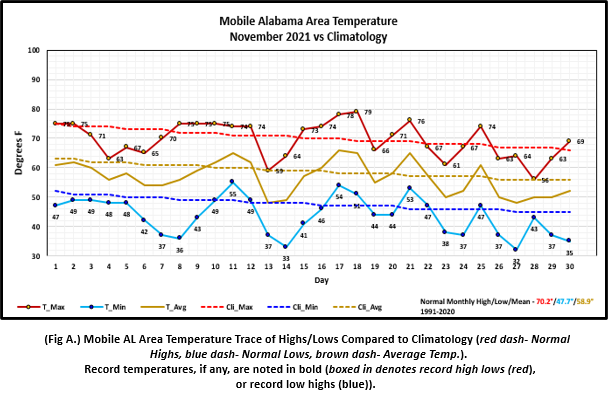
Mobile Alabama Area [Climate Normal Period 1991-2020, Climate Record Period 1872 to Present]- The average monthly high of 69.4° was 0.8° below normal. The average monthly low was 43.6° or 4.1° below normal. The average monthly temperature of 56.5° was 2.4° below normal. The highest temperature for the month, 79°, occurred on the 18th, 10° above the normal for the date. The lowest temperature for the month plunged to 32° on the morning of the 27th, 13° below normal for this date. No record temperatures were reached. (Fig. A) shows a graphical representation of how the Mobile area temperatures compared to the seasonal normal daily highs and lows, which are shown by the colored dashed lines. Bar graphs reflecting the daily high/low temperature departures from normal are provided in the table below (Figs. B and C). The rain gauge collected a meager 0.77" (Fig. D), or 3.83" below normal. Although a dry spell, the surplus in annual rainfall remains significant due to excessive rainfall events from prior months. Annual total of 78.23" is just shy of 17" above normal to date. (Fig. E).
November Top Records for the Month During the Period of Record for the Mobile Area:
Click on the Mobile Alabama area climate graphics below to expand:
|

|

|
|

|
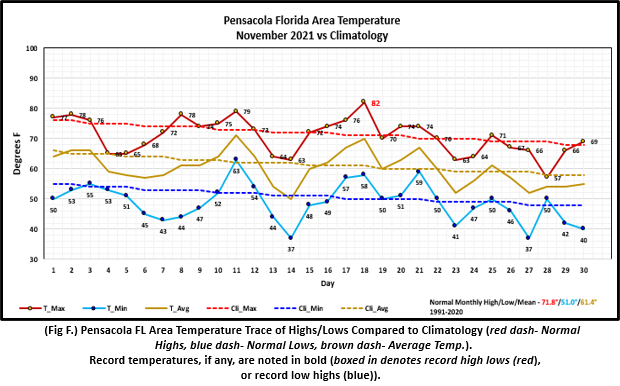
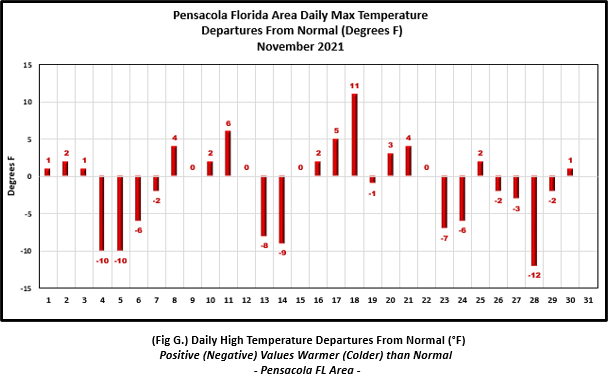
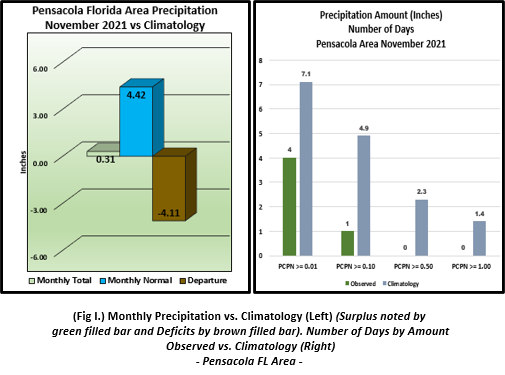
Pensacola Florida Area [Climate Normal Period 1991-2020, Climate Record Period 1879 to Present] - The average monthly high of 70.7° was 1.1° below normal. The average monthly low was 48.9° or 2.1° below normal. The average monthly temperature of 59.8° was 1.6° below normal. The highest temperature for the month, 82° on the 18th was 11° above the normal daily high temperature for this date and also tied the previous record high on this date occurring in 1958. The lowest temperature for the month, 37° on the 27th, was 11° below the normal daily low temperature for this date. (Fig. F) shows a graphical representation of how the Pensacola area temperatures compared to the seasonal normal daily highs and lows, which are shown by the colored dashed lines. (Figs. G and H) shows the daily high/low temperature departures from normal. Compared to Mobile, the rain gauge was even drier, only recording just shy of a third of an inch of rain, 0.31" (Fig. I), 4.11" below the monthly normal. Pensacola's total rainfall or lack thereof this month broke into the top five driest November's on record with 2021 being the 4th driest. Although a substantial dry spell, the surplus in annual rainfall remains significant due to excessive rainfall events from prior months. Annual total of 86.65" is just shy of 24" above normal to date (Fig. J).
November Top Records for the Month During the Period of Record for the Pensacola Area:
Click on the Pensacola Florida area climate graphics below to expand:
|
|

|
|

|
Additional November 2021 Climatology and Topics
The latest November 2021 monthly summary for Eglin Air Force Base (AFB) - KVPS and Duke Field - KEGI has been received and provided in the table below. The temperatures in the daily tables consists of numbers both in °F/°C. Data courtesy of Mr. David Biggar, Staff Meteorologist, 96th Weather Squadron. Provided by permission.

|

|

|
December 2021 Climatology, Seasonal Climatology and Outlooks:
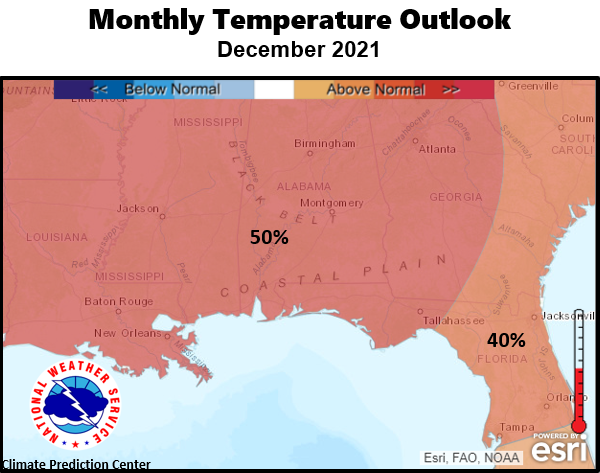
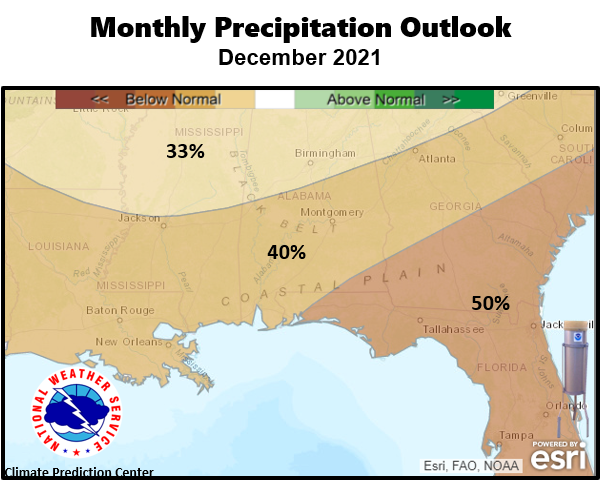
The latest outlook for December presents a pattern favoring temperatures to be likely above normal and precipitation leaning below normal as we close the year 2021. With the lack of rainfall during the month of November over the coastal Plain, pockets of abnormal dryness have materialized along the US Highway 84 corridor. Refer to the Drought Information link below for further information. With the current long range outlook favoring below normal precipitation, forecasters will monitor for drought development over the deep south. The 2021 Atlantic basin hurricane season concluded as the third most active year on record in terms of named storms. It marks the sixth consecutive above-normal Atlantic hurricane season; this was also the first time on record that two consecutive hurricane seasons used up the list of 21 storm names. Refer to the link in the table below to see a summary on the hurricane season. Freeze date information is provided in the table below. In addition, The National Weather Service released its Winter Weather Outlook which favors an enhanced chance of above normal temperatures and below normal precipitation over the Gulf coast.
Click on the snap shots below to expand:
 December Normals December Normals |
|
Outlook |

|

|
|
Additional Climate Links:
The links below are intended to provide additional climate information, education and outlooks. The National Weather Service Mobile Alabama's Climate and Past Weather page provides climate data at your fingertips for many observation points in the local forecast area by accessing the NOWData tab as well as many other climate resources. The Climate Prediction Center Link provides short and longer range climatic outlooks and education about the larger scale global circulations that impact temperatures and weather. With the large agriculture and farming presence along the central Gulf coast, the Drought Monitor link provides updates on drought trends and impacts. Another very helpful resource is the Community Collaborative Rain Hail and Snow (CoCoRaHS) network, which is a large group of volunteers working together to measure and map precipitation (rain, hail and snow). The aim of CoCoRaHS is to provide the highest quality data for natural resource, education and research applications. You can be a part of the CoCoRaHS team by becoming a volunteer rainfall observer. To learn more click on the CoCoRaHS link below.
National Weather Service Mobile AL Climate and Past Weather
Climate Prediction Center (CPC)
CoCoRaHS Network Water Year Summaries
![]()