May 2021 Climate Summaries
Mobile Alabama and Pensacola Florida Area
National Weather Service Mobile Alabama
June 7, 2021
May 2021 in Review - To lead off, the new 30 year normals (1991-2020) became official. The National Centers for Environmental Information (NCEI) released a publication on the new normals on May 4th and can be referred to at the following link: NOAA Delivers New U.S. Climate Normals.
For the Mobile area, a substantial part of the month showed high temperatures cooler than normal (averaging 4° below the climatological means) occurring in a span of the first three weeks. Following, daily highs nearly flat-lined along the normal for the remainder of the month. For lows, a sinusoidal curve around the average was shown the first three weeks. This was followed by a period of cooler lows to close out the month, averaging ~5° below normal for that period. Overall, monthly highs and lows were below normal by a few degrees. No record temperatures were set. The rain gauge collected just shy of a half foot of rain, another monthly surplus.
For the Pensacola area, comparisons to the daily highs with that of the new normals were similar to that of Mobile showing most of the first three week period cooler than normal, averaging ~3° below the climatological means. Following, daily highs nearly flat-lined along the normal for the remainder of the month. For lows, a nearly sinusoidal temperature curve around the average was also shown for the month. This was followed by a period of cooler lows to close out the month, averaging ~2° below normal. Overall, monthly highs and lows were slightly below normal. No record temperatures were set. The rain gauge collected over eight inches, a surplus of several inches.
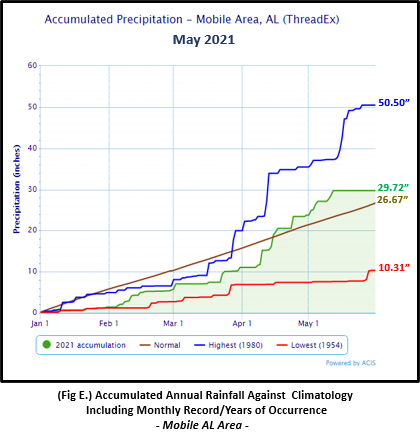
Mobile Alabama Area [Climate Normal Period 1991-2020, Climate Record Period 1872 to Present]- The average monthly high of 81.8° was 3.1° below normal. The average monthly low was 61.8° or 2.0° below normal. The average monthly temperature of 71.8° was 2.6° below normal. The highest temperature for the month, 88° on the 27th, was near the normal daily high temperature for this date. The lowest temperature for the month occurred on the morning of the 7th, sinking to a chilly 53° by May standards which was 8° below the normal daily low temperature for this date. No record temperatures were reached. (Fig. A) shows a graphical representation of how the Mobile area temperatures compared to the seasonal normal daily highs and lows, which are shown by the colored dashed lines. Bar graphs reflecting the daily high/low temperature departures from normal are provided in the table below (Figs. B and C). The rain gauge collected just just shy of a half foot of rainfall (Fig. D), measuring 5.94", or 0.55" above normal. Annual rainfall (Fig. E) now shows ~3.0" above normal to date.
May top records for the month during the Period of Record for the Mobile Area:
Click on the Mobile Alabama area climate graphics below to expand:

|

|

|

|
|
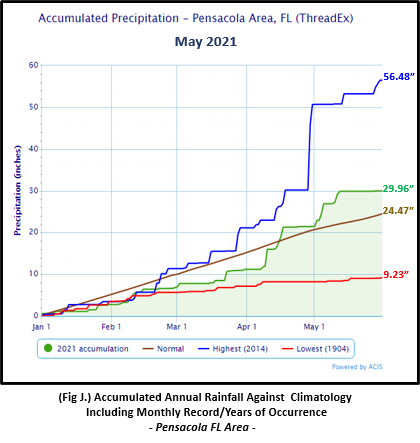
Pensacola Florida Area [Climate Normal Period 1991-2020, Climate Record Period 1879 to Present] - The average monthly high of 82.9° was 2.2° below normal. The average monthly low was 66.6° or 0.3° below normal. The average monthly temperature of 74.8° was 1.2° below normal. The highest temperature for the month, 90° on the 29th was 2° above the normal daily high temperature for this date. The lowest temperature for the month, 58° on the 7th, was 7° below the normal daily low temperature for this date. No record temperatures were reached. (Fig. F) shows a graphical representation of how the Pensacola area temperatures compared to the seasonal normal daily highs and lows, which are shown by the colored dashed lines. (Figs. G and H) shows the daily high/low temperature departures from normal. (Fig. I) shows Pensacola received 8.49" of rain, or 4.59" above normal. About 21% of this amount was contributed by a one day record rainfall occurring on the 11th, when 1.78" fell. This just edged out the previous one day record of 1.76" occurring on this date way back in 1915. Annual rainfall surplus continues, rising to 5.49" above normal to date (Fig. J).
May top records for the month during the Period of Record for the Pensacola Area:
Click on the Pensacola Florida area climate graphics below to expand:

|

|

|

|
|
Additional May 2021 Climatology and Topics
The latest May 2021 monthly summary for Eglin Air Force Base (AFB) - KVPS and Duke Field - KEGI has been received and provided in the table below. The temperatures in the daily tables consists of numbers both in °F/°C. Data courtesy of Mr. David Biggar, Staff Meteorologist, 96th Weather Squadron. Provided by permission.

|

|

|
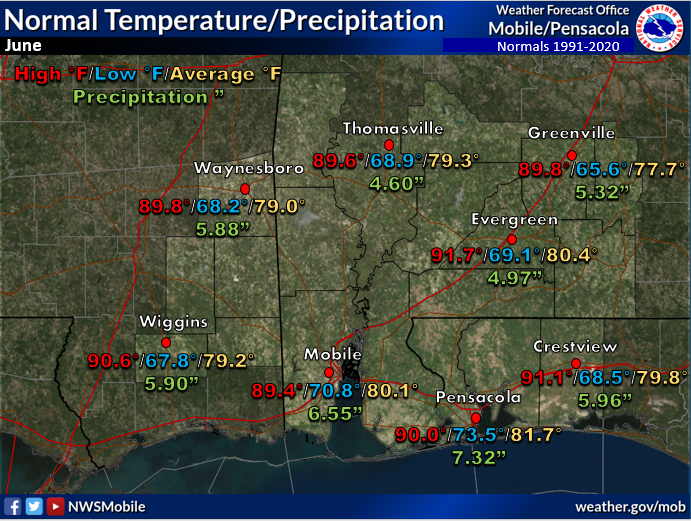
June 2021 Climatology, Seasonal Climatology and Outlooks:
The latest outlook for June favors a cooler pattern setting up over the Lower MS River Valley, while equal chances of above or below normal temperatures are favored over the southeast. A wet pattern is also favored over the deep south with modest chances of above normal rainfall occurrence. Given the wet pattern of late over the deep south, the drought links have been replaced with tropical weather climatology and outlooks. NOAA is expecting another busy Atlantic Basin Hurricane Season. Remember, all it takes is one storm to make it a bad year. It's highly encouraged to review your hurricane preparedness. Click on the Preparedness Tab on the NWS Mobile Tropical Webpage.
Click on the snap shots below to expand:
 June Normals June Normals |

|

Outlook |

|

|

|
Additional Climate Links:
The links below are intended to provide additional climate information, education and outlooks. The National Weather Service Mobile Alabama's Climate and Past Weather page provides climate data at your fingertips for many observation points in the local forecast area by accessing the NOWData tab as well as many other climate resources. The Climate Prediction Center Link provides short and longer range climatic outlooks and education about the larger scale global circulations that impact temperatures and weather. With the large agriculture and farming presence along the central Gulf coast, the Drought Monitor link provides updates on drought trends and impacts. Another very helpful resource is the Community Collaborative Rain Hail and Snow (CoCoRaHS) network, which is a large group of volunteers working together to measure and map precipitation (rain, hail and snow). The aim of CoCoRaHS is to provide the highest quality data for natural resource, education and research applications. You can be a part of the CoCoRaHS team by becoming a volunteer rainfall observer. To learn more click on the CoCoRaHS link below.
National Weather Service Mobile AL Climate and Past Weather
Climate Prediction Center (CPC)
CoCoRaHS Network Water Year Summaries
![]()