March 2025 Climate Summaries
Mobile Alabama and Pensacola Florida Area
Joe Maniscalco - Observation Program Leader (OPL)/Meteorologist
POC for Observation, Climate, and COOP
National Weather Service Mobile Alabama
April 1, 2025
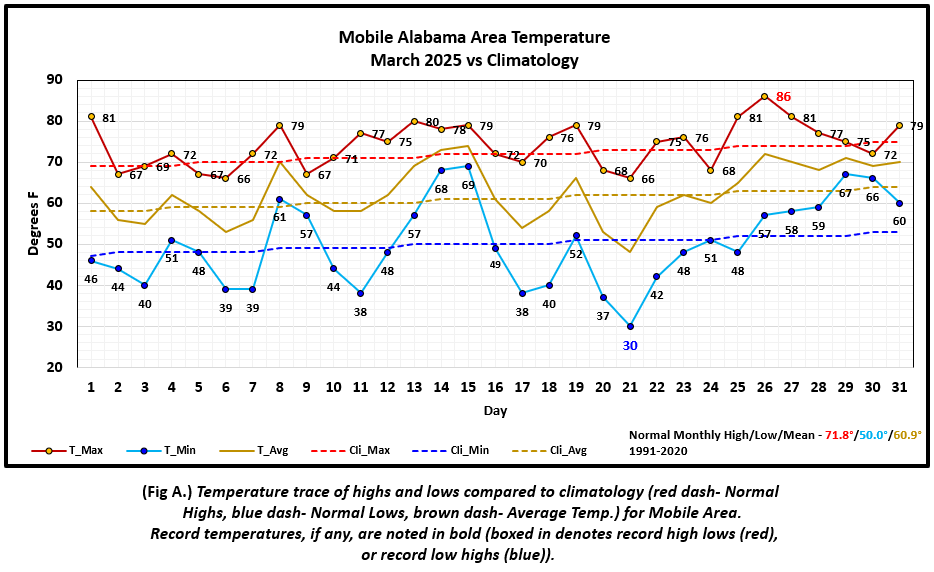
March 2025 in Review - Temperatures at Mobile and Pensacola were not too far off the monthly normal for March. Even so, there were some periods of large variability noted in the daily temperatures about the means, mainly in the night-time lows at both Mobile and Pensacola. Even so, the average low temperatures evened out to very close to normal, at less than a degree. Temperatures surged well above normal and to record setting warmth on the 26th to well into the 80's at Mobile and Pensacola. Not to be out done, one morning at Mobile plunged to record setting cold, to below freezing at Mobile.
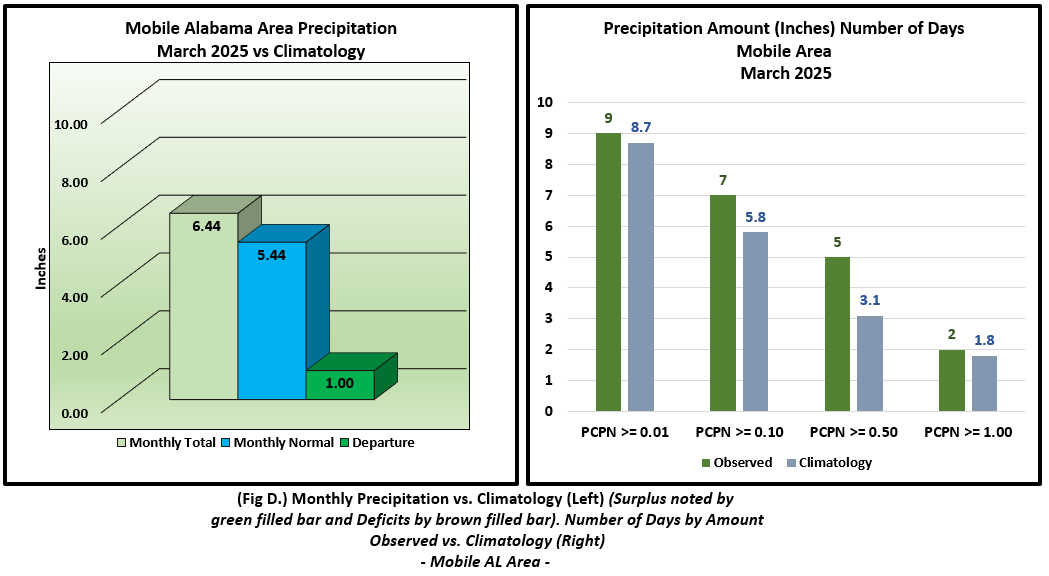
It was a mostly dry month with little in the way of significant rainfall. That all changed until the last couple days when an excessive rainfall event caused the rain gauge to swell to values above normal. Most notably, Pensacola's monthly rainfall total was well over nine inches. Over 60% of Pensacola's monthly total rainfall came on the 30th when a new daily record rainfall of over a half foot was collected in the gauge.
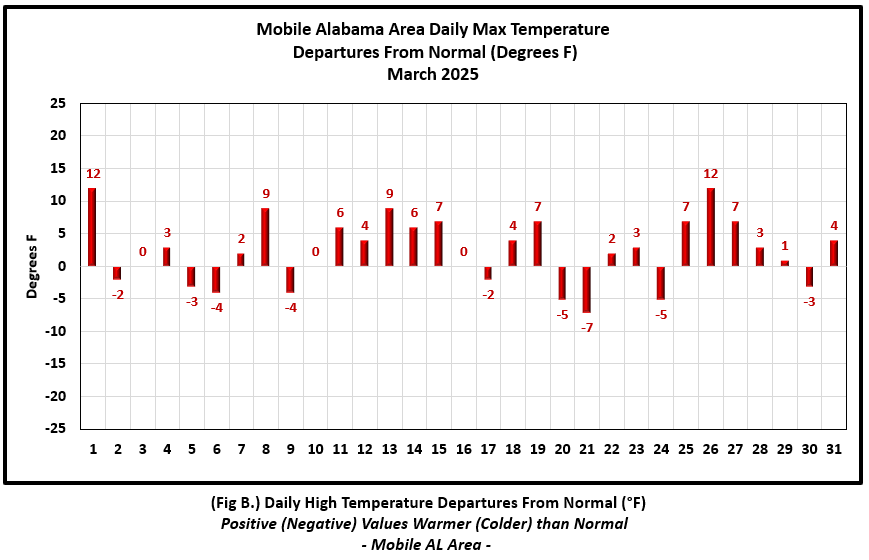
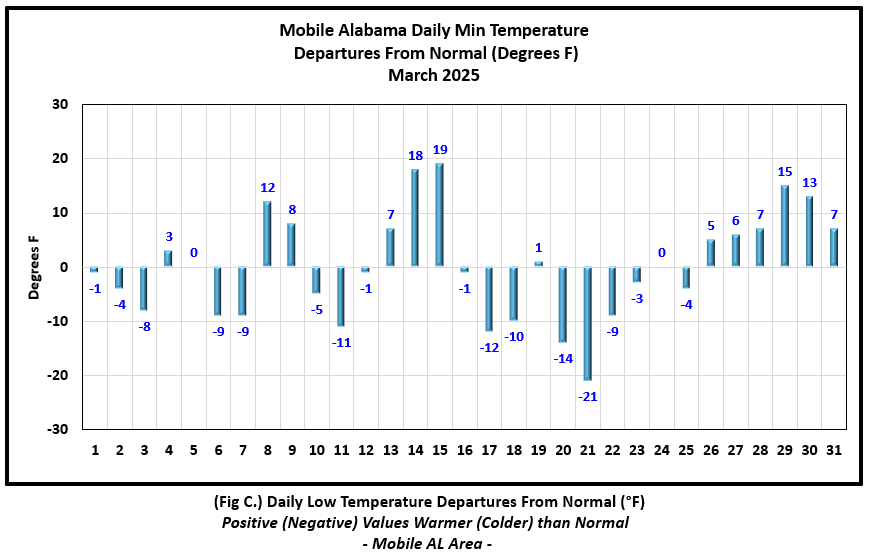
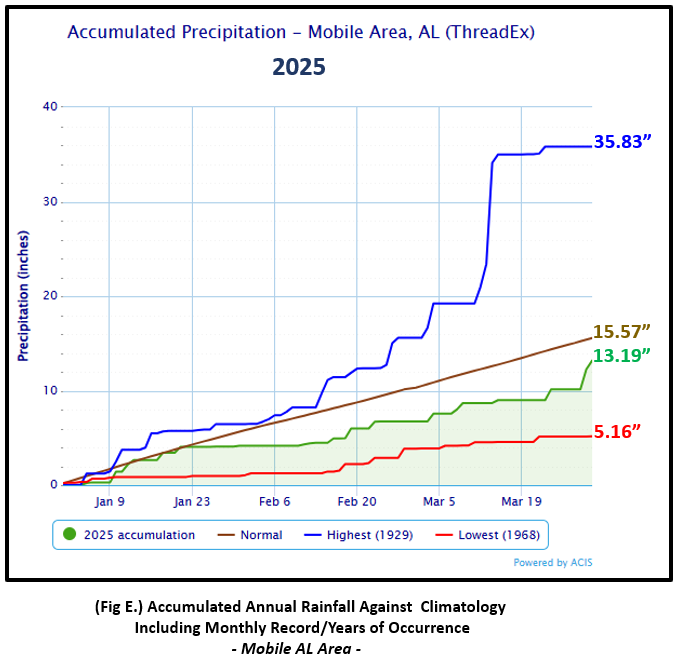
Mobile Alabama Area [Climate Normal Period 1991-2020, Climate Record Period 1872 to Present]- The average monthly high of 74.2° was 2.4° above normal. The average monthly low was 50.0° or normal. The average monthly temperature of 62.1° was 1.2° above normal. The highest temperature for the month, 86°, occurring on the 26th was 12° above the normal for the date and also matched a record high. The other years of occurrence on this date were in 2020 and 1935. The lowest temperature for the month sank to a record setting 30° on the morning of the 21st, 21° below normal for this date. This broke the previous record of 31° set in 1996 and 1876. (Fig. A) shows a graphical representation of how the Mobile area temperatures compared to the seasonal normal daily highs and lows, which are shown by the colored dashed lines. Bar graphs reflecting the daily high/low temperature departures from normal are provided in the table below (Figs. B and C). The rain gauge collected 6.44" (Fig. D), one inch even above normal. Accumulated rainfall to date at 13.19" for Mobile is in deficit against the normal by over two inches to close out the month (Fig. E).
March Top Records for the Month During the Period of Record for the Mobile Area:
Click on the Mobile Alabama area climate graphics below to expand:
|
|
|
|
|
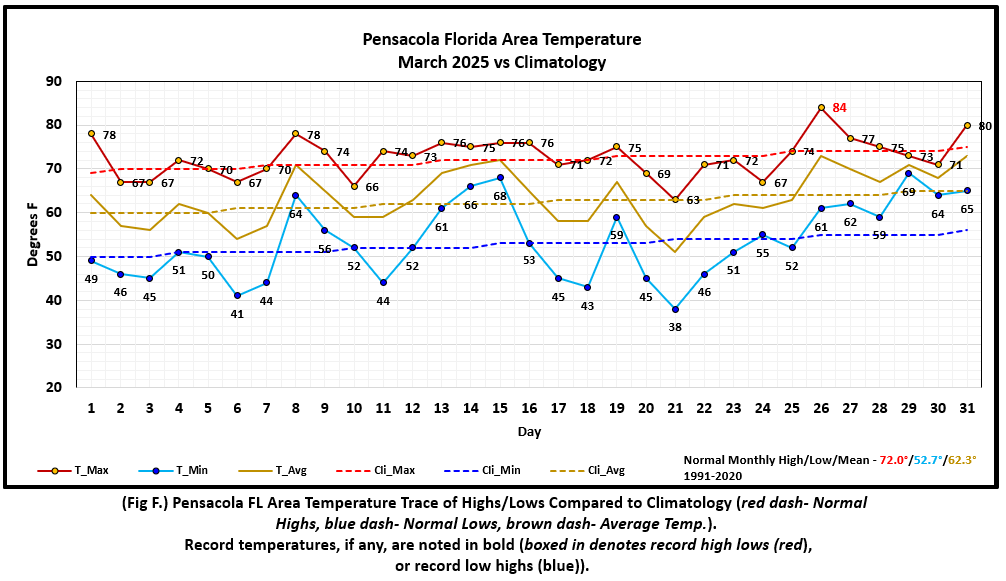
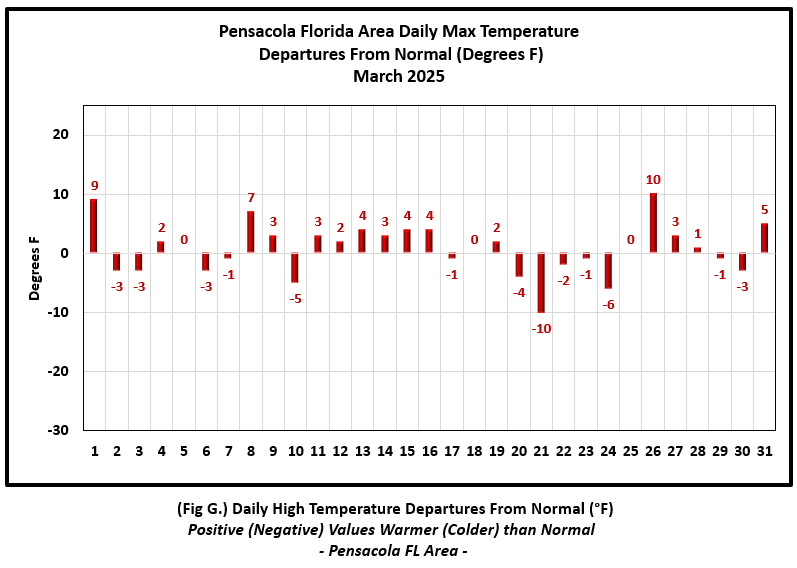
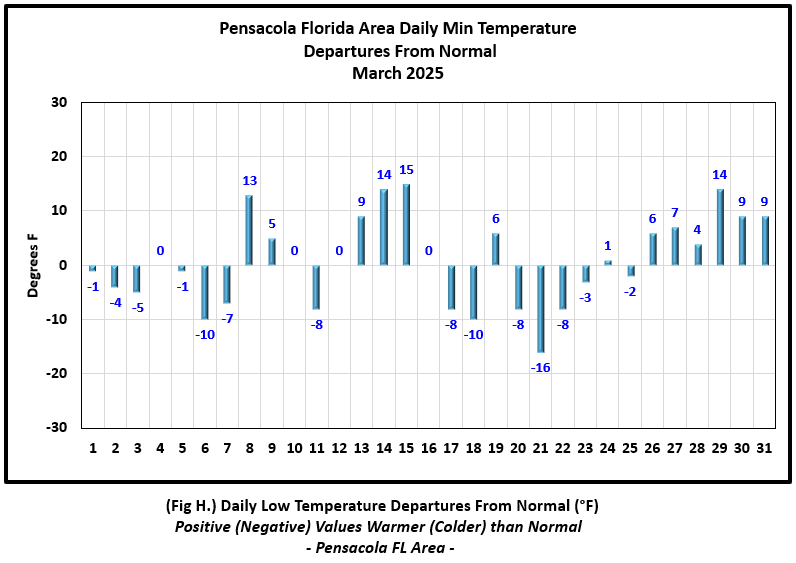
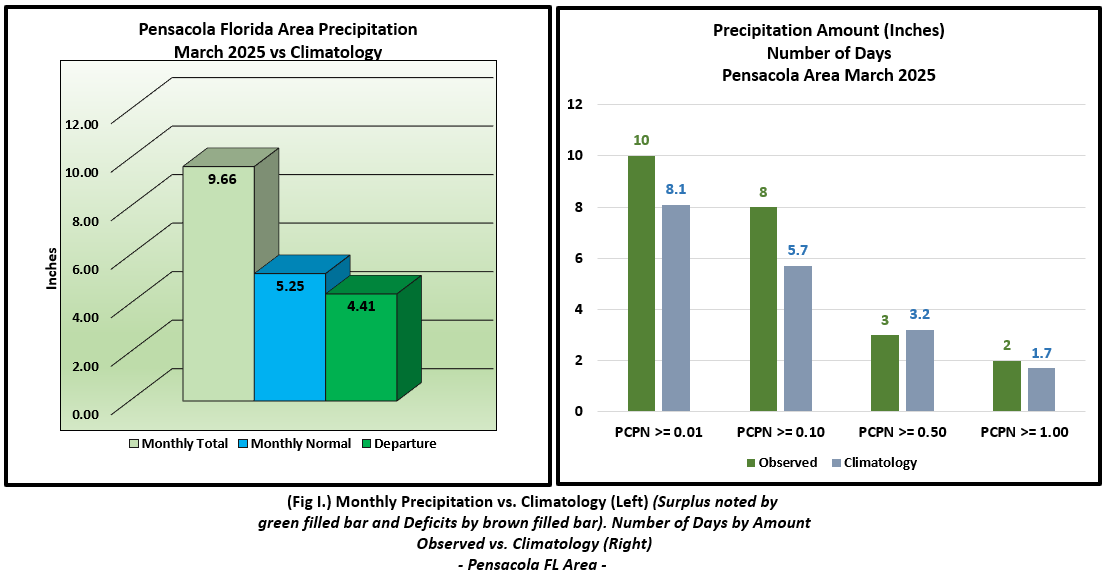
Pensacola Florida Area [Climate Normal Period 1991-2020, Climate Record Period 1879 to Present] - Interestingly, all three of the temperature metric departures from normal were the same. The average monthly high of 72.7° was 0.7° above normal. The average monthly low of 53.4° was 0.7° above normal. The average monthly temperature of 63.0° was also 0.7° above normal. The highest temperature for the month, 84°, occurring on the 26th, was 10° above the normal for the date and also matched a record high. The other year of occurrence on this date was in 2020.The lowest temperature for the month dipped to 38° on the morning of the 21st, 16° below normal for this date. (Fig. F) shows a graphical representation of how the Pensacola area temperatures compared to the seasonal normal daily highs and lows, which are shown by the colored dashed lines. (Figs. G and H) shows the daily high/low temperature departures from normal. The rain gauge collected well over nine inches at 9.66" (Fig. I), 4.41" above normal for the month. Over 60% of Pensacola's monthly total rainfall came on the 30th when a new daily record rainfall of 6.09" was measured in the gauge and nearly doubling the previous record for the date of 3.50" set back in 1996. Accumulated rainfall to date is now in surplus by 3.14" for Pensacola thus far to close out March (Fig. J).
March Top Records for the Month During the Period of Record for the Pensacola Area:
Click on the Pensacola Florida area climate graphics below to expand:
|
|
|
|

|
Additional March 2025 Climatology and Topics
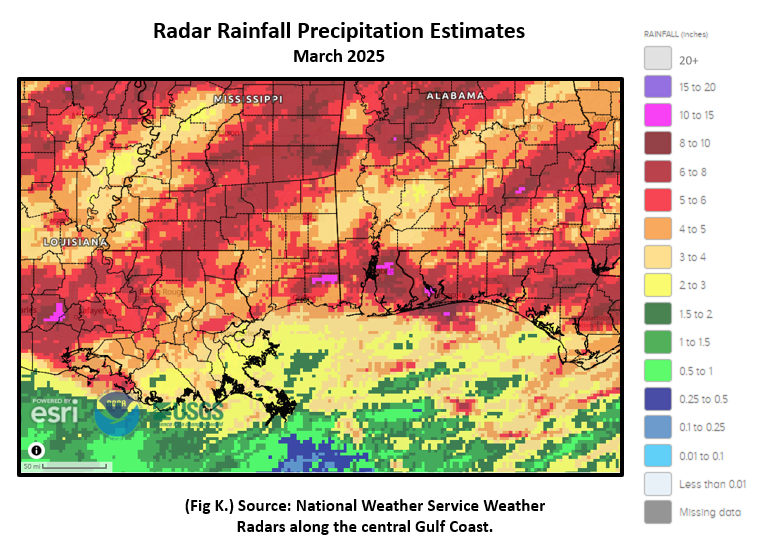
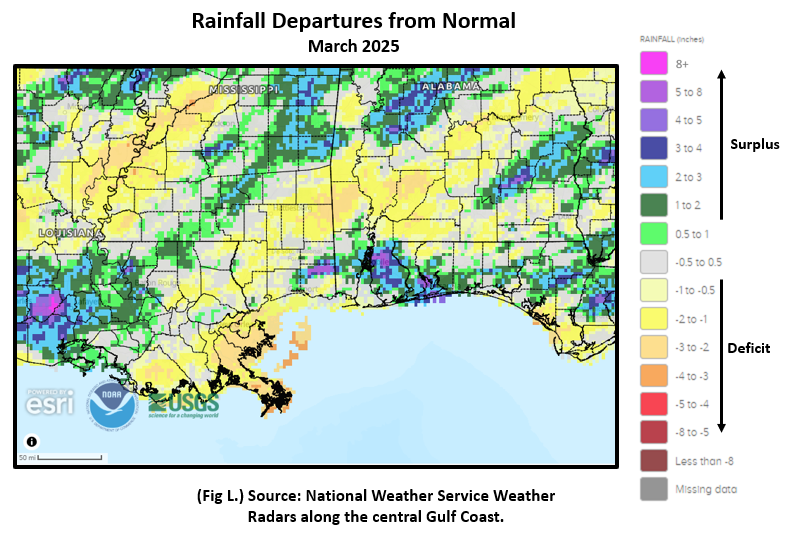
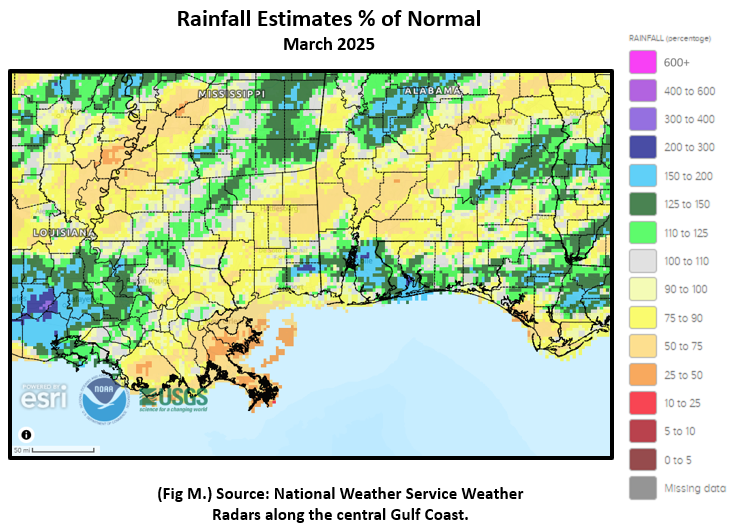
The highest rainfall was focused along the coastal counties where the footprint of 5 to 8 inches was aligned. Within these areas, isolated pockets of 10 to 15 inches were dotted primarily over central Baldwin Co. AL, southeast to southern Escambia and southwest Santa Rosa Co's. over the western FL Panhandle. These areas also reflected considerably more rainfall than normal at 150-300%. Fig. K shows the areal monthly rainfall total, Fig. L shows the areal rainfall departures from normal and Fig. M, the areal percent of normal rainfall.
The latest March2025 Monthly Climate Summary for Eglin Air Force Base (KVPS) and Duke Field (KEGI) has been provided courtesy of Mr. David Biggar, Staff Meteorologist, 96th Weather Squadron. Provided by permission.
|
|
|
April 2025 Climatology, Seasonal Climatology and Outlooks:
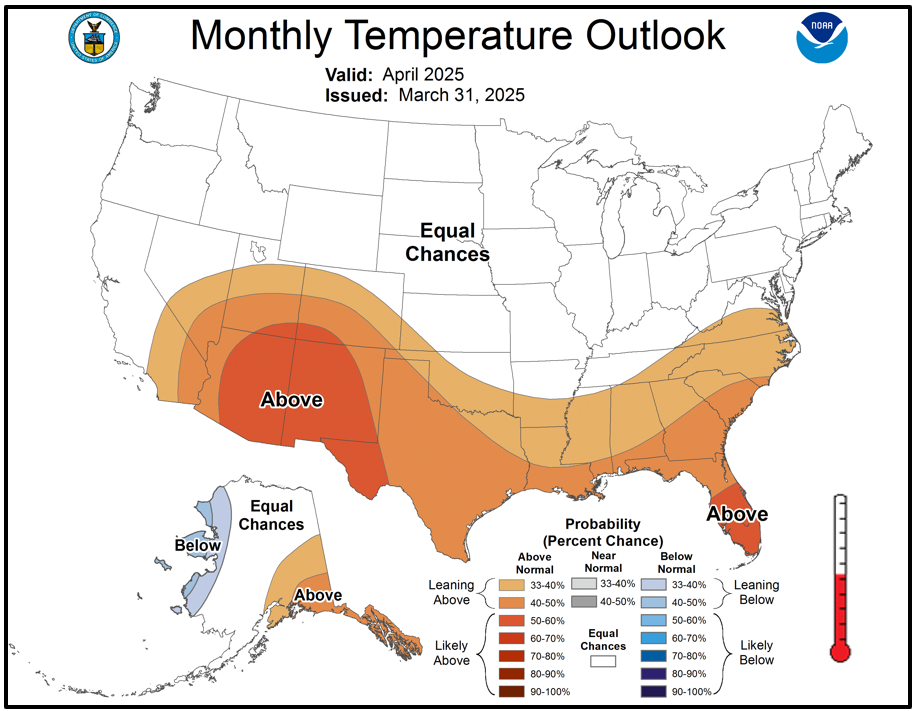
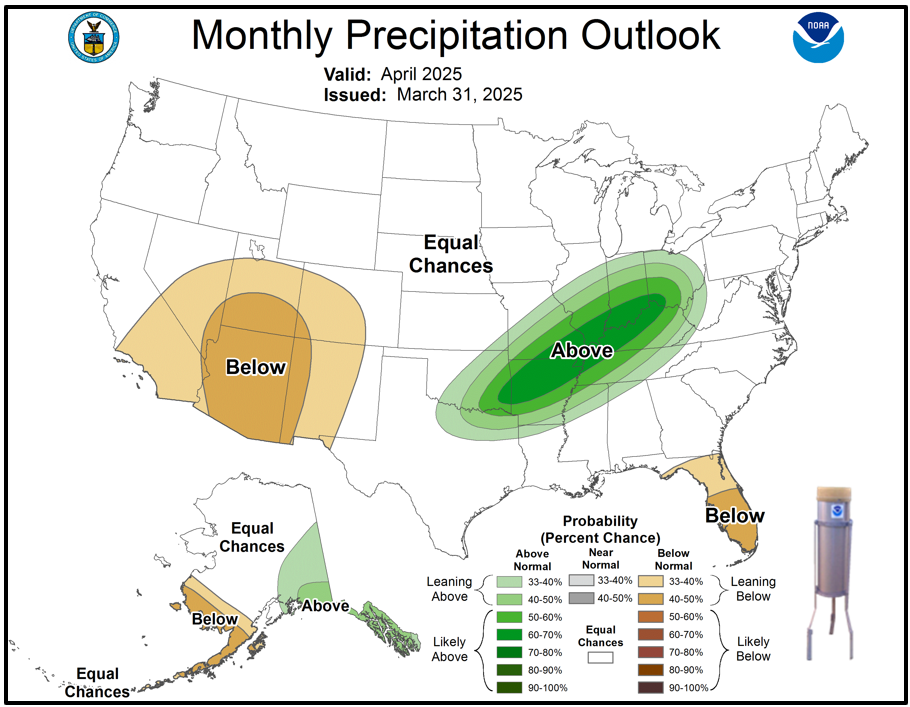
The latest outlook for April favors temperatures to lean above normal over the southern U.S. Equal chances of above or below normal precipitation is favored over the Coastal Plain. Although we are typically well past the normal last freeze, the climate period of record still tells us we can still get a freeze well into the month of April, especially over the interior deep into the month. Considering this, gardeners and commercial growers should be prepared to cover up tender garden vegetables if a threat of freezing temperatures materializes. Some areas over the northern zones remains parched and abnormally dry. The drought outlook though for April does not show dryness intensifying.
 April Normals April Normals |
|
Outlook |

|

|
Additional Climate Links:
The National Weather Service Mobile Alabama's Climate and Past Weather page provides climate data at your fingertips for many observation points in the local forecast area by accessing the NOWData tab as well as many other climate resources. The Climate Prediction Center Link provides short and longer range climatic outlooks and education about the larger scale global circulations that impact temperatures and weather. With the large agriculture and farming presence along the central Gulf coast, the Drought Monitor link provides updates on drought trends and impacts. Another very helpful resource is the Community Collaborative Rain Hail and Snow (CoCoRaHS) network, which is a large group of volunteers working together to measure and map precipitation (rain, hail, and snow). The aim of CoCoRaHS is to provide the highest quality data for natural resource, education and research applications. You can be a part of the CoCoRaHS team by becoming a volunteer rainfall observer.
Questions or Comments:
Contact: Joe Maniscalco - Observation Program Leader WFO Mobile, AL at joe.maniscalco@noaa.gov