June 2023 Climate Summaries
Mobile Alabama and Pensacola Florida Area
National Weather Service Mobile Alabama
July 5, 2023
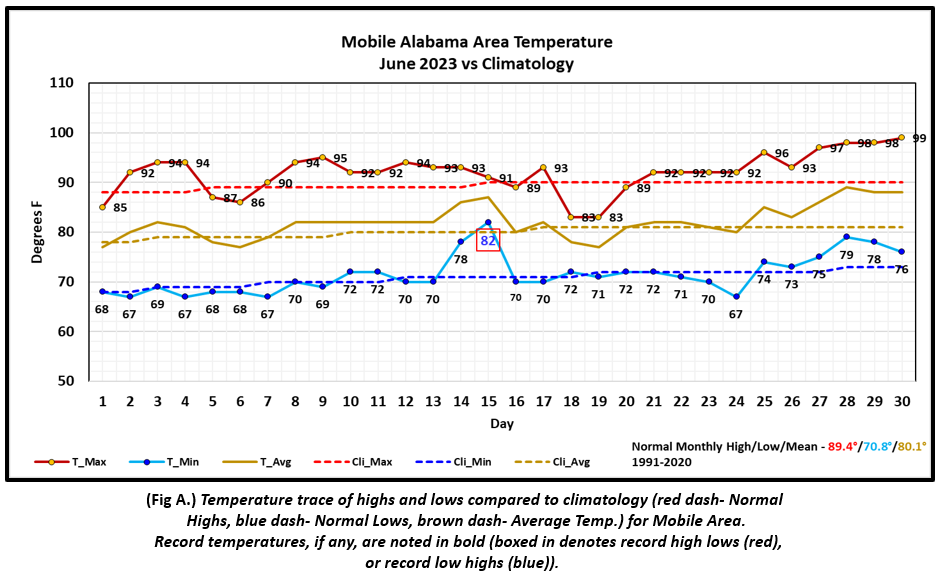
June 2023 in Review - On average, the daily high temperatures showed more fluctuation against the normal June highs at Mobile, averaging over 2° above normal for the month. Over 76% of the month saw daily highs at or above 90° or 23 days of occurrence. June closed out on a hot note as an anomalously strong upper level ridge of high pressure was entrenched over the deep south with high temperatures at Mobile averaging nearly 7° above normal from the 25th to the 30th. Low temperatures for the most part were a bit more steady state and averaging close to normal at less than a degree on average through the month at Mobile and Pensacola. The only notable mention, a record warmest low temperature against the means, occurred during the middle of the month when the thermometer did not fall below the lower 80s on the 15th at Mobile.
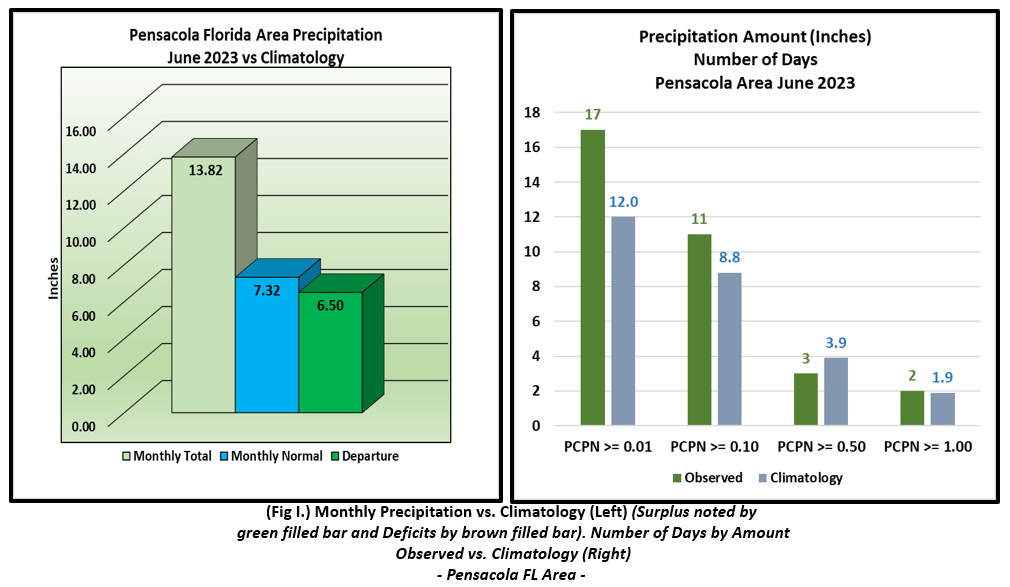
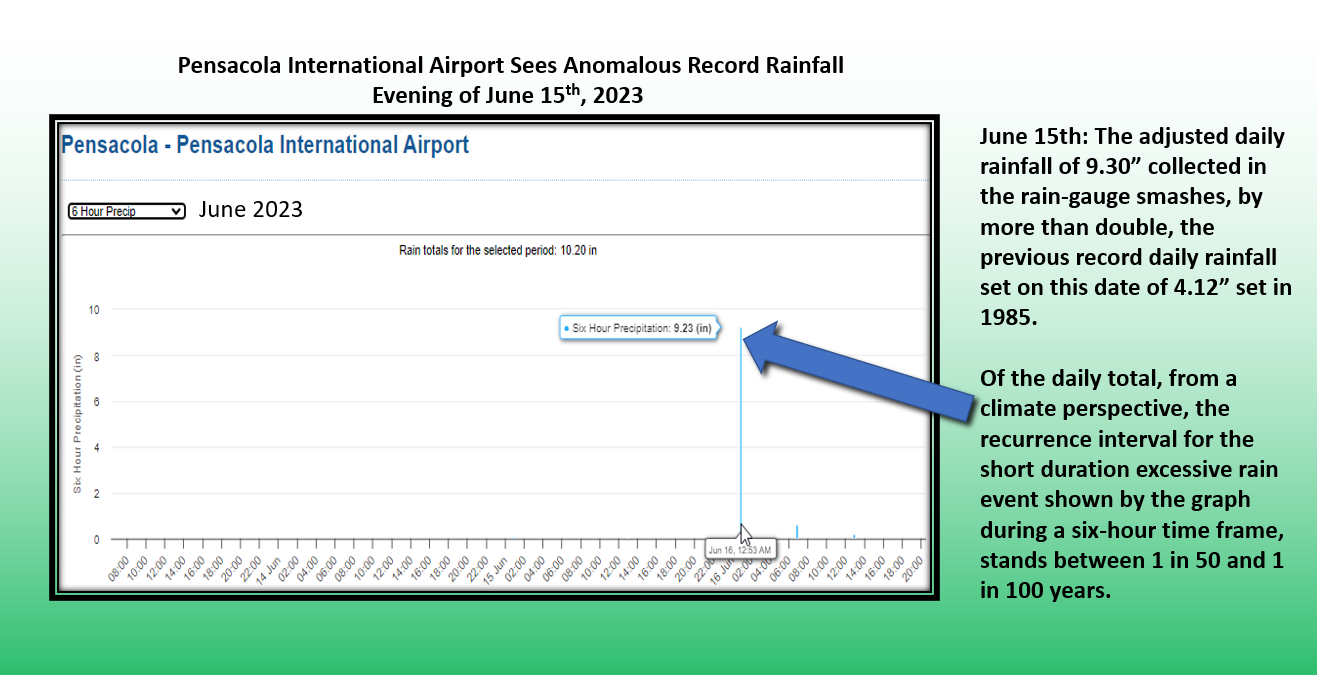
Excessive rainfall filled area rain gauges over the central Gulf coast the middle of the month. The Pensacola area topped Mobile, by collecting shy of 14" for the month, a bit over a half foot above normal. In fact, 9.30" falling on the 15th set a new one day record rainfall and stands as the 3rd wettest day in Pensacola's June period of record. Secondly, see link here => 9.23" of this amount falling in a six-hour time period on the evening of the 15th aligned itself with an event that typically occurs once in 50 to 100 years.
Tropical Storms Bret and Cindy formed deep in the Tropical Atlantic's Main Development Region (MDR) east of the Caribbean. Since records have been kept dating back to 1851, June 2023 became the earliest month on record with more than one named storm forming out that way. In the MDR, Bret this year, forming June 19th ties for 2nd earliest with Ana in 1979. Cindy forming late in the evening June 22nd, now stands as 3rd earliest to form out that way.
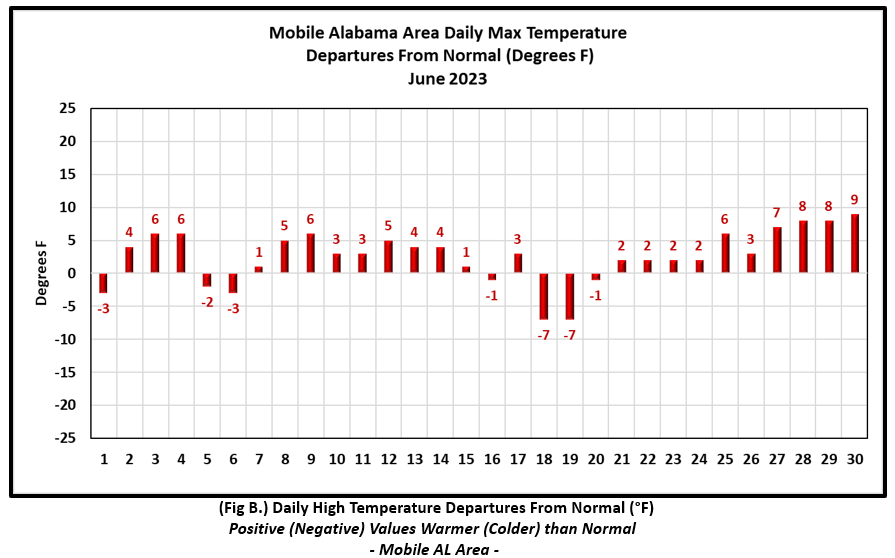
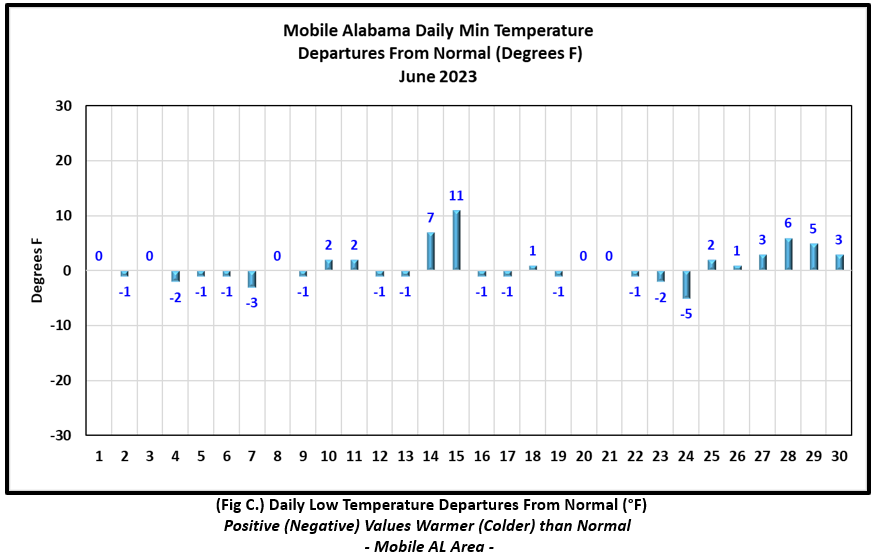
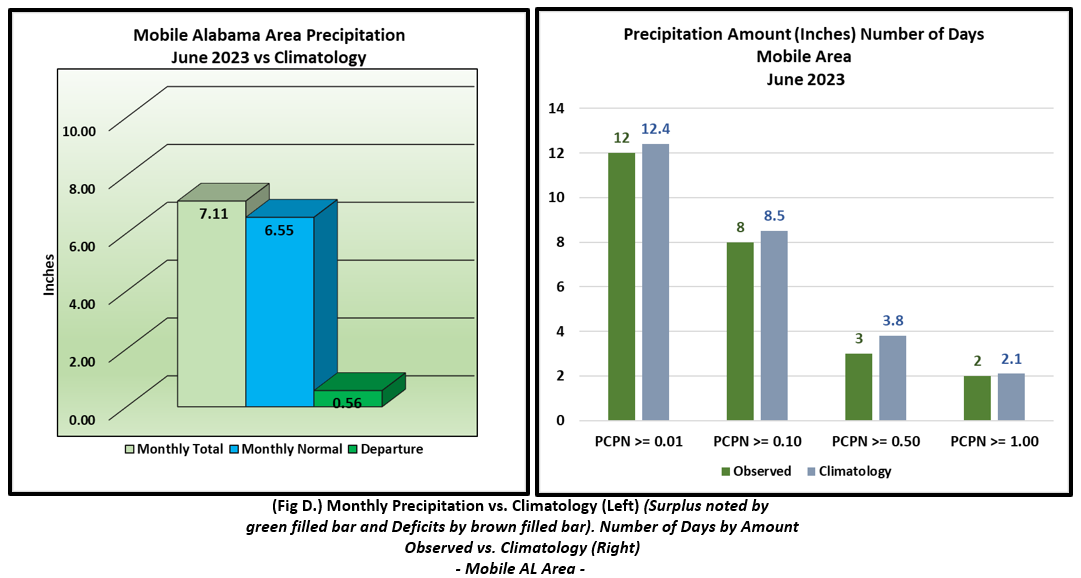
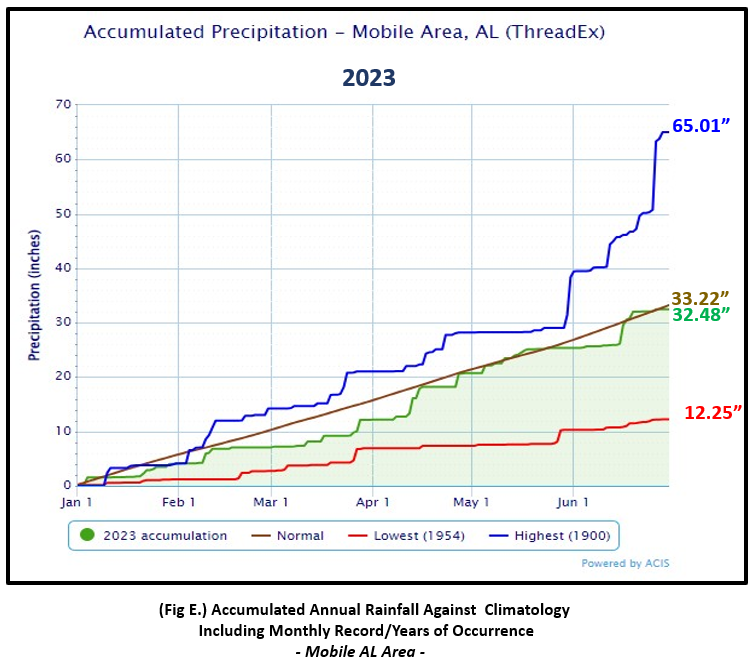
Mobile Alabama Area [Climate Normal Period 1991-2020, Climate Record Period 1872 to Present]- The average monthly high of 91.9° was 2.5° above normal. There were 23 days of occurrence of 90° or higher or 7 days more than climatology. The average monthly low was 71.6° or 0.8° above normal. The average monthly temperature of 81.8° was 1.7° above normal. The highest temperature for the month was a toasty 99° on the 30th which was 9° above the normal for this date. The lowest temperature for the month occurred on four days, the 2nd, 4th 7th and the 24th, which averaged 2.75° below the normal for these dates. Despite the heat of the month, only one record temperature was met with a new high low temperature of 82° on the morning of the 15th surpassing the previous record of 80° set on this date way back in 1922. (Fig. A) shows a graphical representation of how the Mobile area temperatures compared to the seasonal normal daily highs and lows, which are shown by the colored dashed lines. Bar graphs reflecting the daily high/low temperature departures from normal are provided in the table below (Figs. B and C). The rain gauge collected 7.11" for the month (Fig. D), about a half inch above normal. The annual rainfall total ending June 30th is in deficit by just under an inch (Fig. E).
June top records for the month during the Period of Record for the Mobile Area:
Click on the Mobile Alabama area climate graphics below to expand:
|
|
|
|
|
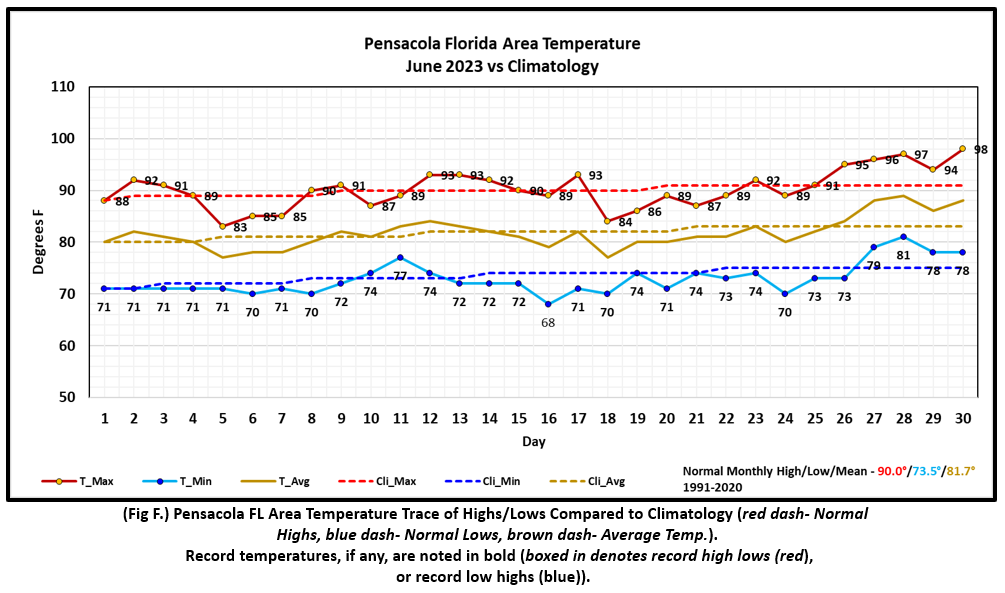
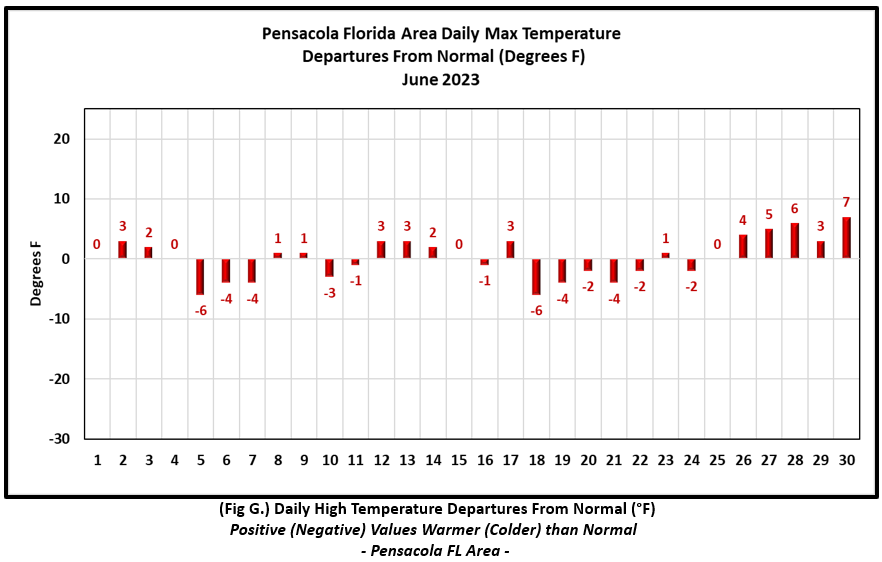
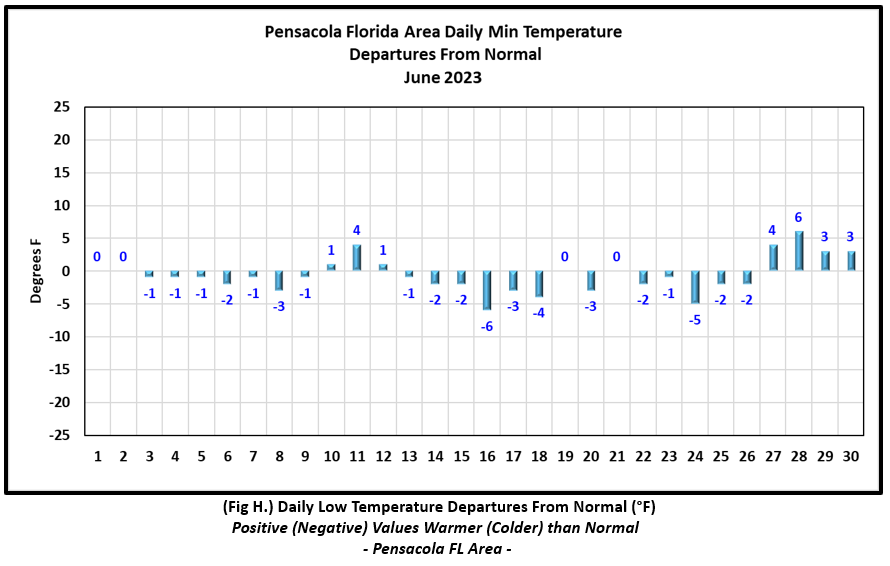
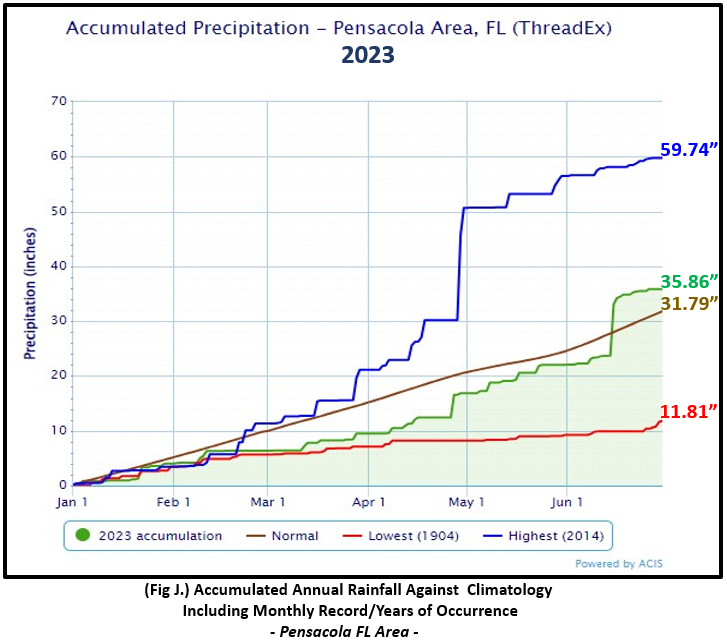
Pensacola Florida Area [Climate Normal Period 1991-2020, Climate Record Period 1879 to Present] - The average monthly high of 90.2° was 0.2° above normal. The average monthly low was 72.9° or 0.6° below normal. The average monthly temperature of 81.6° was 0.1° below normal. The highest temperature for the month was a toasty 98° on the 30th which was 7° above the normal for this date. The lowest temperature for the month, 68° occurred on the 16th, 6° below the normal for this date. (Fig. F) shows a graphical representation of how the Pensacola area temperatures compared to the seasonal normal daily highs and lows, which are shown by the colored dashed lines. Bar graphs reflecting the daily high/low temperature departures from normal are provided in the table below (Figs. G and H). (Fig. I) indicates Pensacola received quite a bit of rain at 13.82" or 6.50" above normal. 9.30", falling on the 15th set a new one day record rainfall, smashing the previous record of 4.12" on this date by more than double. June 15th this year stands as the 3rd wettest day in Pensacola's June period of record with the top wettest day occurring June 9th, 2012 still standing strong at 13.13". Annual rainfall ending June 30th is in surplus by a few inches now, 4.07" (Fig. J).
June top records for the month during the Period of Record for the Pensacola Area:
Click on the Pensacola Florida area climate graphics below to expand:
|
|
|
|
|
Additional June 2023 Climatology and Topics
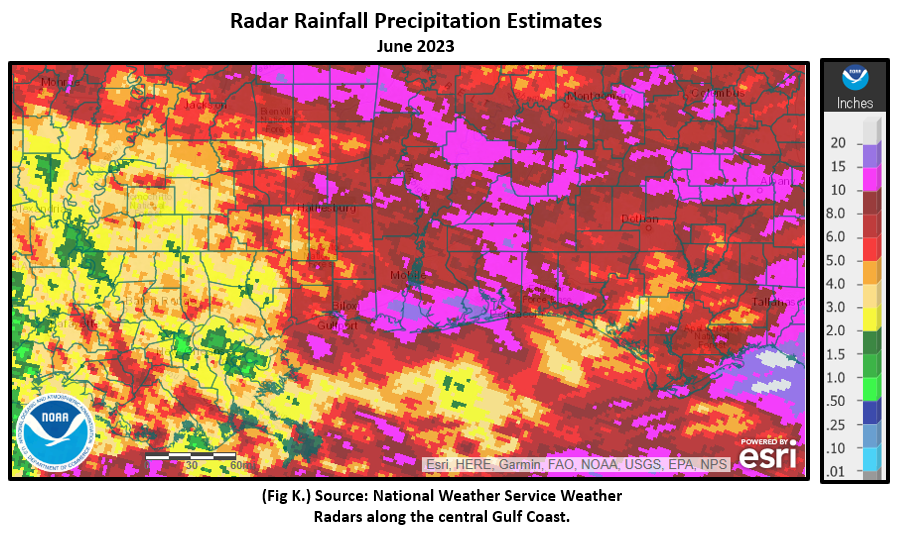
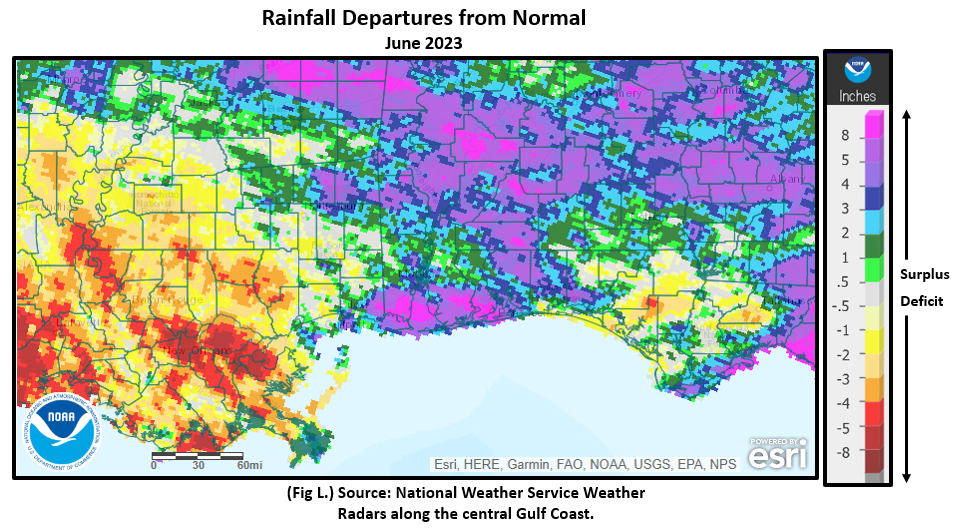
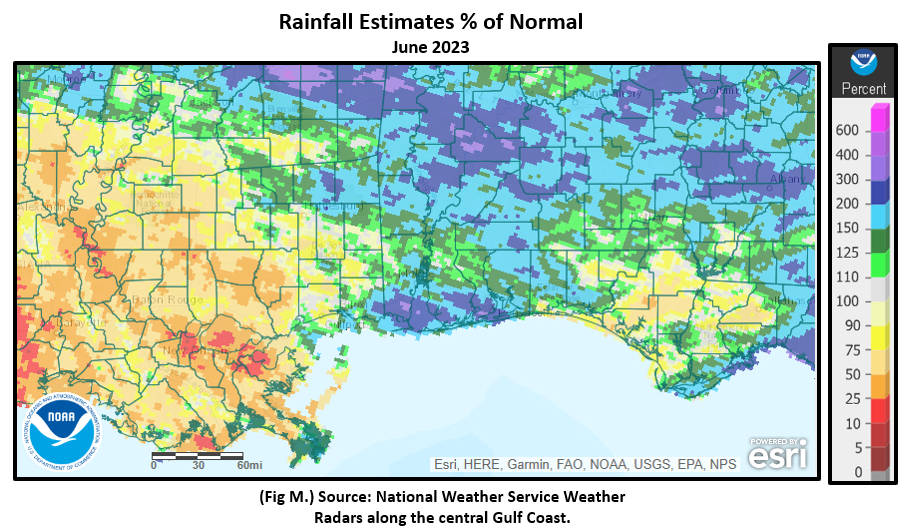
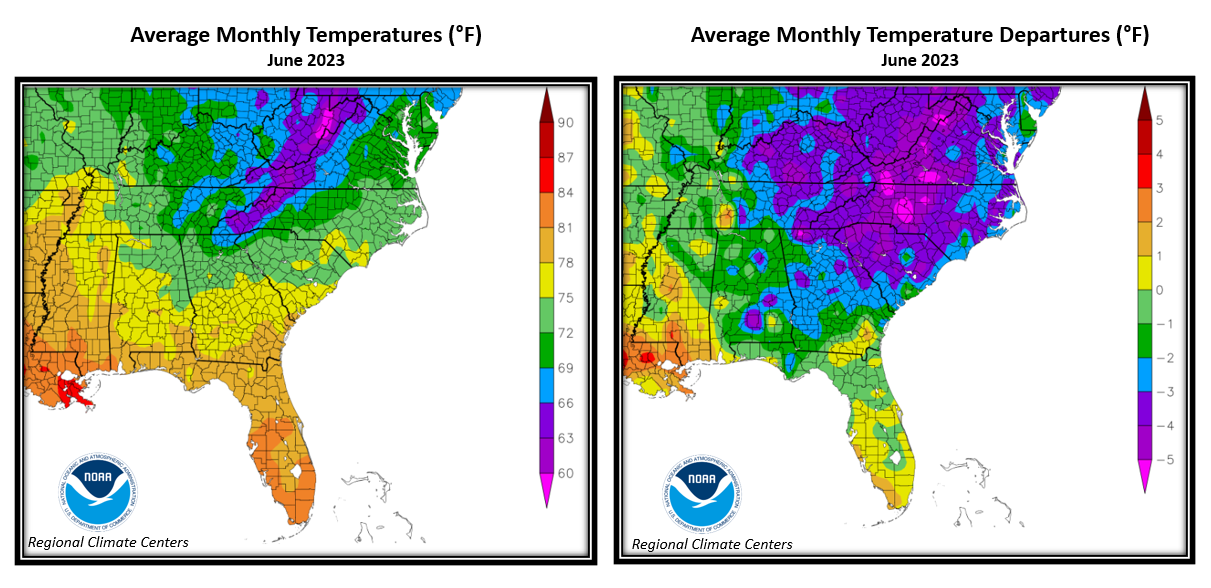
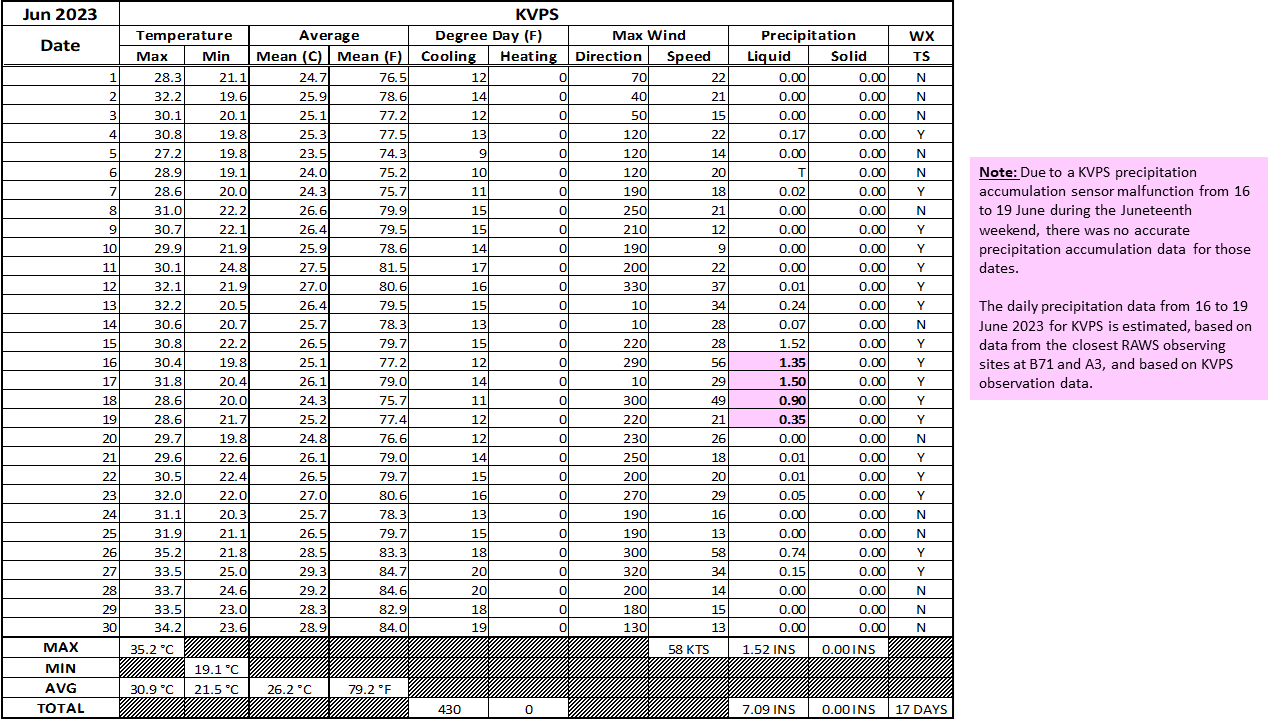
High impact, excessive rain fell over the local area during the middle of June. There were many areas that saw rain gauge accumulations swelling to between 10 to 20". Many locales saw 150 to 300% of normal rainfall with pockets of an astounding 300 to 400% of normal rainfall being observed. (Fig. K) shows the areal monthly rainfall total, (Fig. L) shows the areal rainfall departures from normal and (Fig. M), the areal percent of normal rainfall. Areal average temperatures are provided in (Fig. N). The latest June 2023 monthly summary for Eglin Air Force Base (AFB) - KVPS has been received and provided in the table below. The temperatures in the daily tables consists of numbers both in °F/°C. Data courtesy of Mr. David Biggar, Staff Meteorologist, 96th Weather Squadron. Provided by permission.
|
|
|
|

|
|
|
July 2023 Climatology, Seasonal Climatology and Outlooks:
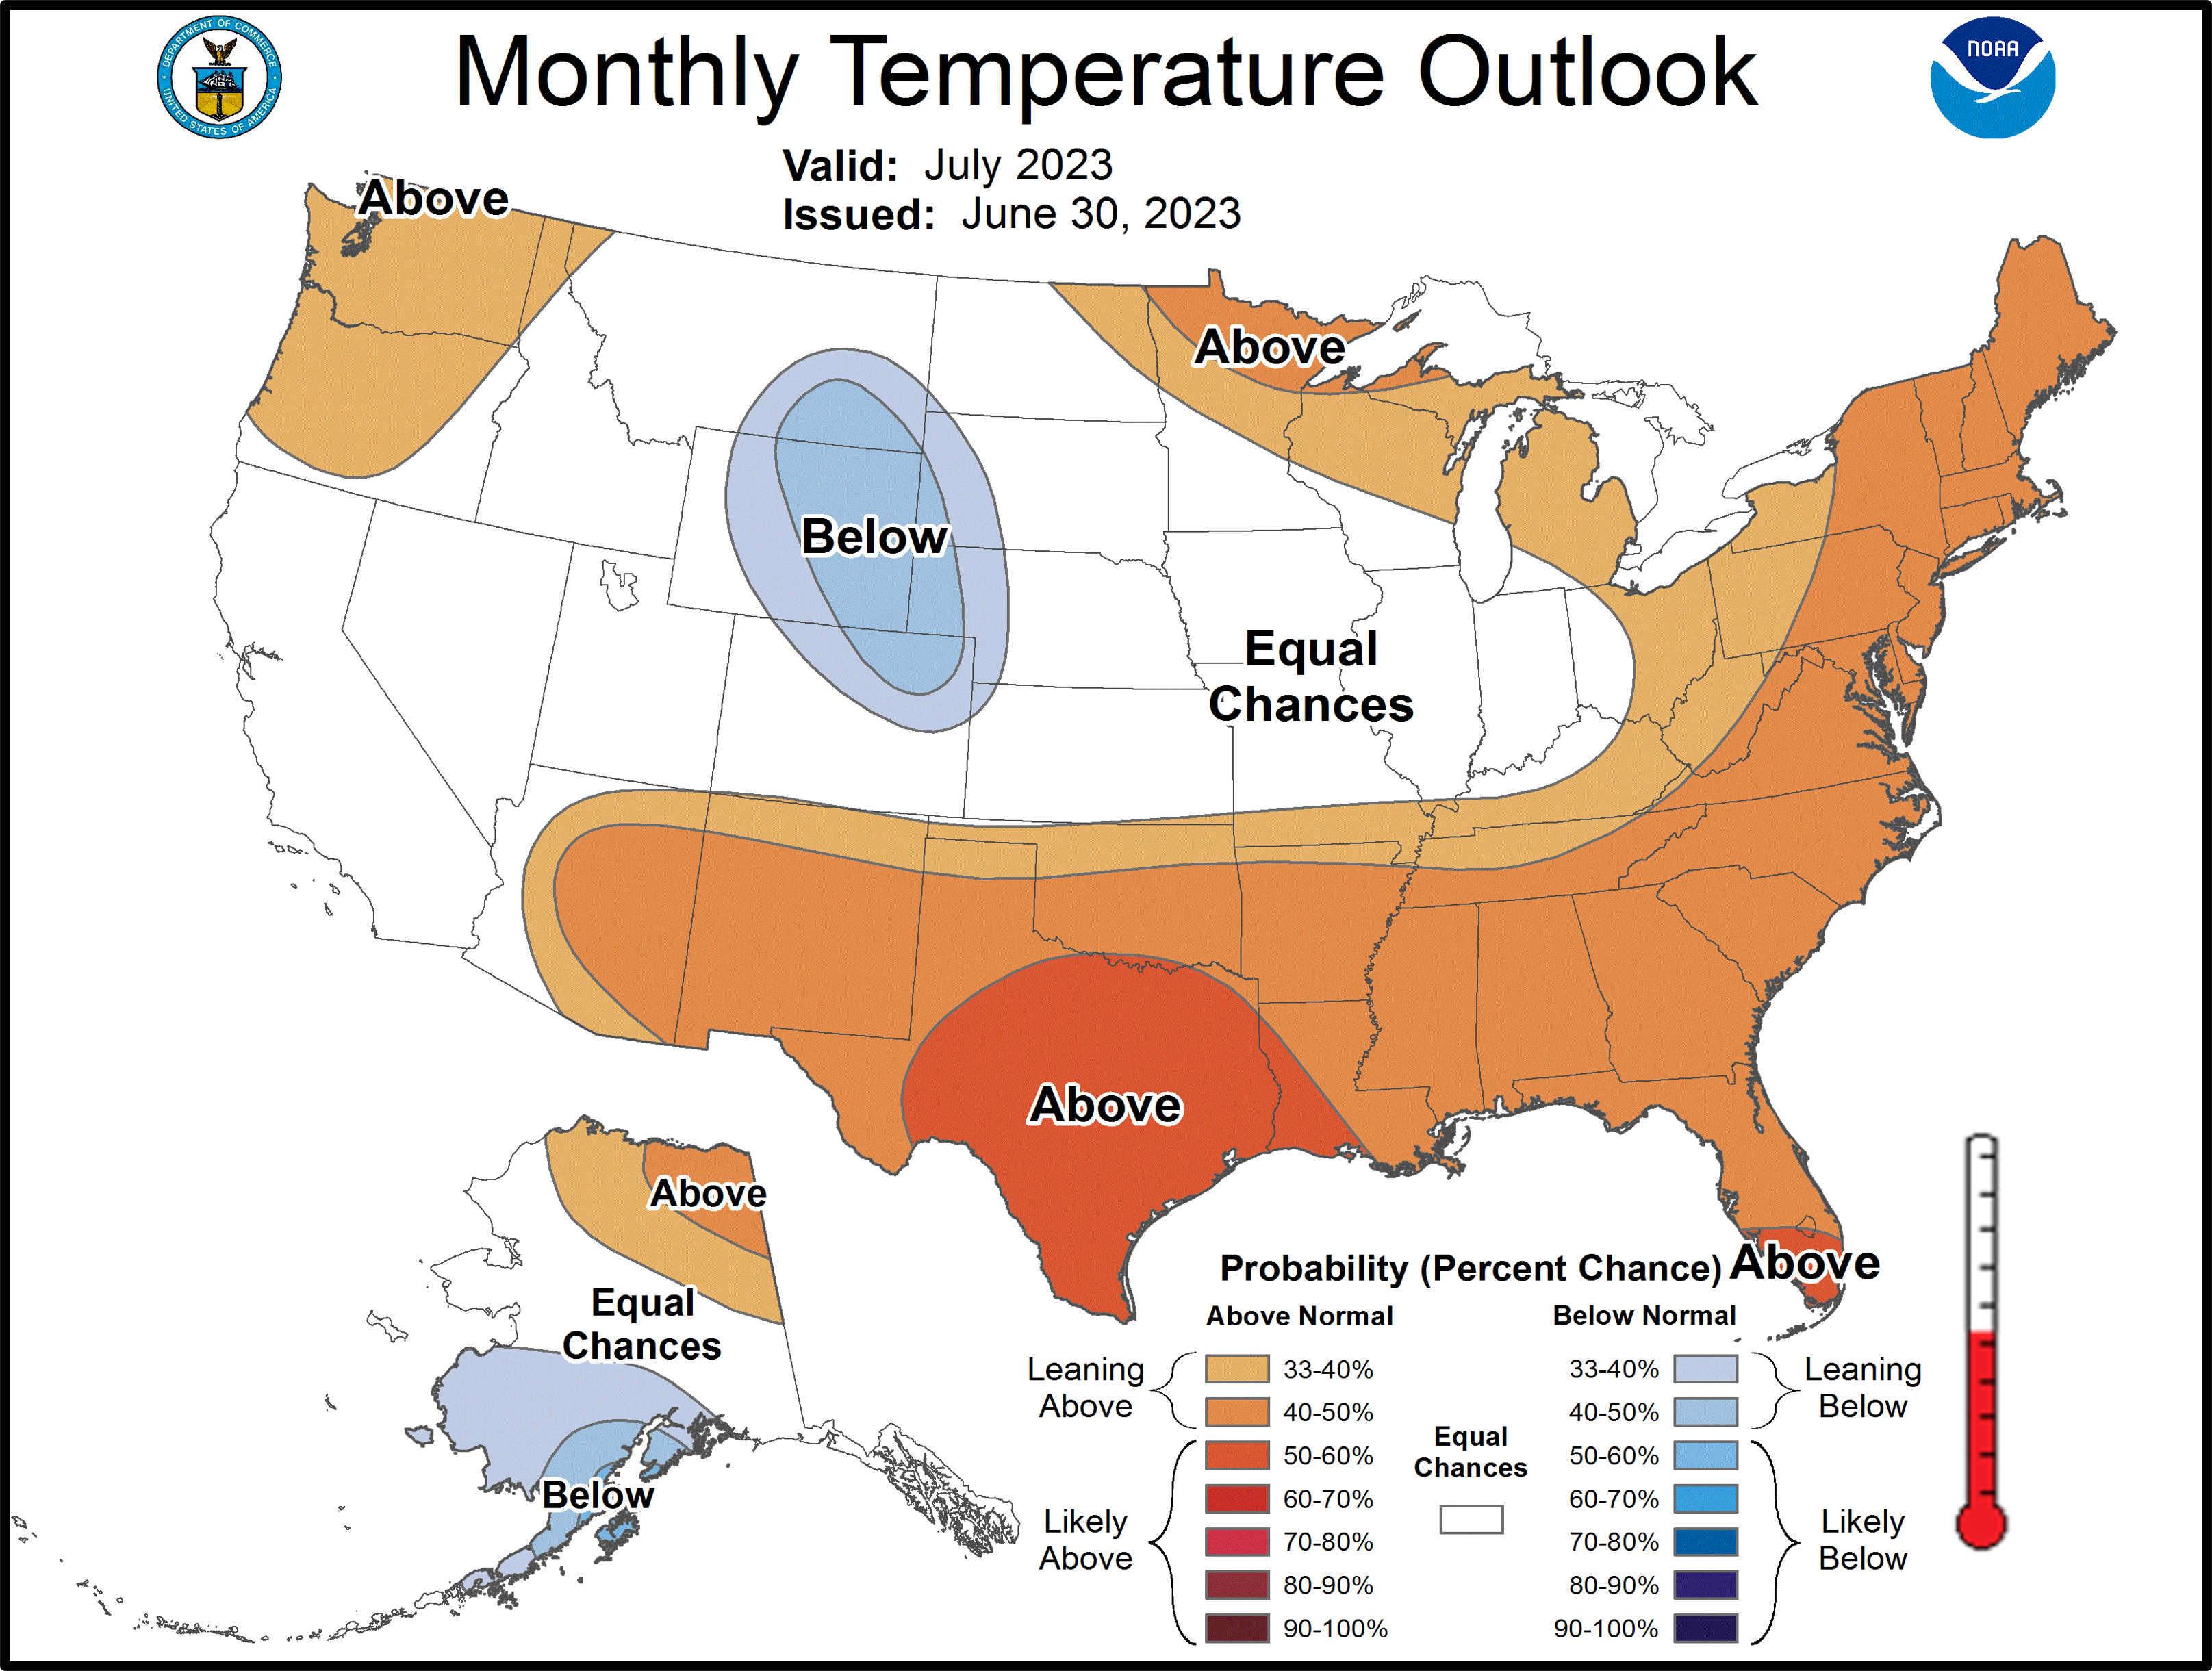
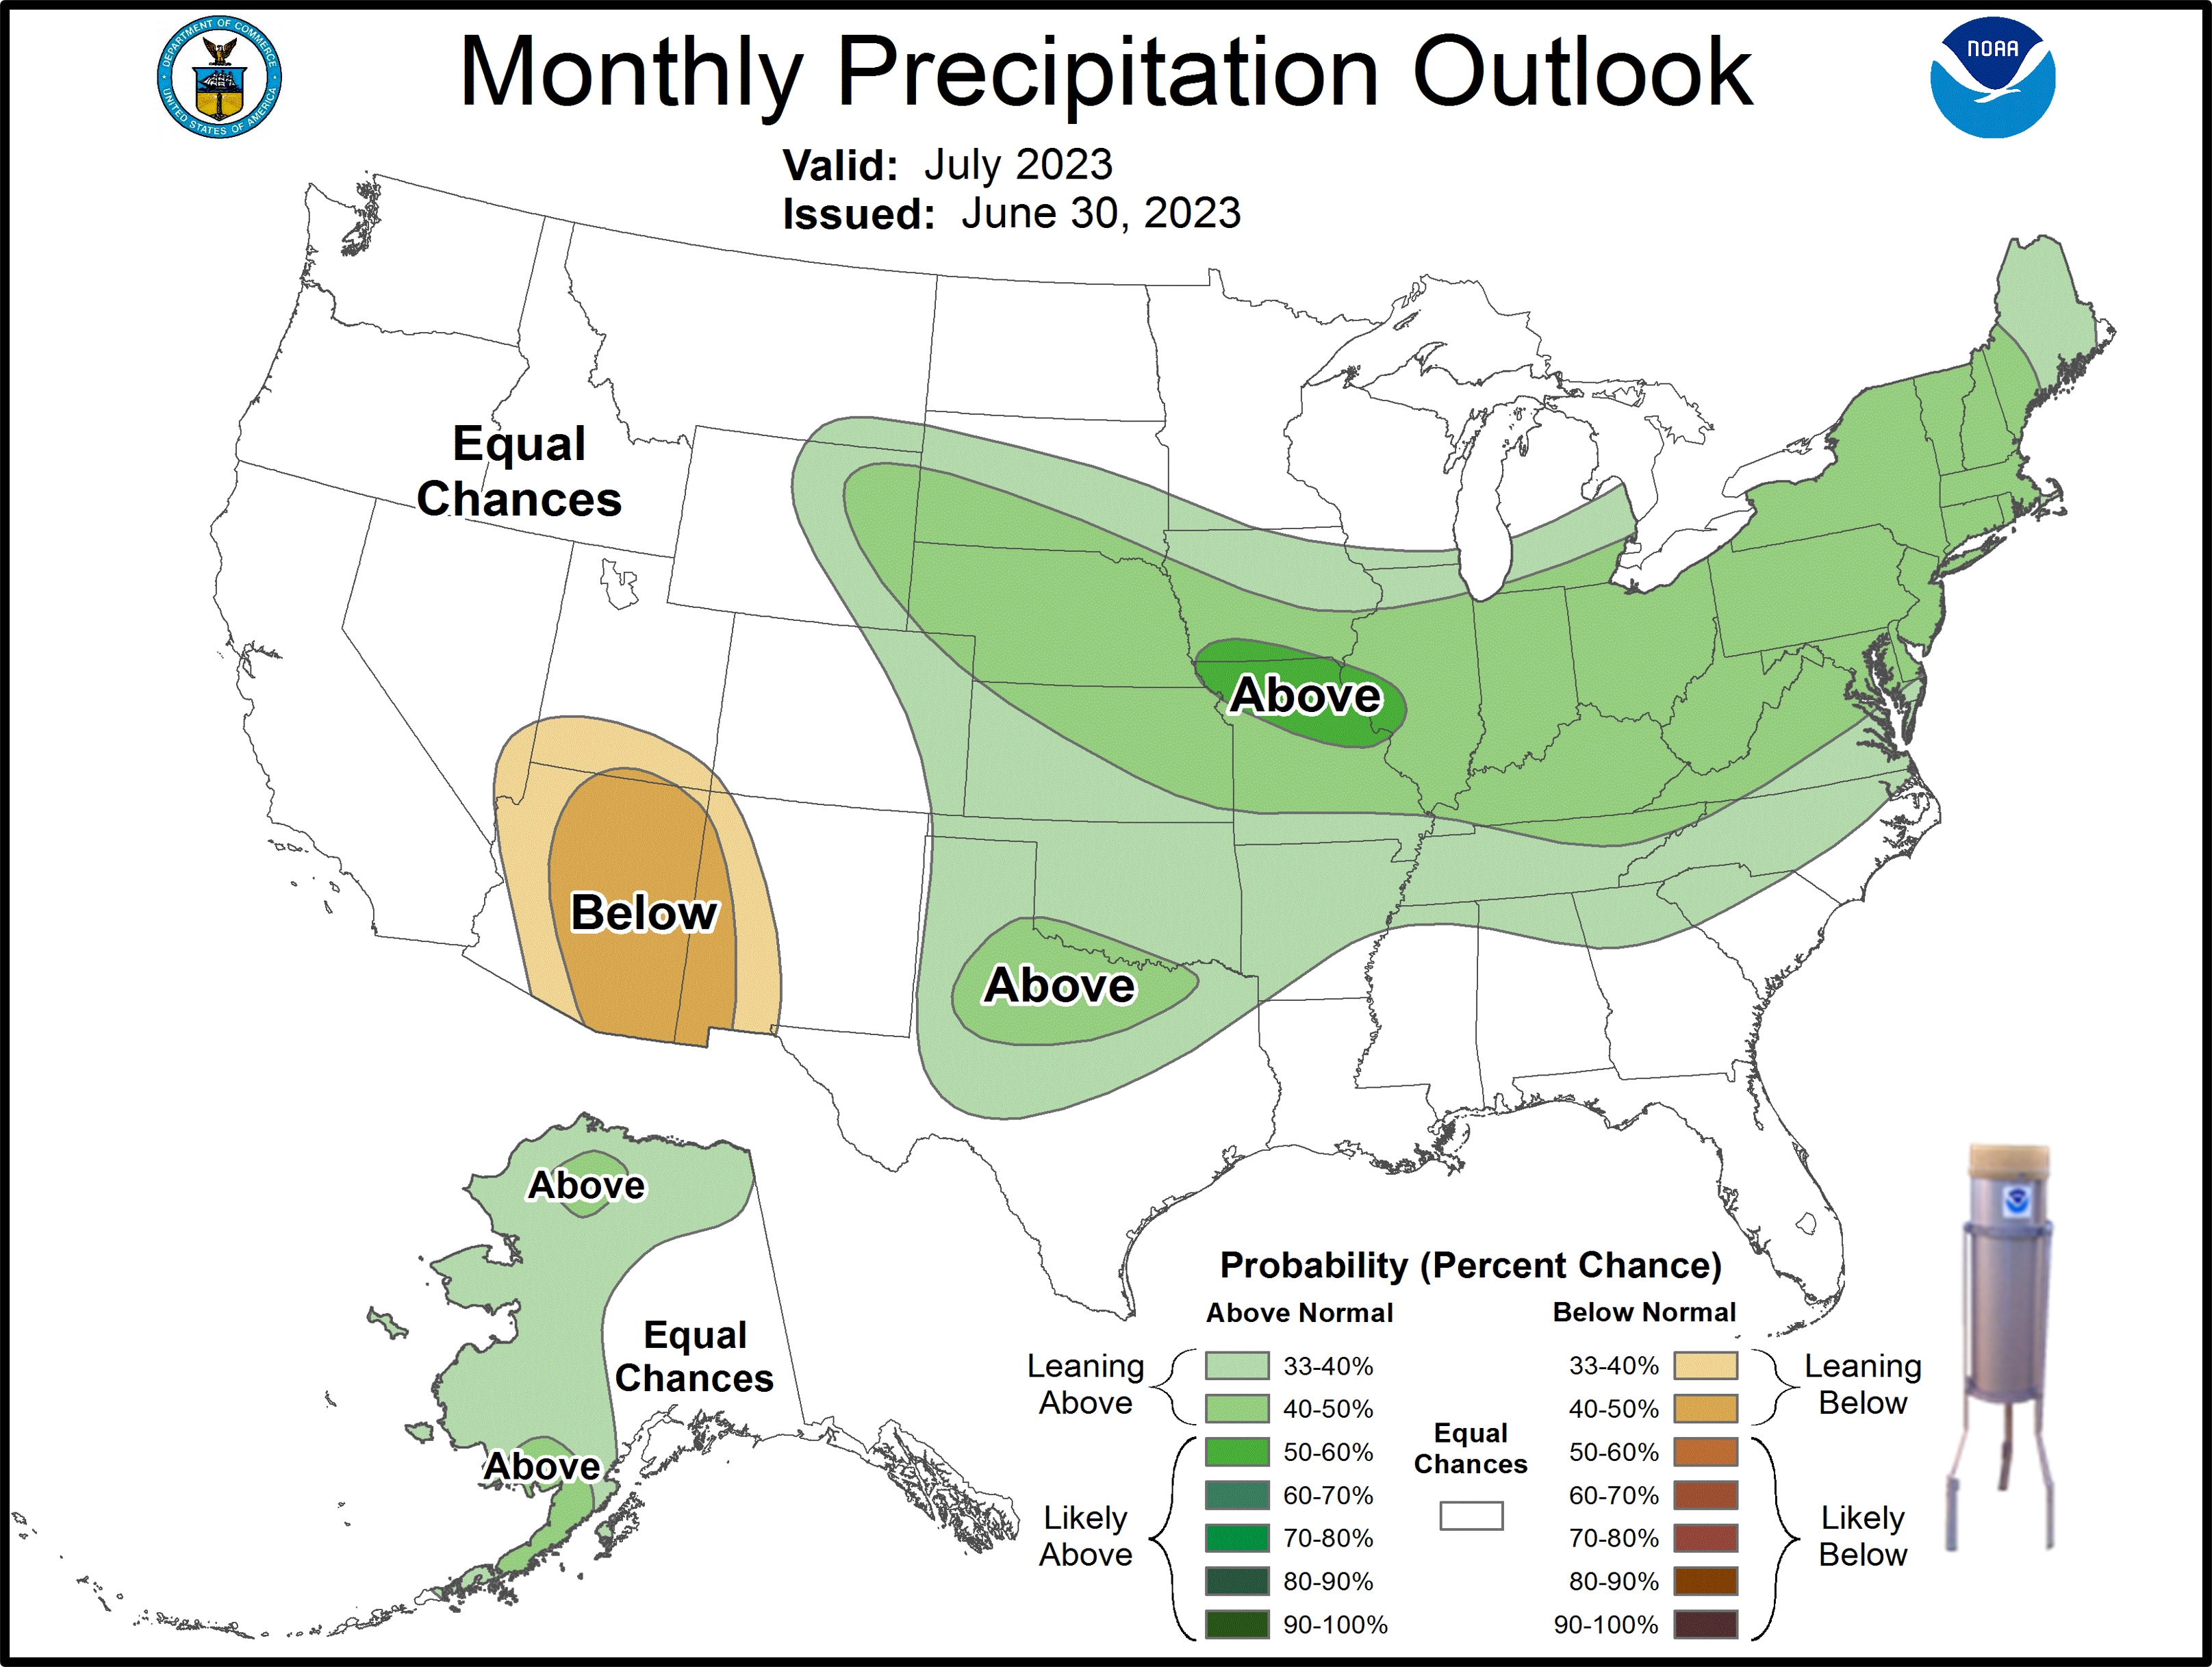
The latest temperature outlook for July leans warmer than normal with equal chances of above or below normal rainfall favored. NOAA predicts an above-normal hurricane season. It's highly encouraged to review your hurricane preparedness. Click on the Preparedness Tab on the NWS Mobile Tropical Webpage.
Click on the snap shots below to expand:
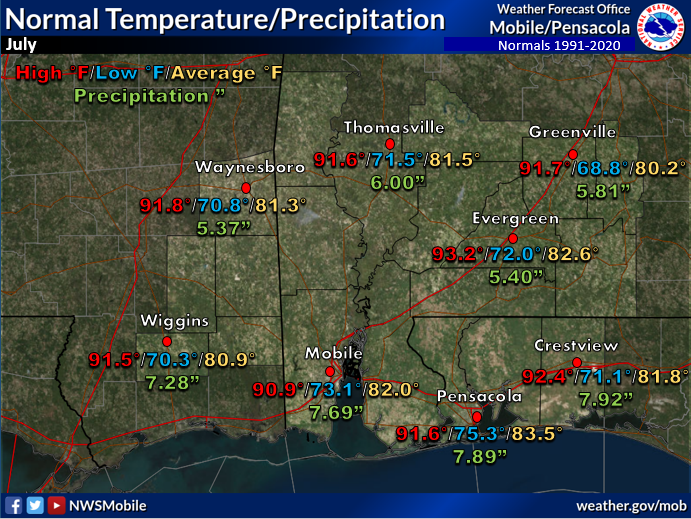 July Normals July Normals |
|
Outlook |

|
|
Additional Climate Links:
The links below are intended to provide additional climate information, education and outlooks. The National Weather Service Mobile Alabama's Climate and Past Weather page provides climate data at your fingertips for many observation points in the local forecast area by accessing the NOWData tab as well as many other climate resources. The Climate Prediction Center Link provides short and longer range climatic outlooks and education about the larger scale global circulations that impact temperatures and weather. With the large agriculture and farming presence along the central Gulf coast, the Drought Monitor link provides updates on drought trends and impacts. Another very helpful resource is the Community Collaborative Rain Hail and Snow (CoCoRaHS) network, which is a large group of volunteers working together to measure and map precipitation (rain, hail and snow). The aim of CoCoRaHS is to provide the highest quality data for natural resource, education and research applications. You can be a part of the CoCoRaHS team by becoming a volunteer rainfall observer. To learn more click on the CoCoRaHS link below.
National Weather Service Mobile AL Climate and Past Weather
Climate Prediction Center (CPC)
CoCoRaHS Network Water Year Summaries
![]()


