July 2024 Climate Summaries
Mobile Alabama and Pensacola Florida Area
Joe Maniscalco - Observation Program Leader (OPL)/Meteorologist
POC for Observation, Climate, and COOP
National Weather Service Mobile Alabama
August 2, 2024
July 2024 in Review - Despite a wet month, the Mobile area trended warmer against the climate normals in all the temperature metrics for the month in comparison to the Pensacola area. Mobile saw 27 days or 87% of the month where the high reached or exceeded 90.0° which was well above the monthly normal occurrence of 22 days. Morning temperatures were at or above normal the entirety of the month. In fact, the average low temperature took a seat at the record warmth table at number seven. The average temperature broke into the top 10 warmest, settling at the number 10 spot. Mobile saw three record high low temperatures in the month of July. After starting the month with a well above normal high temperature on day one, the Pensacola area saw monthly high temperatures below or much below normal for the remainder of the month outside of the 30th. Only 18 days saw the mercury reach at or above 90.0°, slightly below the monthly normal of 20 days. Overnight lows were just a hair above normal. No record temperatures were reached at Pensacola.
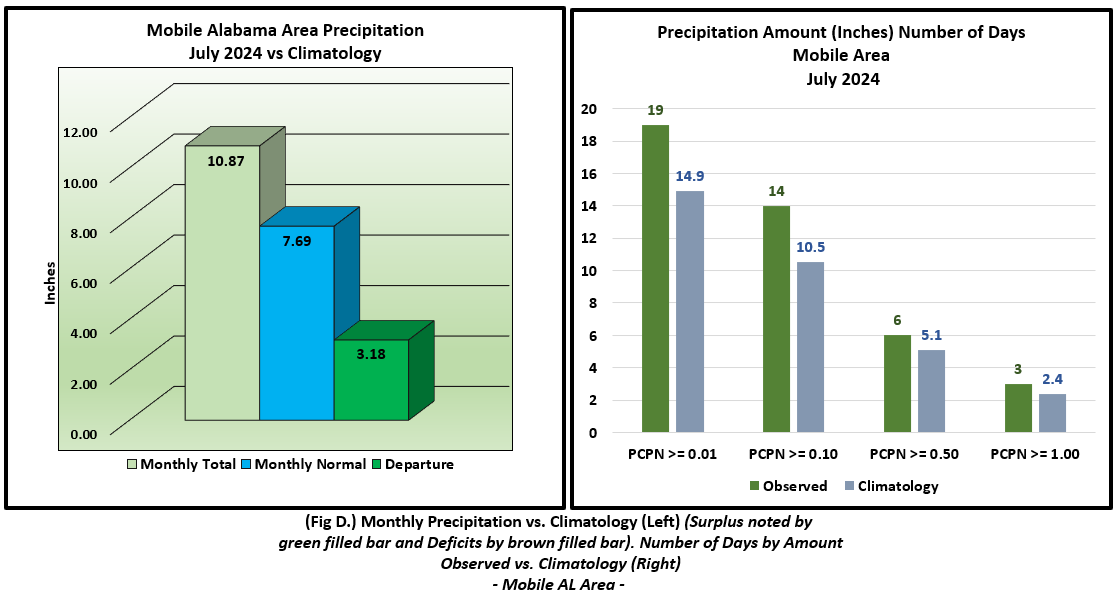
July was a convectively active month with the rain gauge swelling to well over ten inches at Mobile and well over eight inches at Pensacola. Both sites saw above normal rainfall with the highest surplus against the typical July monthly total occurring in Mobile at a little over three inches. Pensacola's rainfall was just shy of an inch above normal. Nearly 33% of the monthly rainfall total at Pensacola occurred on the 3rd, when a record one day rainfall of 2.90" was captured in the rain gauge.
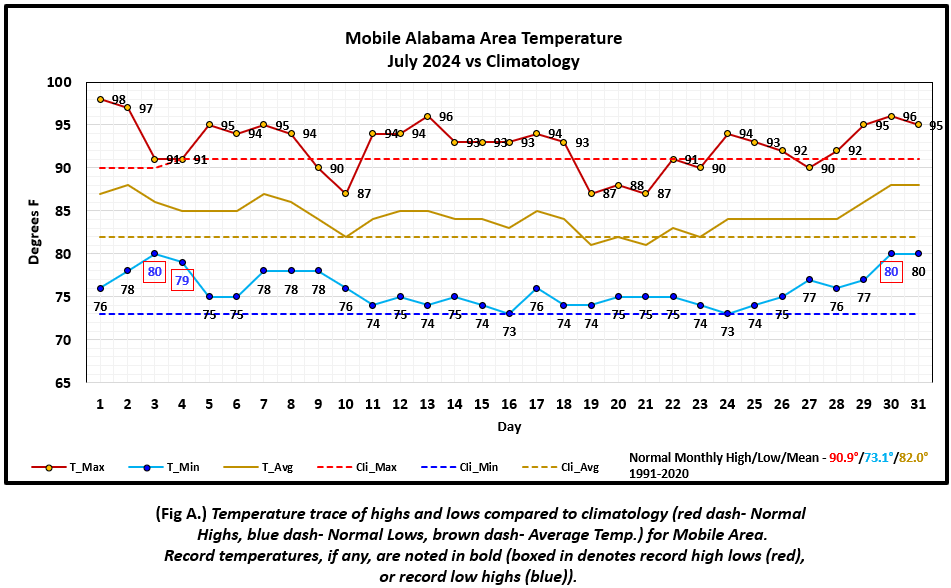
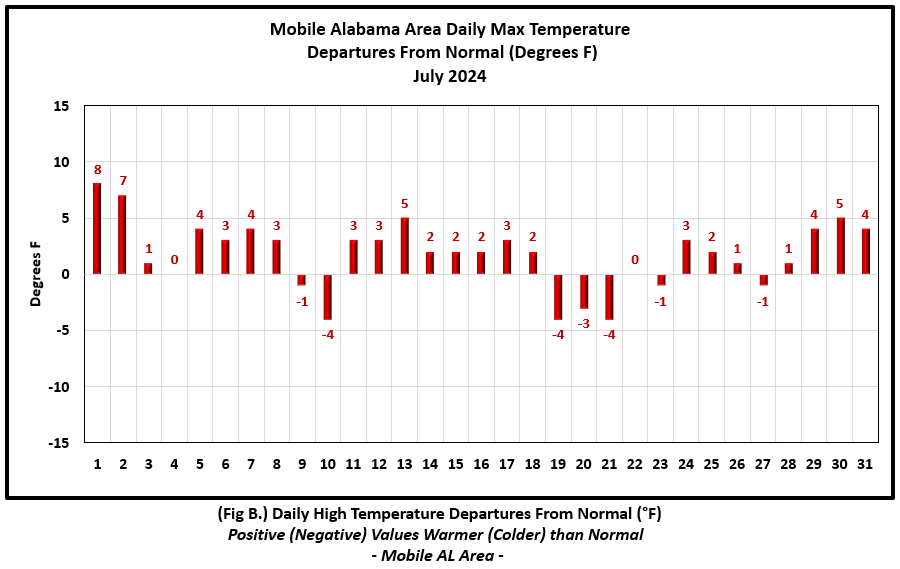
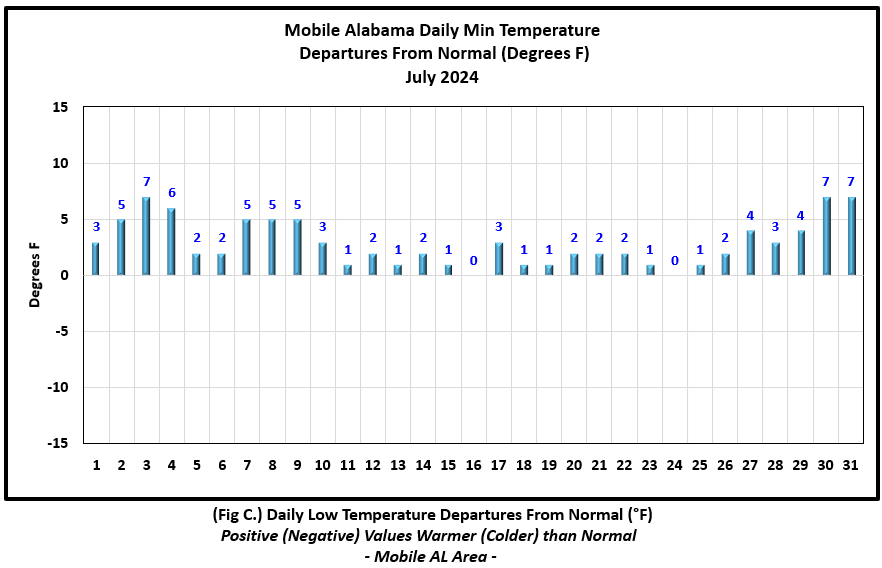
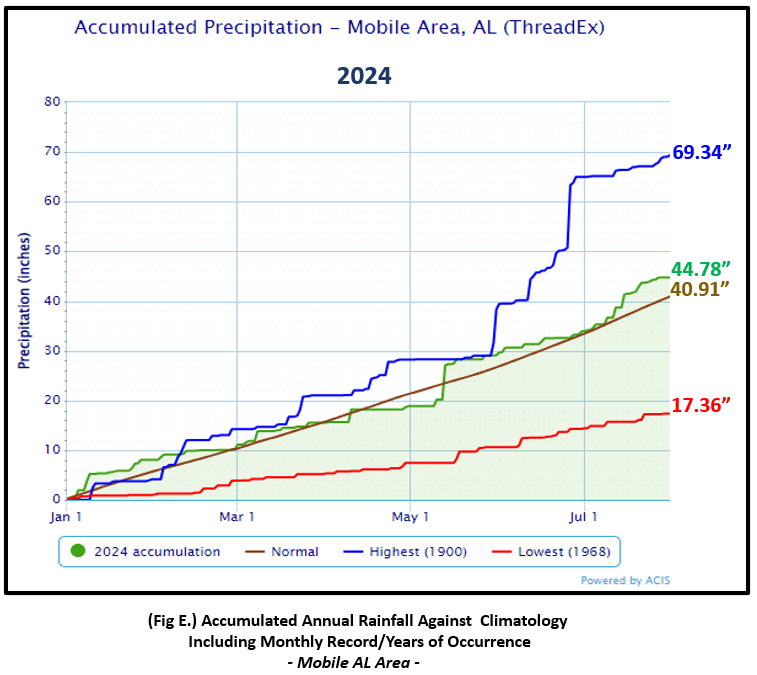
Mobile Alabama Area [Climate Normal Period 1991-2020, Climate Record Period 1872 to Present]- The average monthly high of 92.6° was 1.7° above normal. The average monthly low was 75.9° or 2.8° above normal and sits as the 7th warmest July average low temperature on record. The average monthly temperature of 84.3° was 2.6° above normal and sits at number 10 warmest July average temperature on record. The highest temperature for the month, 98° occurred on the 1st and 8° above the normal for the date. The lowest temperature for the month, 73° occurred on the 16th and 24th, normal for these days. Three record high low temperatures occurred during the month. 80° on the 3rd broke the previous record of 79° on this date set back in four other years, 1978, 1970, 1903 and 1897. 79° on the 4th tied the previous record on this date set back in 1928 and 1877. 80° on the 30th matched the previous record on this date set way back in 1877. (Fig. A) shows a graphical representation of how the Mobile area temperatures compared to the seasonal normal daily highs and lows, which are shown by the colored dashed lines. Bar graphs reflecting the daily high/low temperature departures from normal are provided in the table below (Figs. B and C). The rain gauge collected 10.87" (Fig. D), 3.18" above normal. A bar graph showing the number of days of occurrence of select precipitation amounts compared to climatological normals is also provided in (Fig. D). Annual rainfall of 44.78" (Fig. E), is in surplus by 3.87" above the normal annual accumulation to date.
July top records for the month during the Period of Record for the Mobile Area:
Click on the Mobile Alabama area climate graphics below to expand:
|
|
|
|
|
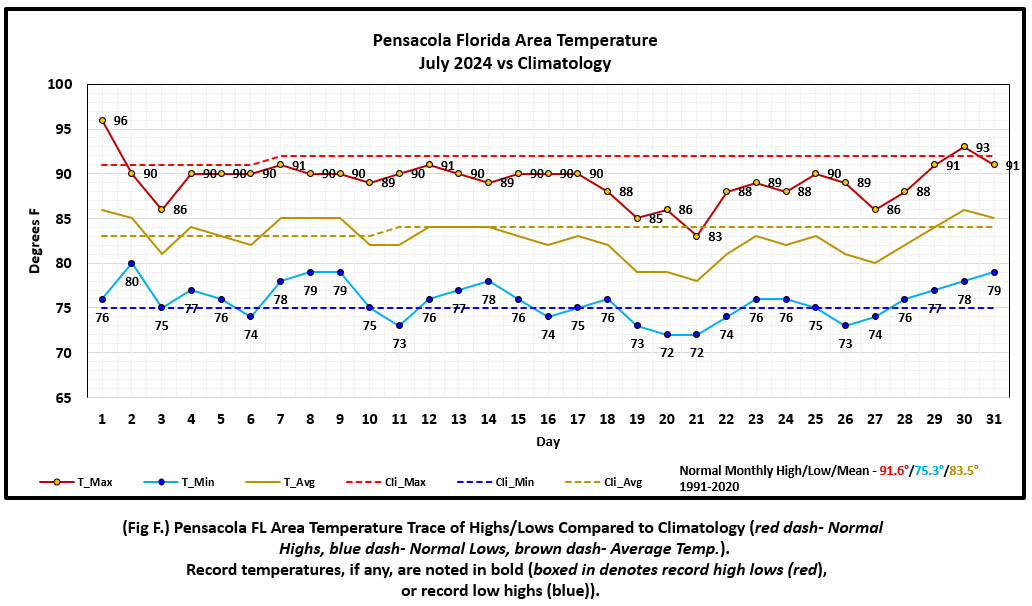
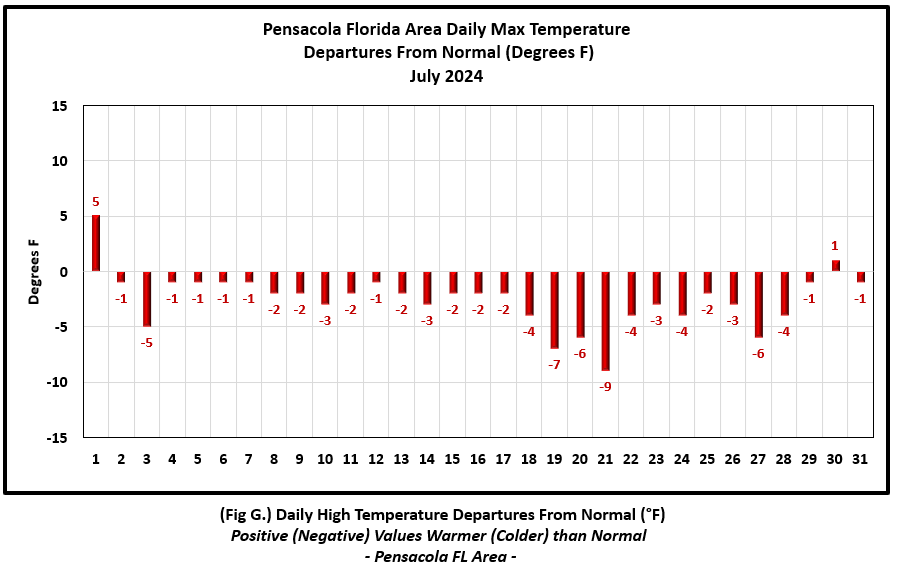
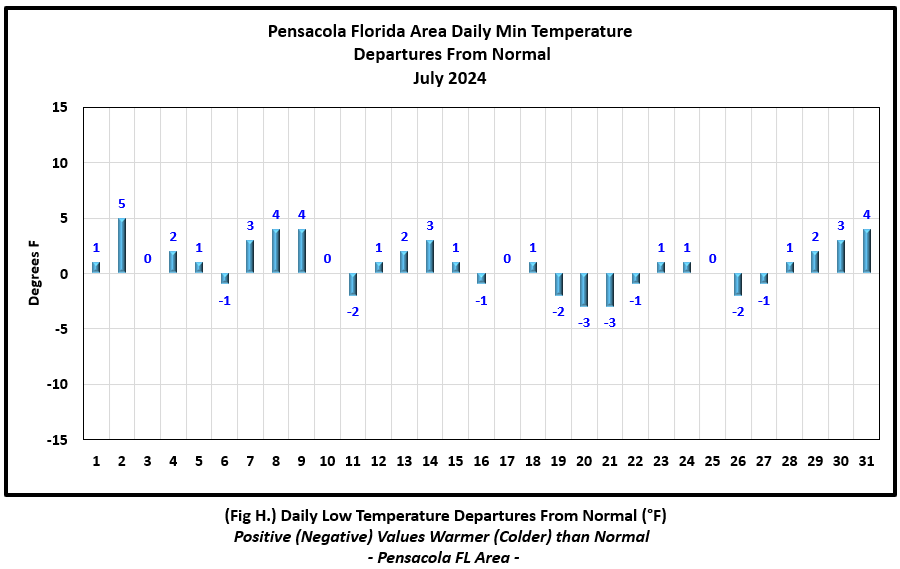
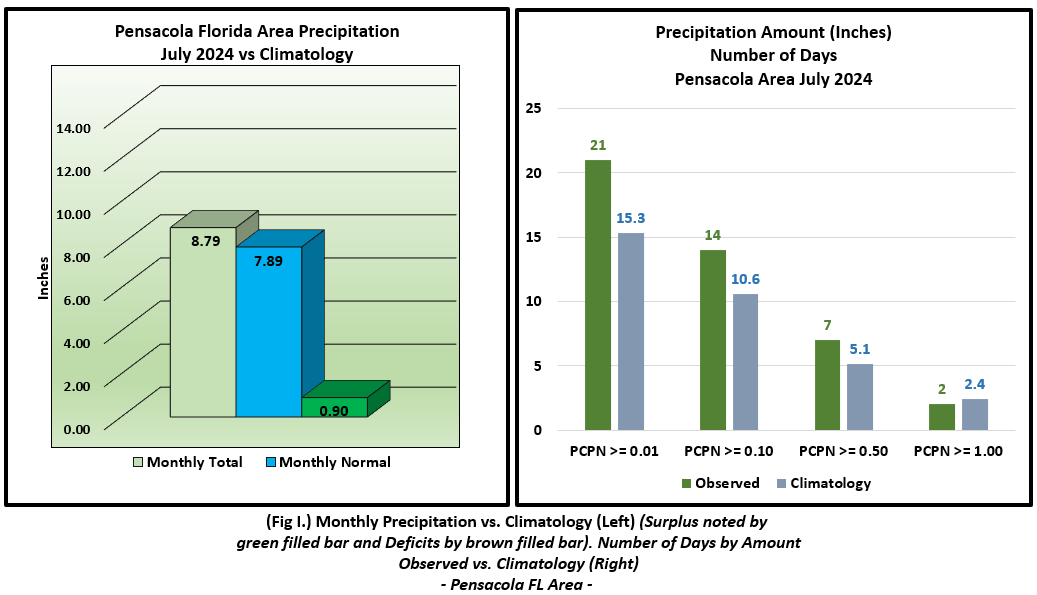
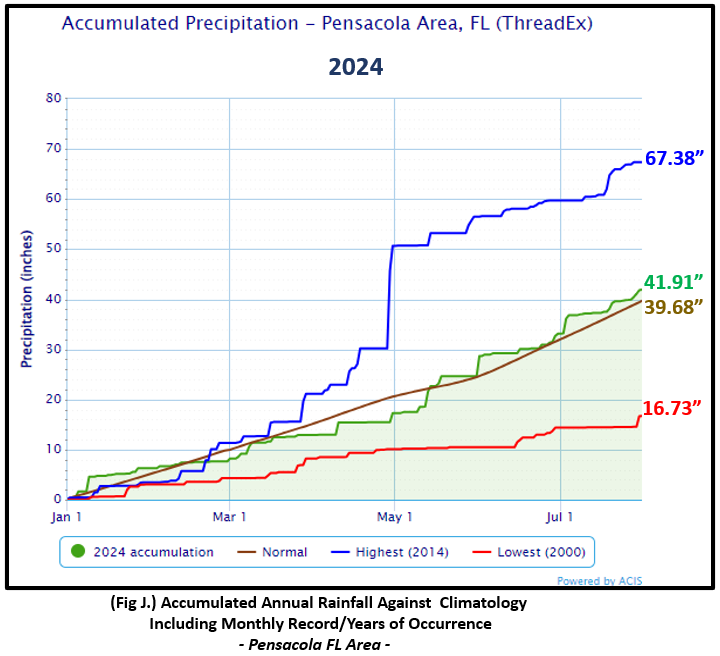
Pensacola Florida Area [Climate Normal Period 1991-2020, Climate Record Period 1879 to Present] - The average monthly high of 89.3° was 2.3° below normal. The average monthly low was 75.8° or 0.5° above normal. The average monthly temperature of 82.5° was 1.0° below normal. The highest temperature for the month, 96° on the 1st was 5° above the normal daily high temperature for this date. The lowest temperature for the month, 72° on the 20th and 21st, was 3° below the normal daily low temperature for these two days. No record temperatures were reached during the month. (Figs. G and H) shows the daily high/low temperature departures from normal. The rain gauge collected 8.79" (Fig. I), or 0.90" above July normal rainfall. 2.90" of rain on the 3rd set a new one day record rainfall; the previous record for the date was 1.78" set in 1940. A bar graph showing the number of days of occurrence of select precipitation amounts compared to climatological normal is also shown in (Fig. I). Annual rainfall of 41.91" is in surplus by 2.23" above normal to date. (Fig. J).
July top records for the month during the Period of Record for the Pensacola Area:
Click on the Pensacola Florida area climate graphics below to expand:
|
|
|
|
|
Additional July 2024 Climatology and Topics
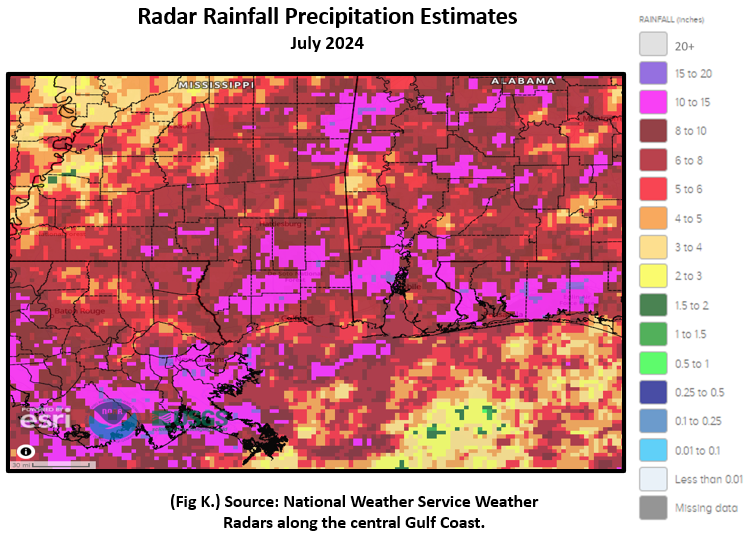
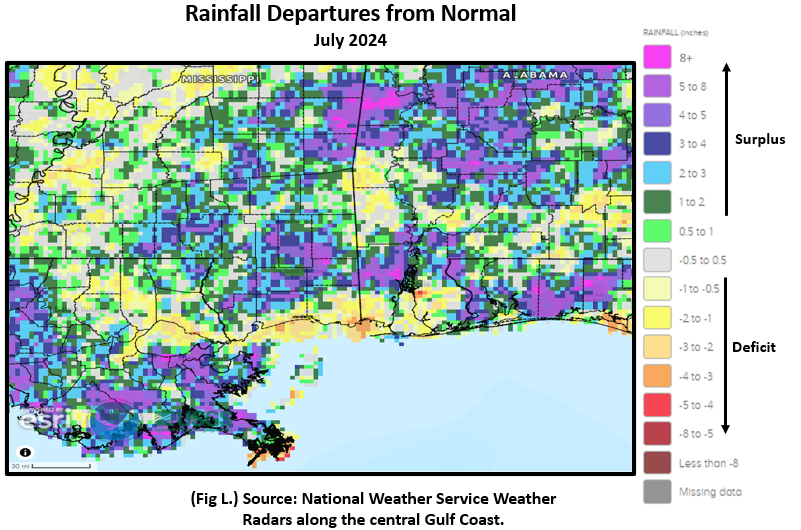
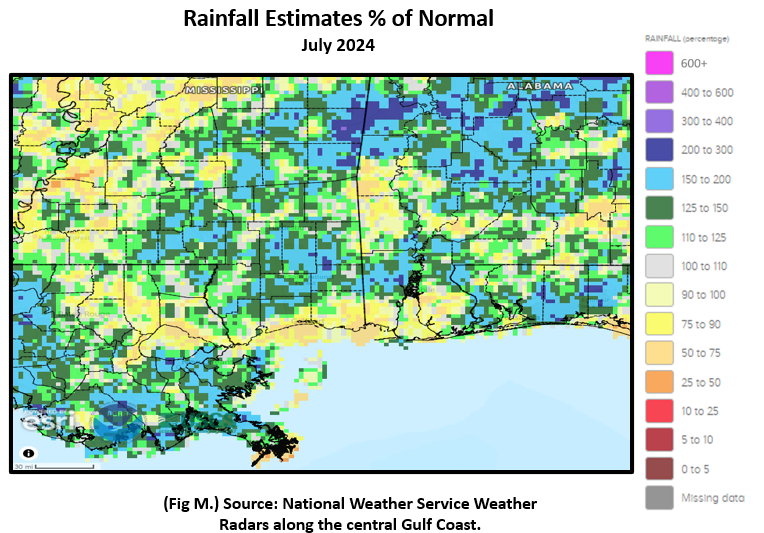
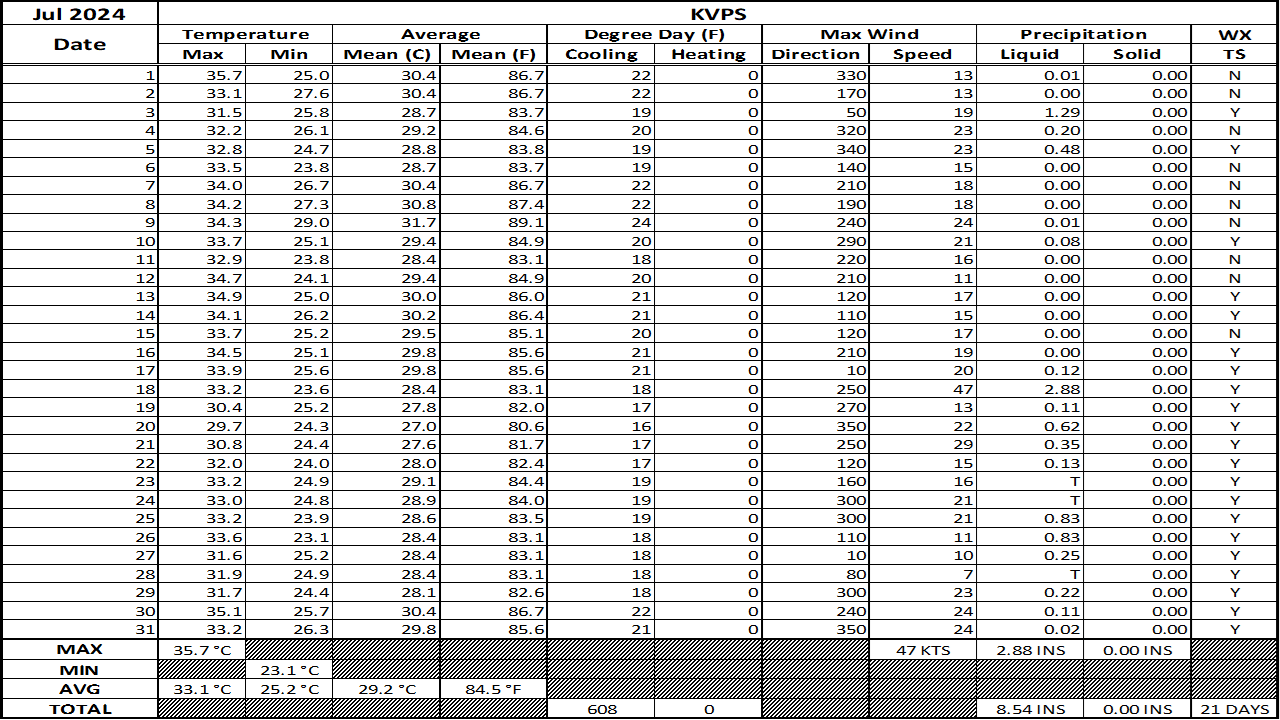
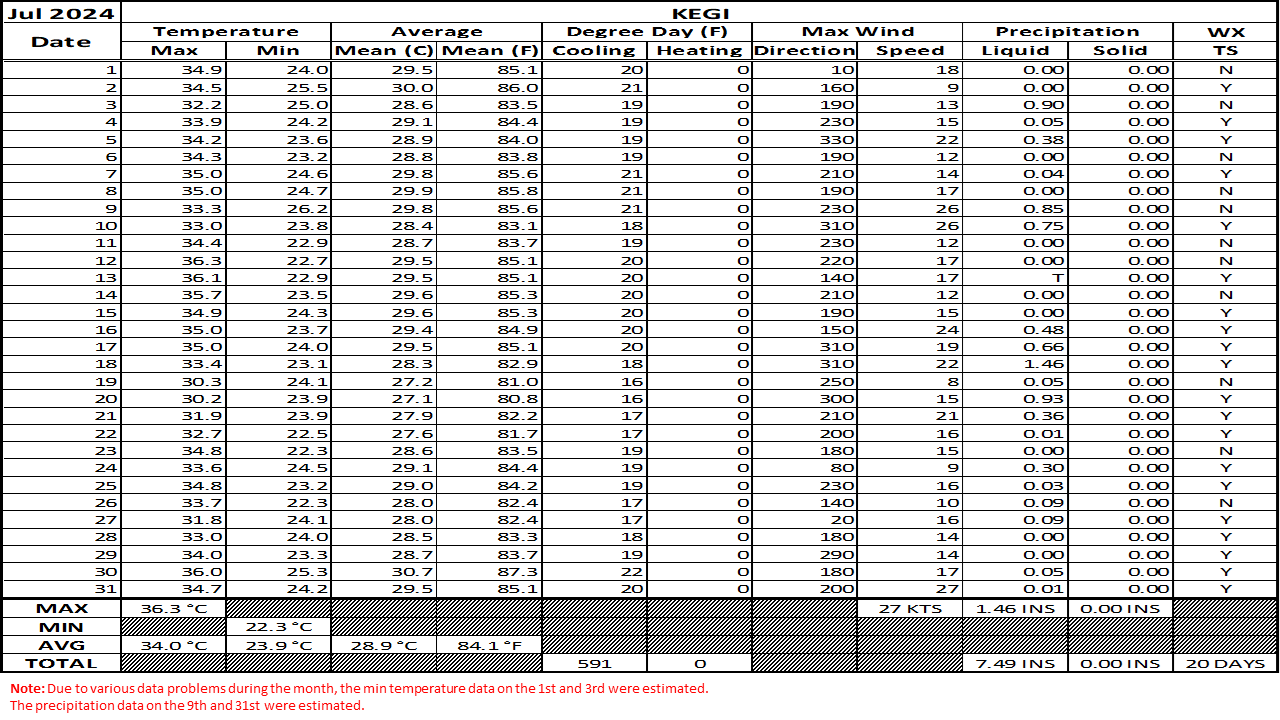
The footprint of excessive rains, exceeding 10" and well above normal July rainfall, was focused over southern portions of the interior of southeast MS, eastward to across and south of the I-10 corridor. Another area was highlighted up across and north of U.S. Highway 84. These areas saw upwards of 150 to 300% of normal monthly rainfall. (Fig. K) shows the areal distribution of monthly rainfall, (Fig. L) shows the areal rainfall departures from normal and (Fig. M), the areal percent of normal rainfall. The latest July 2024 monthly summary for Eglin Air Force Base (KVPS) and Duke Field (KEGI) has been received and provided in the table below. The temperatures in the daily tables consists of numbers both in °F/°C. Data courtesy of Mr. David Biggar, Staff Meteorologist, 96th Weather Squadron. Provided by permission.
|
|
|

|
|
|
August 2024 Climatology, Seasonal Climatology and Outlooks:
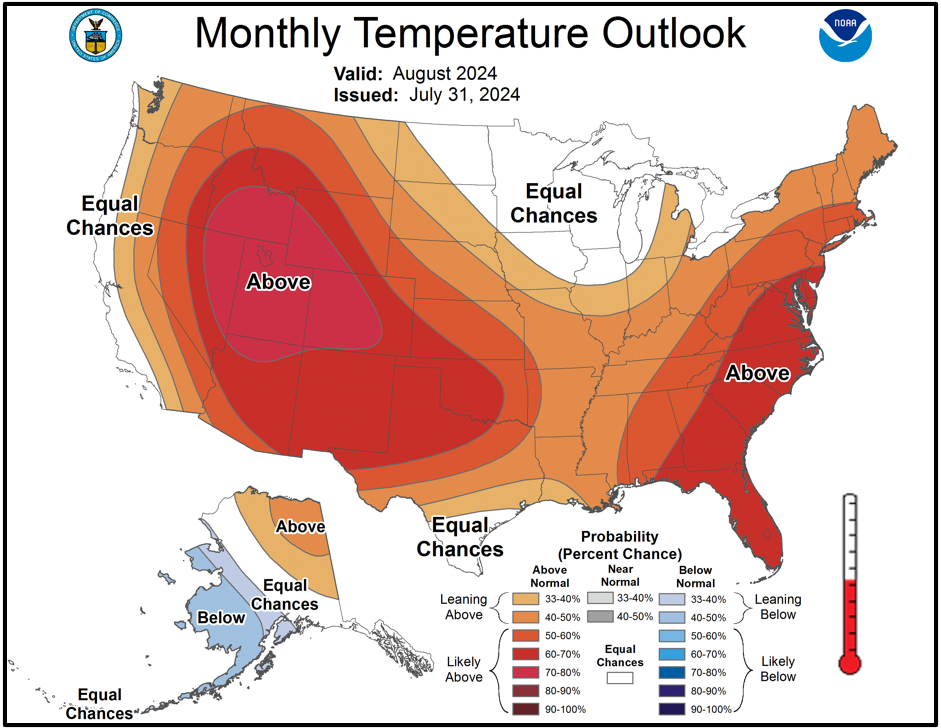
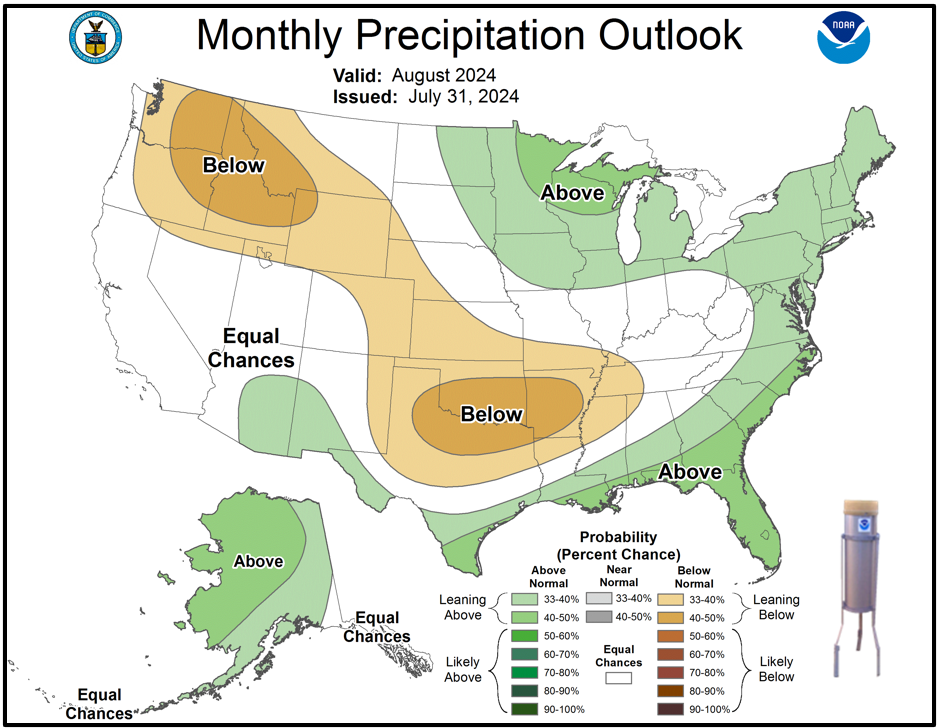
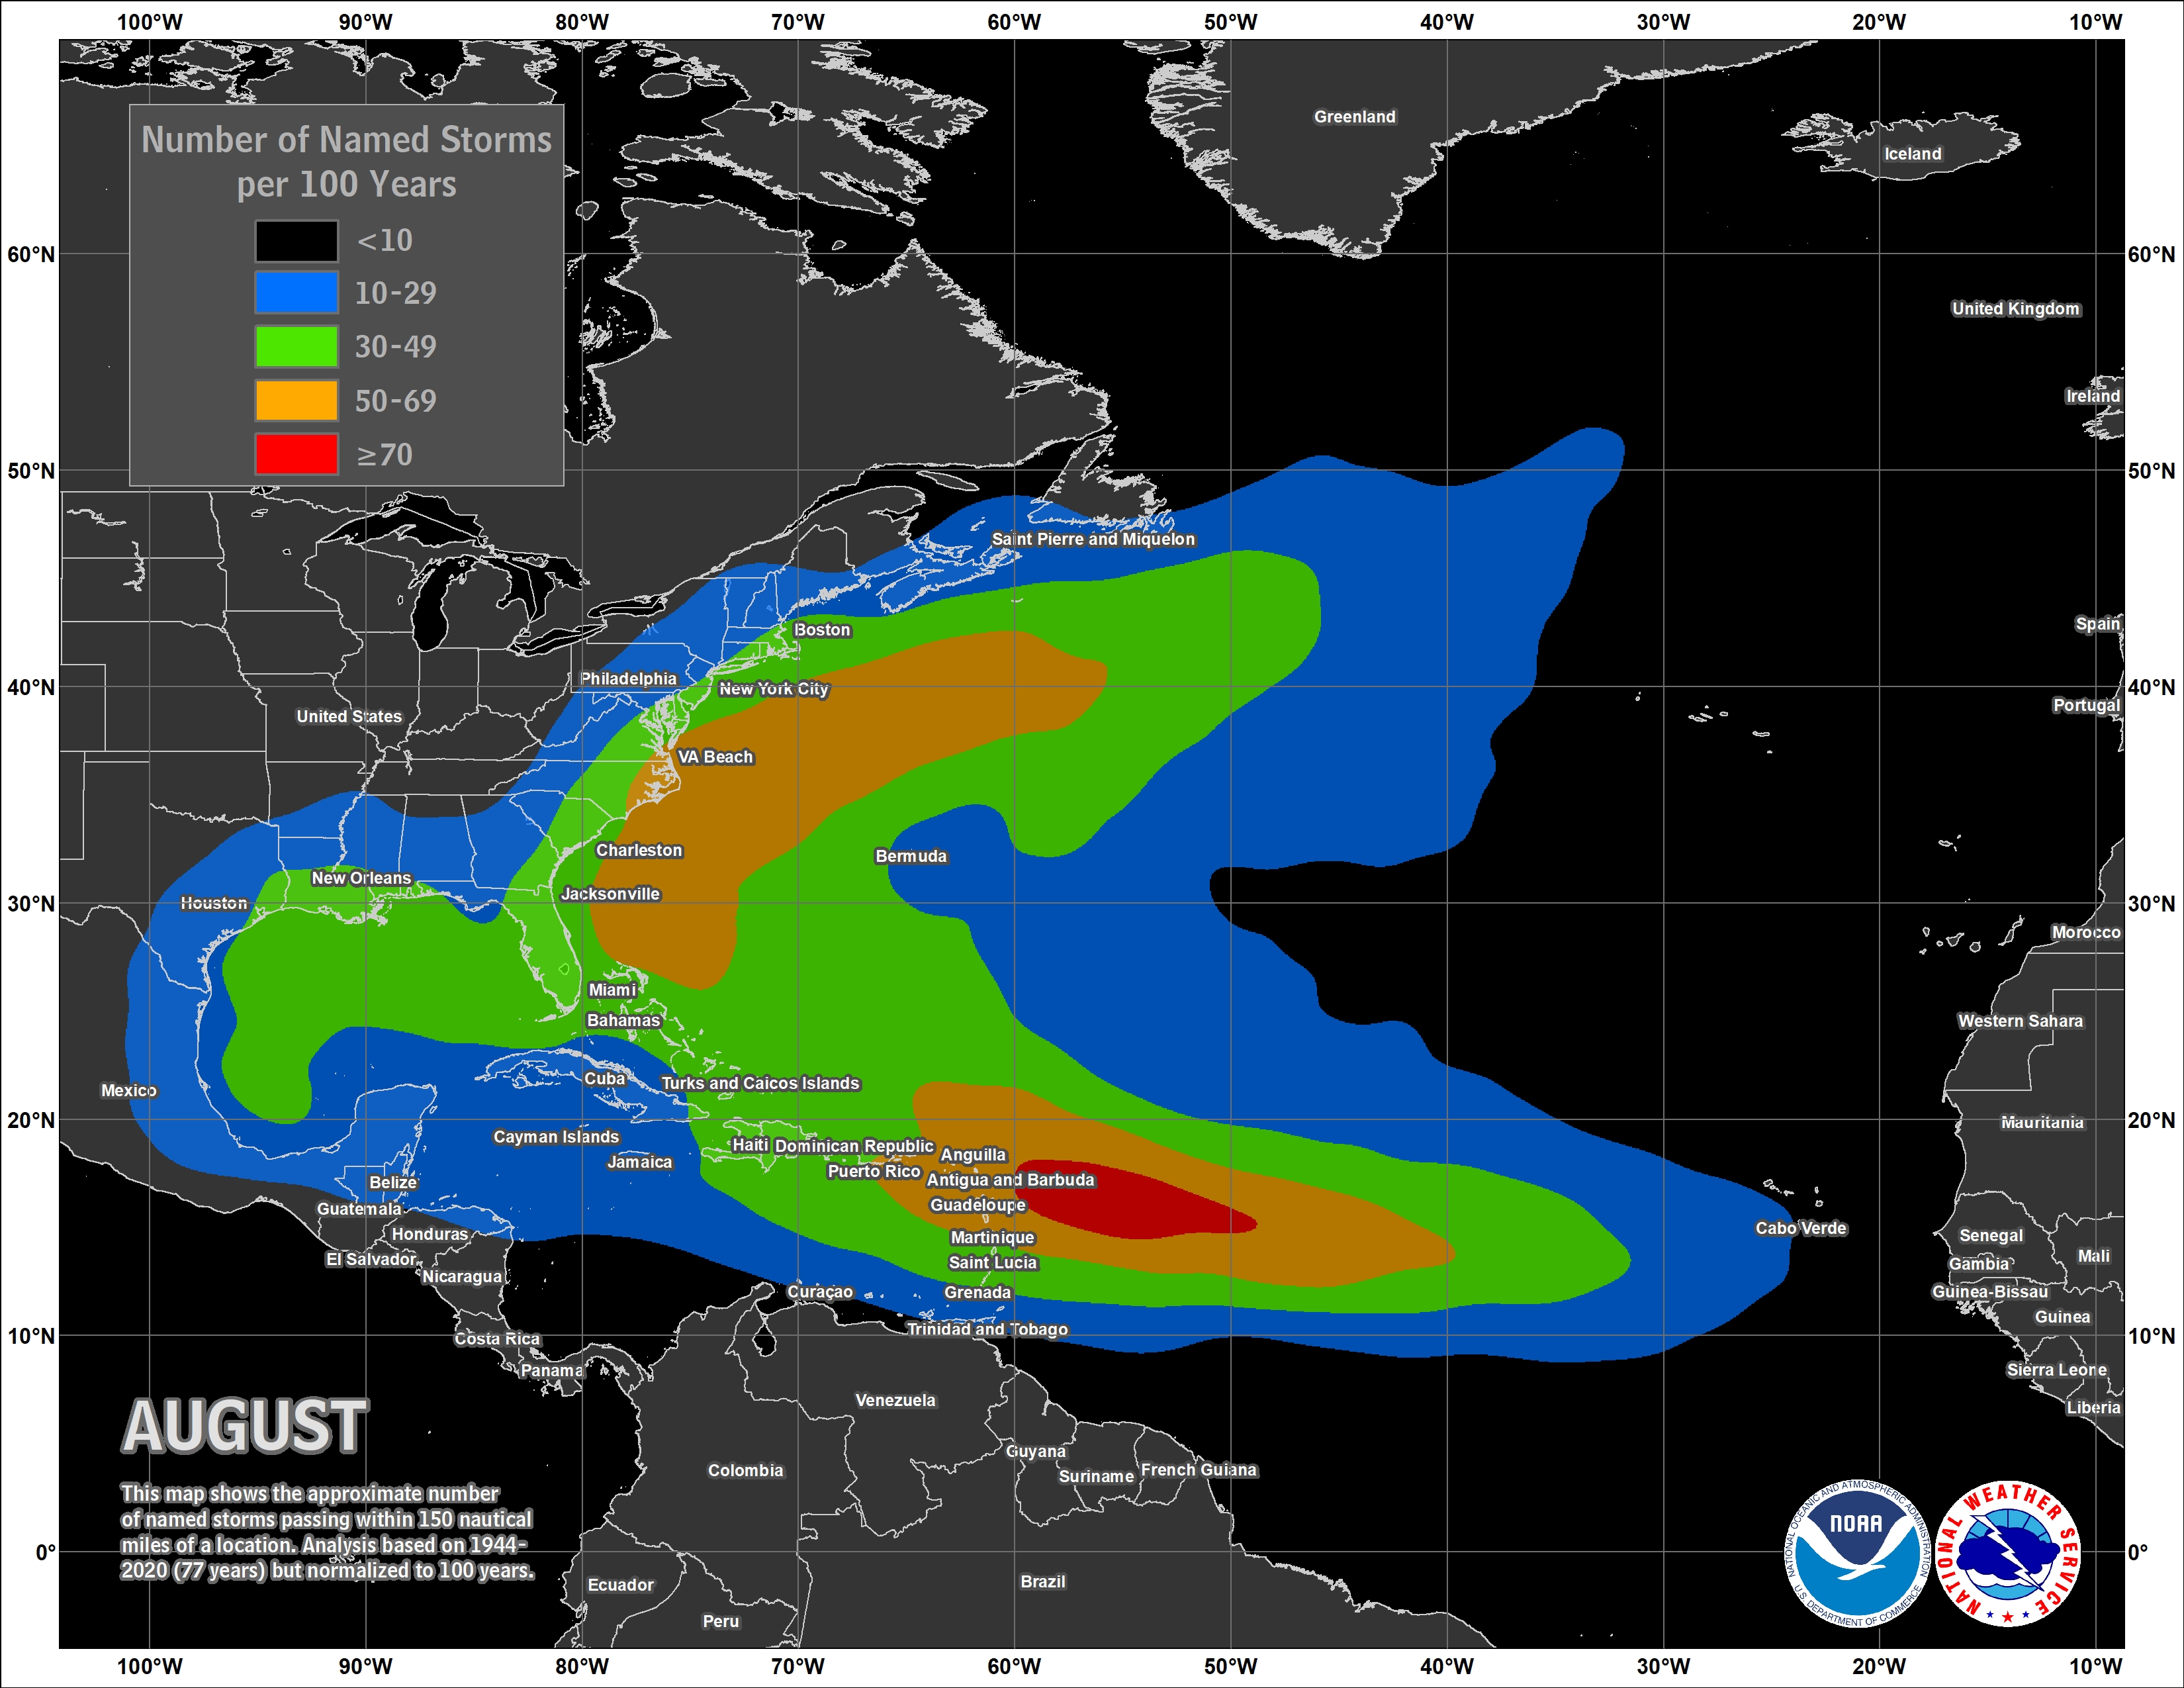
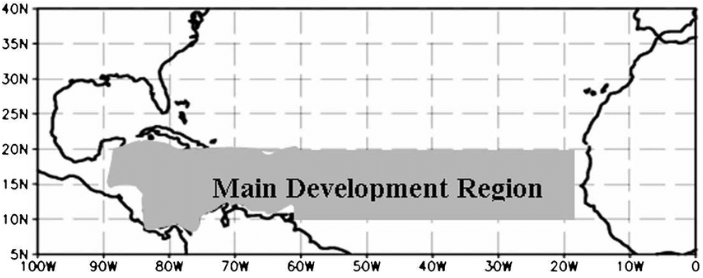
August temperatures are favored to be likely above normal over southeast MS, eastward to the Mid Atlantic and FL Panhandle where probabilities of above normal temperatures are favored highest. Precipitation leans above normal over the Gulf Coast. At the beginning of month three in the Atlantic Basin Hurricane Season, typical development of new systems for August expands eastward into the Atlantic. Lending to the 2024 outlook for above normal tropical cyclone numbers is a number of favorable factors, including near-record warm oceanic temperatures in the Atlantic Ocean, development of La Niña conditions in the Pacific, reduced Atlantic trade winds, less wind shear and an above normal west African Monsoon which can produce well defined African easterly waves moving off west African coast and across the central Atlantic's Main Development Region (MDR). We also continue in the warm phase of the Atlantic Multi-Decadal Oscillation which is also a prominent link in the active tropical cyclone era we are in. See the link to the outlook below. Note: The Atlantic Basin Hurricane Outlook will be updated in early August. It's highly encouraged to review your hurricane preparedness. Click on the Preparedness Tab on the NWS Mobile Tropical Webpage.
Click on the snap shots below to expand:
 August Normals August Normals |
|
Outlook |

|
|

|

|
Additional Climate Links:
The National Weather Service Mobile Alabama's Climate and Past Weather page provides climate data at your fingertips for many observation points in the local forecast area by accessing the NOWData tab as well as many other climate resources. The Climate Prediction Center Link provides short and longer range climatic outlooks and education about the larger scale global circulations that impact temperatures and weather. With the large agriculture and farming presence along the central Gulf coast, the Drought Monitor link provides updates on drought trends and impacts. Another very helpful resource is the Community Collaborative Rain Hail and Snow (CoCoRaHS) network, which is a large group of volunteers working together to measure and map precipitation (rain, hail, and snow). The aim of CoCoRaHS is to provide the highest quality data for natural resource, education and research applications. You can be a part of the CoCoRaHS team by becoming a volunteer rainfall observer.
Questions or Comments:
Contact: Joe Maniscalco - Observation Program Leader WFO Mobile, AL at joe.maniscalco@noaa.gov


