July 2021 Climate Summaries
Mobile Alabama and Pensacola Florida Area
National Weather Service Mobile Alabama
August 11, 2021
July 2021 in Review - With the majority of the month being cloudy and wet, there was a long stretch of below normal temperatures for the first three weeks of the month for both Mobile and Pensacola. The lowest high for the month at Mobile occurred on the 6th at 78.0° or 13° below normal for this date and was shy a degree from reaching a record low high temperature. The average high temperature during the three week stretch was 4.9° below normal for the Mobile area and 3.2° below normal for the Pensacola area. The clouds broke and heat returned with high temperatures rising to above normal to close out the month for both sites. Overnight lows were close to normal for Mobile. Overnight lows the first three weeks at Pensacola were close to normal, trending to more above normal to close out the month. Only one record temperature was set and that was at Pensacola when a record high low temperature was reached on the 22nd.
68% and 74% of the month saw measurable rain (Greater than or equal to 0.01") at Mobile and Pensacola, respectively. Annual rainfall to date continues to show a significant surplus.
Mobile Alabama Area [Climate Normal Period 1991-2020, Climate Record Period 1872 to Present]- The average monthly high of 88.5° was 2.4° below normal. The average monthly low was 72.9° or 0.2° below normal. The average monthly temperature of 80.7° was 1.3° below normal. The highest temperature for the month, 95° on the 28th and 29th was 4° above the normal for these days. The lowest temperature for the month, 69° on the 13th, was 4° below normal for this date. No record temperatures were reached. (Fig. A) shows a graphical representation of how the Mobile area temperatures compared to the seasonal normal daily highs and lows, which are shown by the colored dashed lines. Bar graphs reflecting the daily high/low temperature departures from normal are provided in the table below (Figs. B and C). The rain gauge collected another several inches at 8.05" (Fig. D), fairly close to the monthly normal 7.69". Something new this month is a bar graph showing the number of days of occurrence of select precipitation amounts compared to climatological normals also shown in (Fig. D). The surplus in annual rainfall continues to rise (Fig. E) now surpassing just over 11" above normal to date.
July top records for the month during the Period of Record for the Mobile Area:
Click on the Mobile Alabama area climate graphics below to expand:

|

|

|

|

|
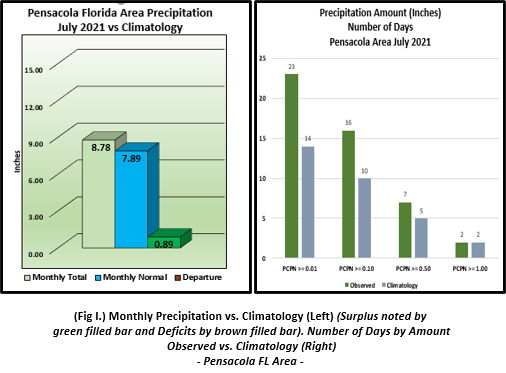
Pensacola Florida Area [Climate Normal Period 1991-2020, Climate Record Period 1879 to Present] - The average monthly high of 90.4° was 1.2° below normal. The average monthly low was 76.1° or 0.8° above normal. The average monthly temperature of 83.3° was 0.2° below normal. The highest temperature for the month, 97° on the 12th was 5° above the normal daily high temperature for this date. The lowest temperature for the month, 73° on the 12th, was 2° below the normal daily low temperature for this date. One record temperature was reached. A warm morning on the 22nd, with a low of 80°, tied a record high low temperature which last occurred on this date in 2015. (Fig. F) shows a graphical representation of how the Pensacola area temperatures compared to the seasonal normal daily highs and lows, which are shown by the colored dashed lines. (Figs. G and H) shows the daily high/low temperature departures from normal. The rain gauge collected another several inches at 8.78" (Fig. I), nearly an inch above the monthly normal 7.89". Something new this month is a bar graph showing the number of days of occurrence of select precipitation amounts compared to climatological normals also shown in (Fig. I). The surplus in annual rainfall has held nearly steady since last month at over 11" above normal to date. (Fig. J).
July top records for the month during the Period of Record for the Pensacola Area:
Click on the Pensacola Florida area climate graphics below to expand:

|

|

|
|

|
Additional July 2021 Climatology and Topics
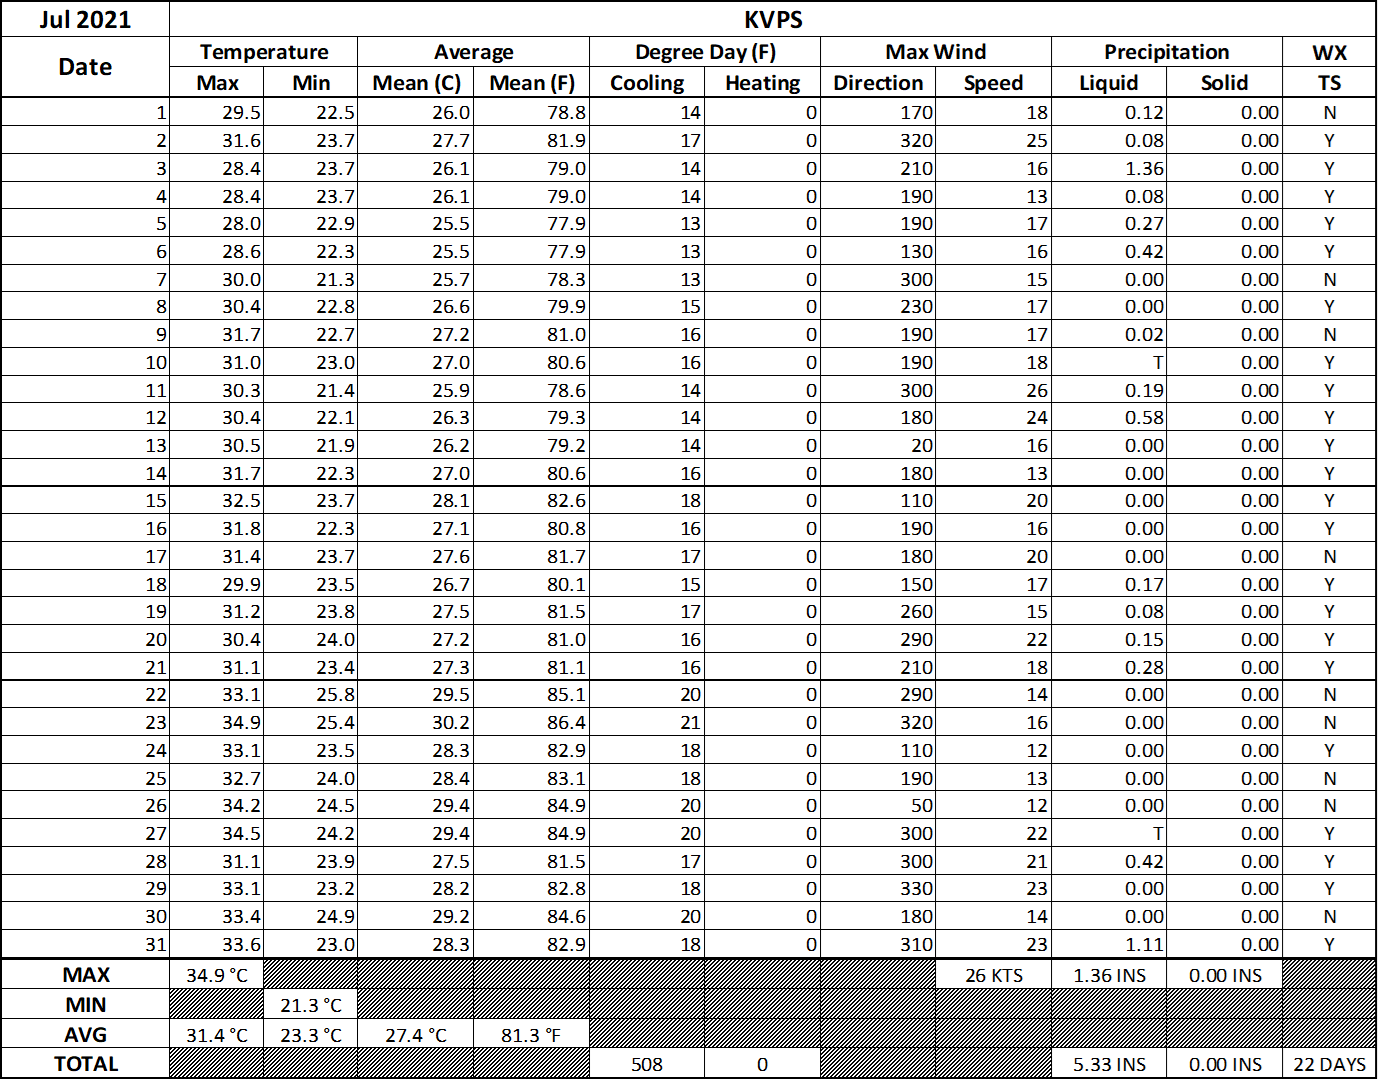
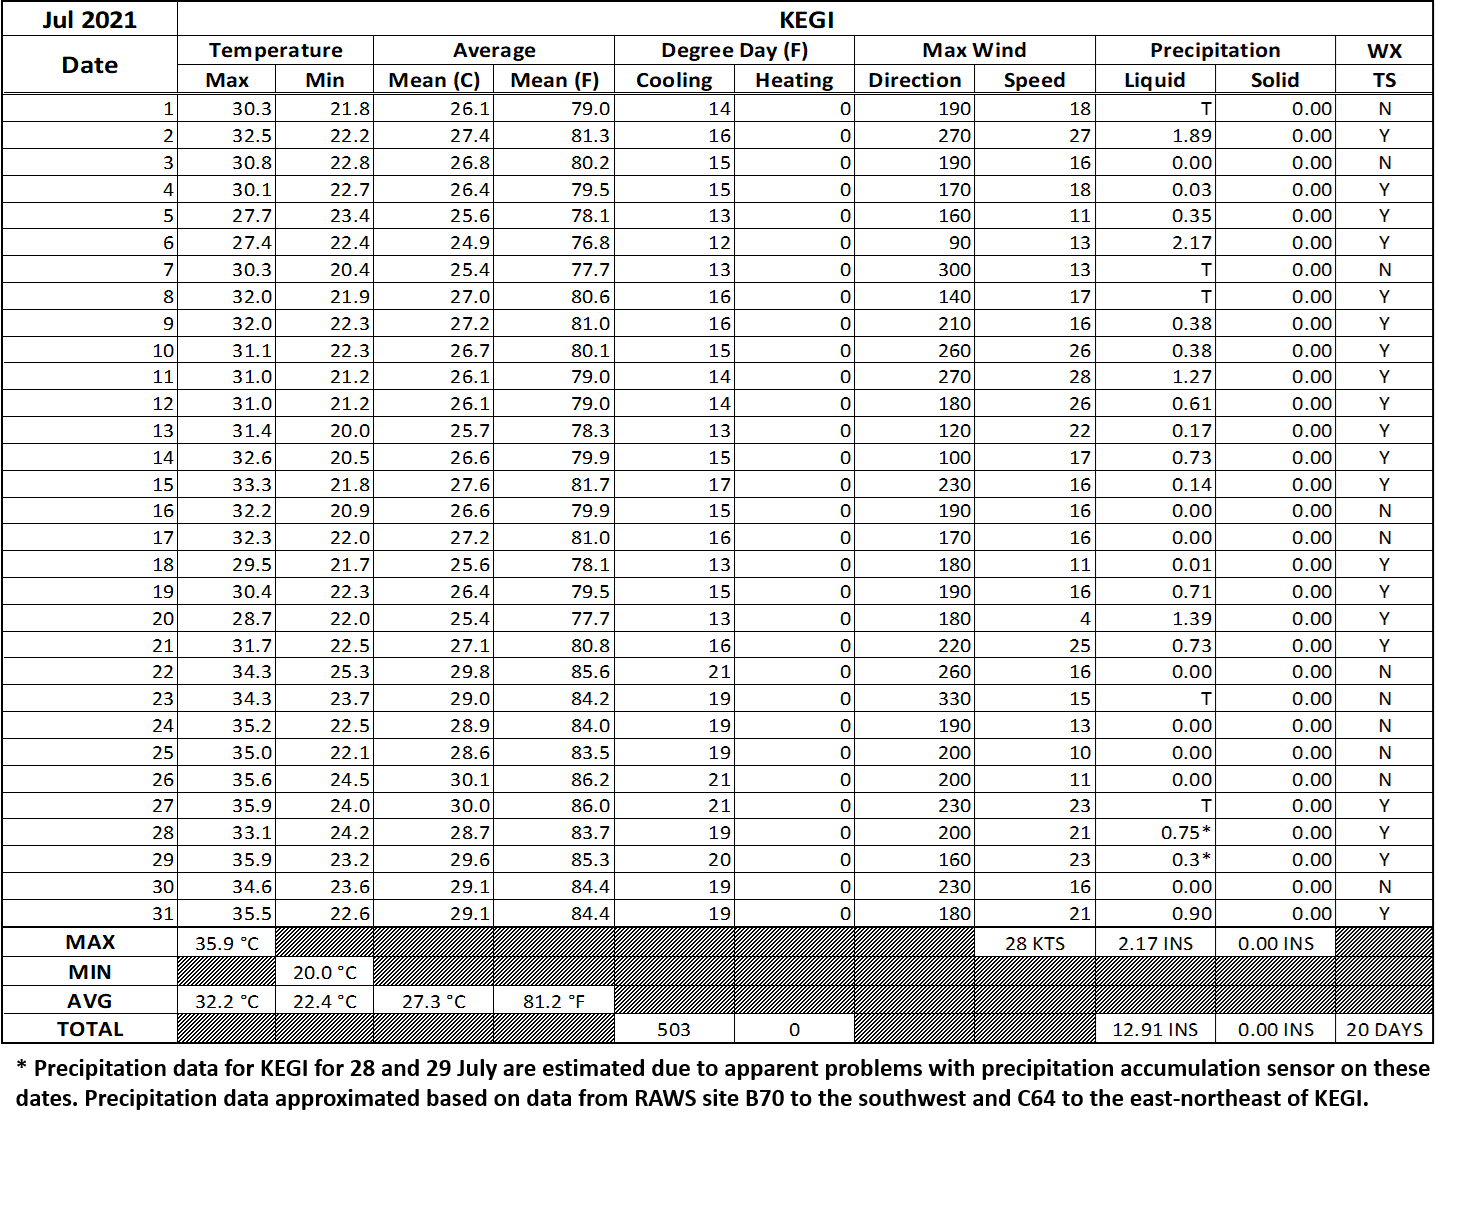
The latest July 2021 monthly summary for Eglin Air Force Base (AFB) - KVPS and Duke Field - KEGI has been received and provided in the table below. The temperatures in the daily tables consists of numbers both in °F/°C. Data courtesy of Mr. David Biggar, Staff Meteorologist, 96th Weather Squadron. Provided by permission.

|
|
|
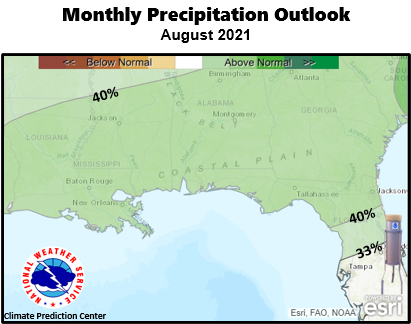
August 2021 Climatology, Seasonal Climatology and Outlooks:
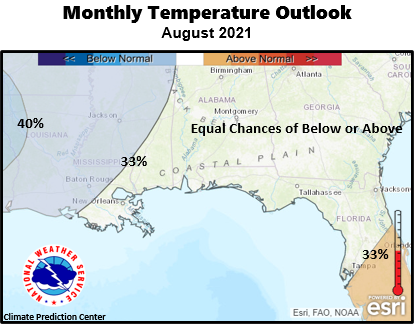
The latest outlook for August favors a wet pattern. Below normal temperatures are favored over the Lower Mississippi River Valley and equal chances of above or below normal temperatures east, over the Coastal Plain. With current atmospheric and oceanic conditions remaining conducive for tropical activity, NOAA has updated its forecast for the Atlantic Basin Hurricane Season, with storm numbers expected to remain above average. Take note: we are heading into the climatologically favored peak of the hurricane season which is August and September. Remember, all it takes is one storm's impacts over the local area to make it a bad year. It's highly encouraged to review your hurricane preparedness. Click on the Preparedness Tab on the NWS Mobile Tropical Webpage.
Click on the snap shots below to expand:
 August Normals August Normals |
|
Outlook |

|

|

|
Additional Climate Links:
The links below are intended to provide additional climate information, education and outlooks. The National Weather Service Mobile Alabama's Climate and Past Weather page provides climate data at your fingertips for many observation points in the local forecast area by accessing the NOWData tab as well as many other climate resources. The Climate Prediction Center Link provides short and longer range climatic outlooks and education about the larger scale global circulations that impact temperatures and weather. With the large agriculture and farming presence along the central Gulf coast, the Drought Monitor link provides updates on drought trends and impacts. Another very helpful resource is the Community Collaborative Rain Hail and Snow (CoCoRaHS) network, which is a large group of volunteers working together to measure and map precipitation (rain, hail and snow). The aim of CoCoRaHS is to provide the highest quality data for natural resource, education and research applications. You can be a part of the CoCoRaHS team by becoming a volunteer rainfall observer. To learn more click on the CoCoRaHS link below.
National Weather Service Mobile AL Climate and Past Weather
Climate Prediction Center (CPC)
CoCoRaHS Network Water Year Summaries
![]()