January 2023 Climate Summaries
Mobile Alabama and Pensacola Florida Area
National Weather Service Mobile Alabama
February 2, 2023
January 2023 in Review - The year started off anomalously warm with monthly high, low and, average temperatures coming in 6° to 8° above normal. In fact, January 2023 in Pensacola broke into the top 10 warmest January's on record with an average temperature of 60° coming in 9th warmest. There are even some more notable monthly temperatures. The average monthly high alone at both Mobile and Pensacola broke into the top 5 warmest January's on record at number 3. The warmest and longest stretch of well above normal high temperatures occurred the first 12 days of the month when highs averaged and astounding 12.8° above normal at Mobile and 11.4° above normal at Pensacola. Mobile saw the occurrence of two record highs and two record high low temperatures. The morning low on the 2nd at Mobile smashed the previous record high low temperature that stood for 133 years. Pensacola saw eight new record highs and two record high low temperatures. More specifics on all the records will follow shortly. The only very brief cold spell and mainly to low temperatures was on the 14th and 15th at both Mobile and Pensacola, when morning lows dipped down into the lower 30's or 9° to 11° below normal these two days.
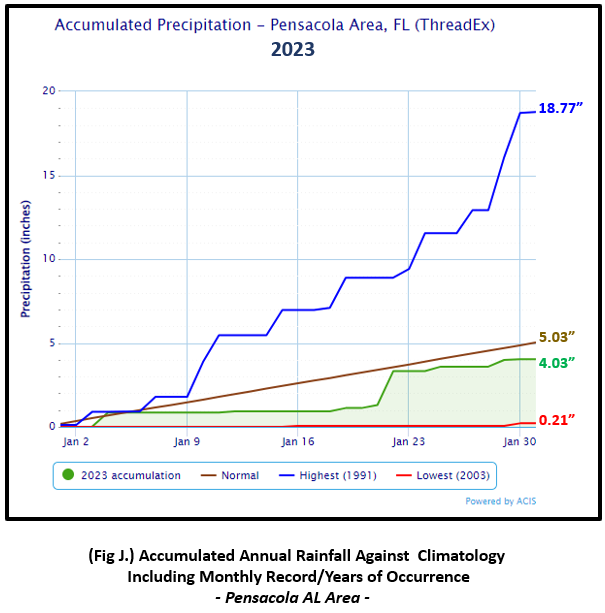
Rainfall for the year starts in deficit at both Mobile and Pensacola.
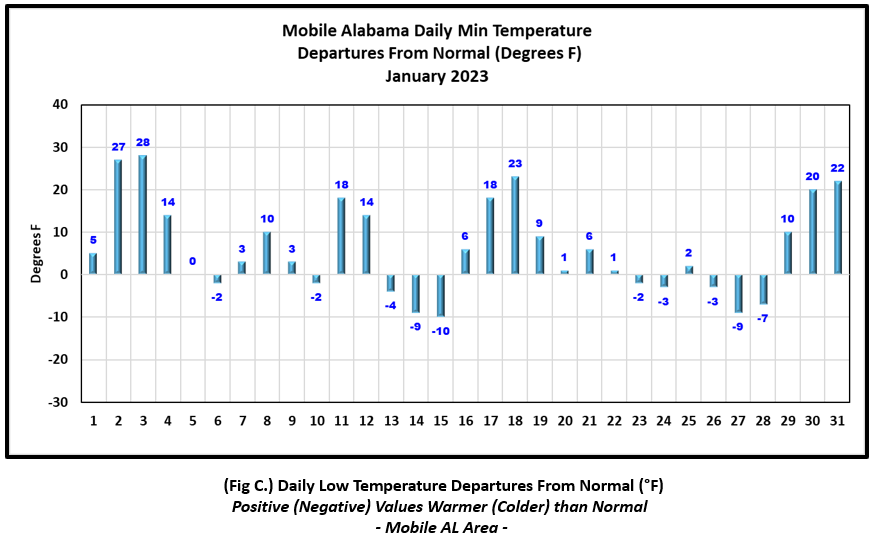
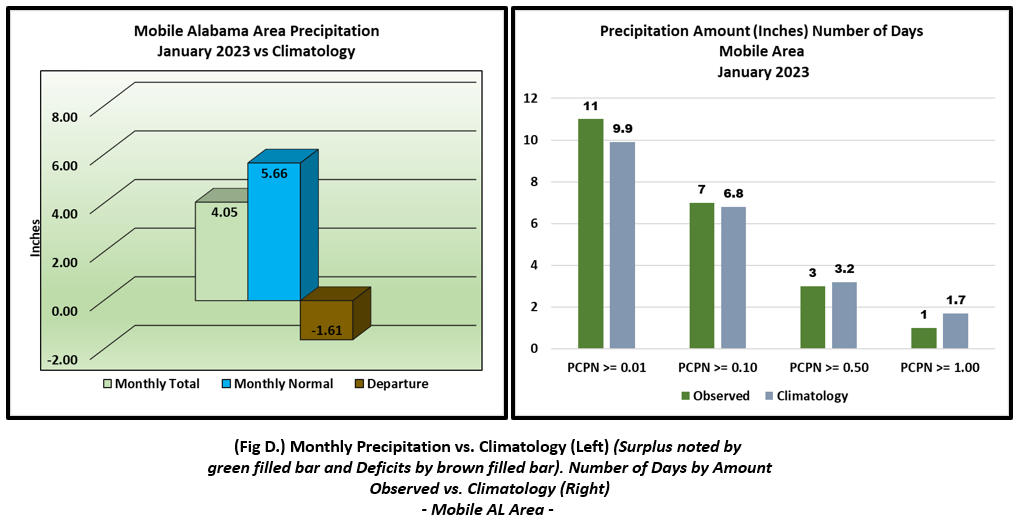
Mobile Alabama Area [Climate Normal Period 1991-2020, Climate Record Period 1872 to Present]- The average monthly high of 69.4° was 7.9° above normal. This now stands as the 3rd warmest average monthly high at Mobile for January. The average monthly low was 46.8° or 6.1° above normal. The average monthly temperature of 58.1° was 7.0° above normal. Mobile saw two record highs. The warmest day of the month, 82° on the 2nd surpassed the previous record of 80° set on this day in 2006. 79° on the 3rd tied the previous record occurrence on this date back in 1989. In addition, two record high lows occurred. 68° on the morning of the 2nd smashed the previous record of 64° which has stood for 133 years, set way back in 1890. 69° on the morning of the 3rd tied the previous record occurrence set on this day in 2000. The lowest temperature dipped to 30° on the morning of the 15th, 10° below normal for this date. (Fig. A) shows a graphical representation of how the Mobile area temperatures compared to the seasonal normal daily highs and lows, which are shown by the colored dashed lines. Bar graphs reflecting the daily high/low temperature departures from normal are provided in the table below (Figs. B and C). The rain gauge collected a 4.05" (Fig. D), or 1.61" below normal. The Mobile area annual precipitation trace is provided in (Fig. E). Click to view => Mobile's Monthly Weather Summary text product for January 2023 from the NWS Mobile.
Select January Top Records for the Month During the Period of Record for the Mobile Area:
Click on the Mobile Alabama area climate graphics below to expand:

|

|
|
|

|
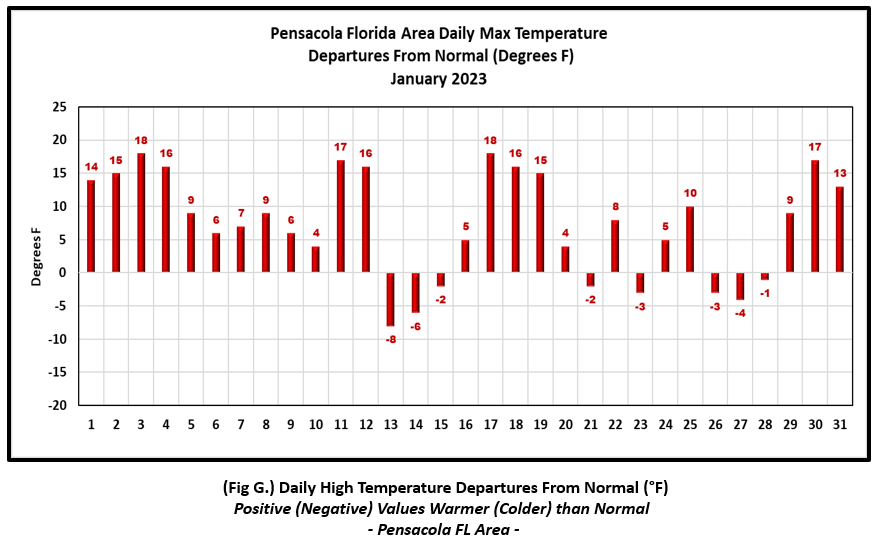
Pensacola Florida Area [Climate Normal Period 1991-2020, Climate Record Period 1879 to Present] - The average monthly high of 70.1° was 7.4° above normal. This now stands as the 3rd warmest average monthly high at Pensacola for January. The average monthly low was 50.0° or 6.3° above normal. The average monthly temperature of 60.0° stands at 6.8° above normal and is also the 9th warmest January's on record at Pensacola when considering the means. There were eight record highs and two record high lows for the month. Most notably, two record highs of 81° on the 3rd and 30th matched the all-time highest daily record for January. A breakout of the record temperatures are provided in table format in the graphics section below. The lowest temperature for the month dipped to 32° on the morning of the 15th, 11° below normal for this date. (Fig. F) shows a graphical representation of how the Pensacola area temperatures compared to the seasonal normal daily highs and lows, which are shown by the colored dashed lines. (Figs. G and H) shows the daily high/low temperature departures from normal. The rain gauge collected 4.03" (Fig. I), 1.00" below the monthly normal. The Pensacola area annual precipitation trace is provided in (Fig. J). Click to view => Pensacola's Monthly Weather Summary text product for January 2023 from the NWS Mobile.
Select January Top Records for the Month During the Period of Record for the Pensacola Area:
Click on the Pensacola Florida area climate graphics below to expand:

|
|

|

|
|

|
Additional January 2023 Climatology and Topics
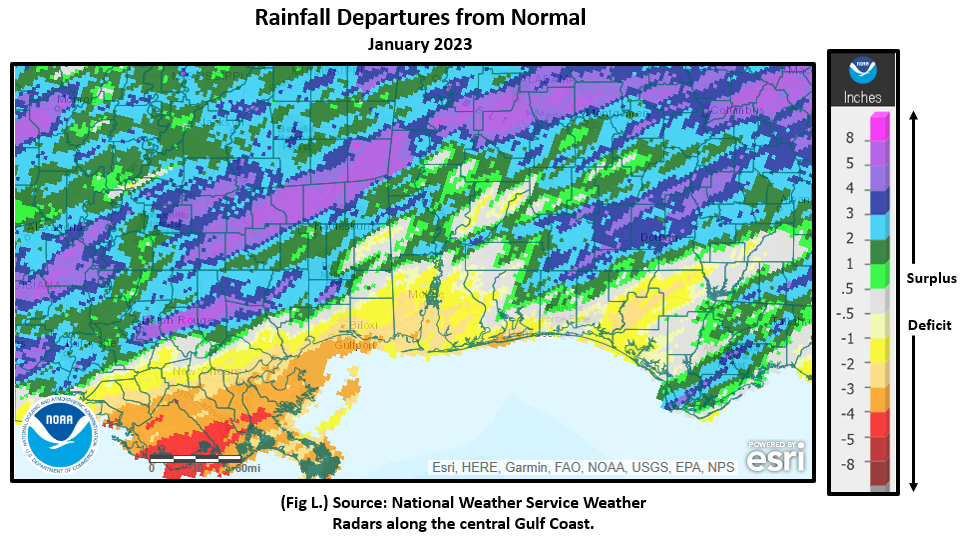
The bulk of the rain through the month of January was more focused over the interior, north of Interstate 10, but in patches. Highest rainfall departures in those areas were between 125 to 150% of normal rainfall. Fig. K shows the areal monthly rainfall total, Fig. L shows the areal rainfall departures from normal and Fig. M, the areal percent of normal rainfall. The latest January 2023 monthly summary for Eglin Air Force Base (AFB) - KVPS and Duke Field - KEGI has been received and provided in the table below. The temperatures in the daily tables consists of numbers both in °F/°C. Data courtesy of Mr. David Biggar, Staff Meteorologist, 96th Weather Squadron. Provided by permission.

|
|

|

Climate Summary - January 2023 |

|

|
February 2023 Climatology, Seasonal Climatology and Outlooks:
The latest outlook for February favors above normal temperatures east of the Mississippi River Valley with the coastal plain being bisected by temperatures favored to lean above normal west of I-65 and likely above east of the interstate and deeper into the southeast. The Mississippi River Valley appears to be the focus for above normal precipitation.
Click on the snap shots below to expand:
 February Normals February Normals |

|

Outlook |
Additional Climate Links:
The links below are intended to provide additional climate information, education and outlooks. The National Weather Service Mobile Alabama's Climate and Past Weather page provides climate data at your fingertips for many observation points in the local forecast area by accessing the NOWData tab as well as many other climate resources. The Climate Prediction Center Link provides short and longer range climatic outlooks and education about the larger scale global circulations that impact temperatures and weather. With the large agriculture and farming presence along the central Gulf coast, the Drought Monitor link provides updates on drought trends and impacts. Another very helpful resource is the Community Collaborative Rain Hail and Snow (CoCoRaHS) network, which is a large group of volunteers working together to measure and map precipitation (rain, hail and snow). The aim of CoCoRaHS is to provide the highest quality data for natural resource, education and research applications. You can be a part of the CoCoRaHS team by becoming a volunteer rainfall observer. To learn more click on the CoCoRaHS link below.
National Weather Service Mobile AL Climate and Past Weather
Climate Prediction Center (CPC)
CoCoRaHS Network Water Year Summaries