January 2020 Climate Summaries
Mobile Alabama and Pensacola Florida Area
National Weather Service Mobile Alabama
February 2, 2020
January 2020 in Review - To open up the new year, a long duration of daily highs well above seasonal was the rule more than the exception for the first two thirds of the month of January for both the Mobile and Pensacola areas. Daily highs tapered closer to seasonal values to end the month. Three daily record high temperatures were reached, one at Mobile and two at Pensacola. As for lows, a notable warm spell on the mornings of the 10th through the 18th was observed. Mobile saw lows averaging 17.6° above normal while at Pensacola for the same time period saw lows averaging 18.8° above normal. Soon to follow would be a few days of lows plunging to well below normal. Mobile and Pensacola both set a new one day record rainfall.
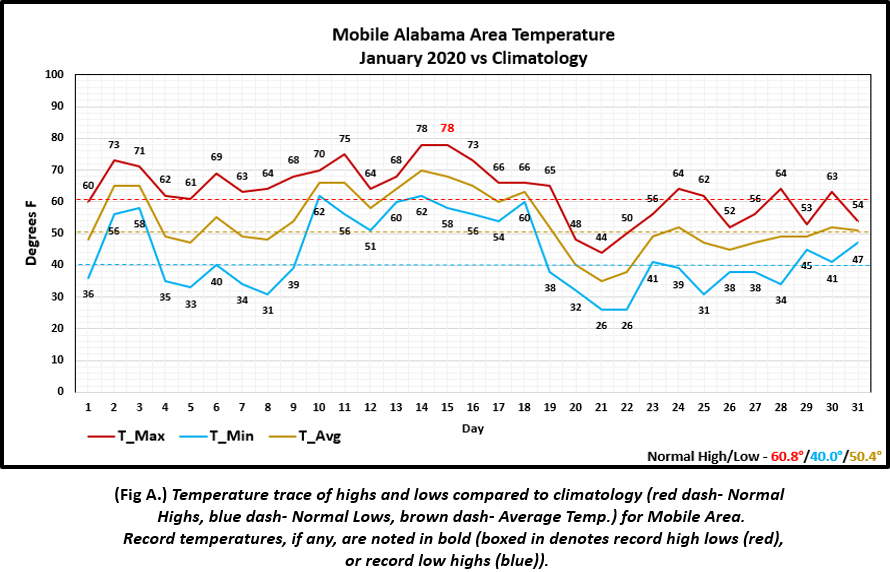
Mobile Alabama Area - The average monthly high of 63.2° was 2.4° above normal. The average monthly low of 43.8° was 3.8° above normal. The average monthly temperature of 53.5° was 3.1° above normal. One record was reached and that was the high of 78° on the 15th which tied the previous record set on this date back in 1974. (Fig. A) shows how the Mobile area temperatures compared to the seasonal normal monthly highs and lows, which are shown by the colored dashed lines. A period of heavy rainfall resulted in 2.26" on the 3rd, adding up to a new record one day rainfall. The previous record daily rainfall on this date was 2.15" set way back in 1886. Total rainfall for January (Fig. B) measured 4.57" or 1.08" below normal. A precipitation trace for the Mobile area is provided in the graphics below.
Click on the Mobile Alabama area climate graphics below to expand:
|

|

|
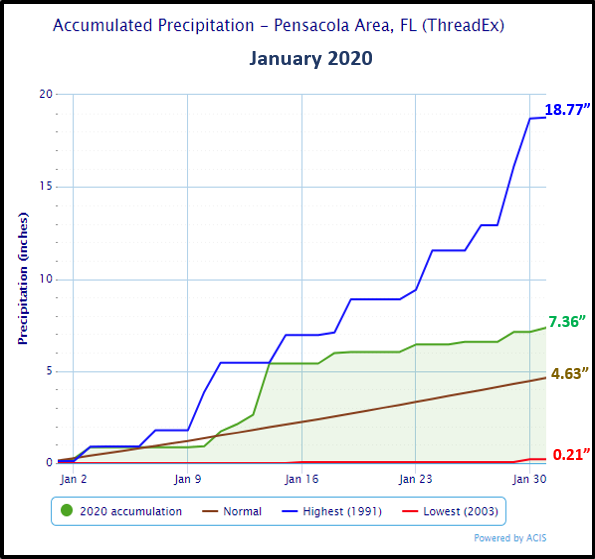
Pensacola Florida Area - The average monthly high of 65.8° was 5.3°above normal. The average monthly low of 48.5° was 6.3° above normal. The average monthly temperature of 57.2° was 5.8° above normal. Two record highs were reached. 79° on the 3rd broke the previous record of 78° for this date set in 1997 and 79° on the 15th broke the previous record of 77° set on this date in 2017. (Fig. C) shows how the Pensacola area temperatures compared to the seasonal normal monthly highs and lows, which are shown by the colored dashed lines. A period of heavy rainfall resulted in 2.78" on the 14th, which added up to a new record one day rainfall. The previous record daily rainfall on this date was 2.14" set back in 1977. Total rainfall for January (Fig. D) measured 7.36" coming in well above normal by 2.73". A precipitation trace for the Pensacola area is provided in the graphics below.
Click on the Pensacola Florida area climate graphics below to expand:

|

|
|
February Climatology and Outlooks:
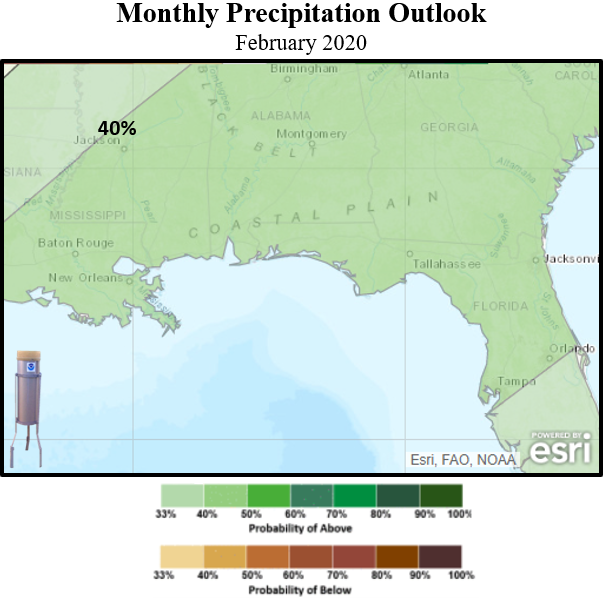
The latest monthly outlook for temperatures continues to favor above normal temperatures with a 40 to 50% probability outlooked over the southeast US to the coastal plain. Above normal rainfall is favored.
Click on the snap shots below to expand:

|

Outlook |
Outlook |
|
Climate Prediction Center's Interactive Long Range Outlooks
Additional Climate Links:
The links below are intended to provide additional climate information, education and outlooks. The National Weather Service Mobile Alabama's Climate and Past Weather page provides climate data at your fingertips for many observation points in the local forecast area by accessing the NOWData tab as well as many other climate resources. The Climate Prediction Center Link provides short and longer range climatic outlooks and education about the larger scale global circulations that impact temperatures and weather. With the large agriculture and farming presence along the central Gulf coast, the Drought Monitor link provides updates on drought trends and impacts. Another very helpful resource is the Community Collaborative Rain Hail and Snow (CoCoRaHS) network, which is a large group of volunteers working together to measure and map precipitation (rain, hail and snow). The aim of CoCoRaHS is to provide the highest quality data for natural resource, education and research applications. You can be a part of the CoCoRaHS team by becoming a volunteer rainfall observer. To learn more click on the CoCoRaHS link below.
National Weather Service Mobile AL Climate and Past Weather
Climate Prediction Center (CPC)
CoCoRaHS Network Water Year Summaries


