February 2025 Climate Summaries
Mobile Alabama and Pensacola Florida Area
National Weather Service Mobile Alabama
March 3, 2025
February 2025 in Review - The month saw above normal temperatures when considering all three metrics => highs, lows and means. In fact, in the high temperature department, the average monthly high was the 8th warmest on record at Mobile. For nearly the first two weeks of the month, it felt like Spring with a notable warm spell evolving which included three days at Mobile seeing record highs and record high low temperatures while Pensacola saw two days. For the 1st to the 15th, Mobile's highs averaged 10.2° and lows 11.7° above normal while Pensacola saw highs average 9.1° and lows 11.3° above normal during the period. Moving into the middle of the month, a series of cold frontal passages and reinforcing surface high pressure systems brought a reminder that we are still in the cold season when daily temperatures dropped to well below normal from the 17th to the 24th For that period, highs averaged 10.9° and lows 10.3° below normal at Mobile while Pensacola saw highs average 10.3° and lows 11.0° below normal. Nights remained cool, but highs rebounded to above normal the end of the month.
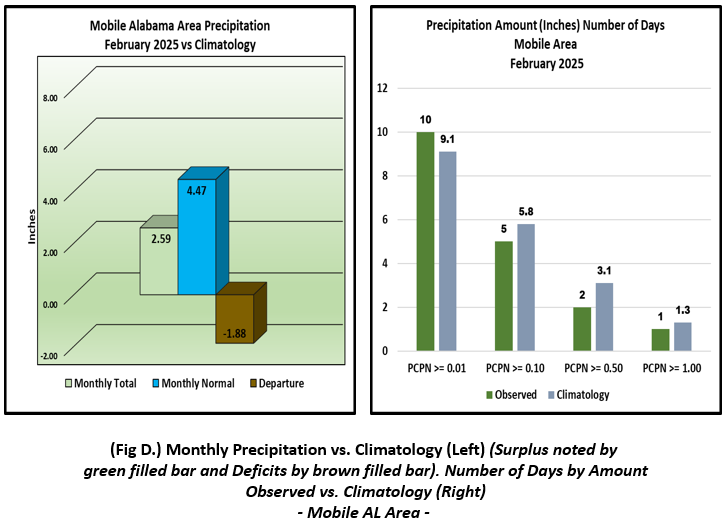
Monthly rainfall was in deficit by well over an inch at Mobile and Pensacola.
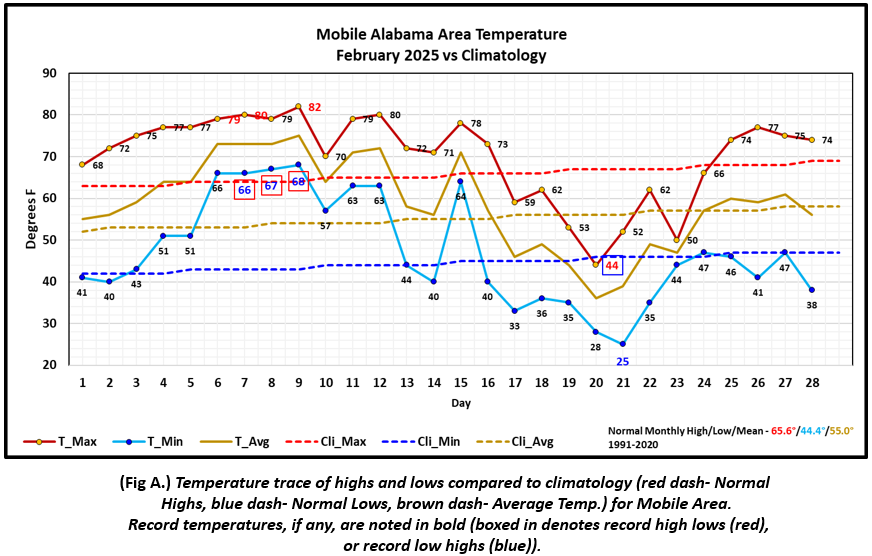
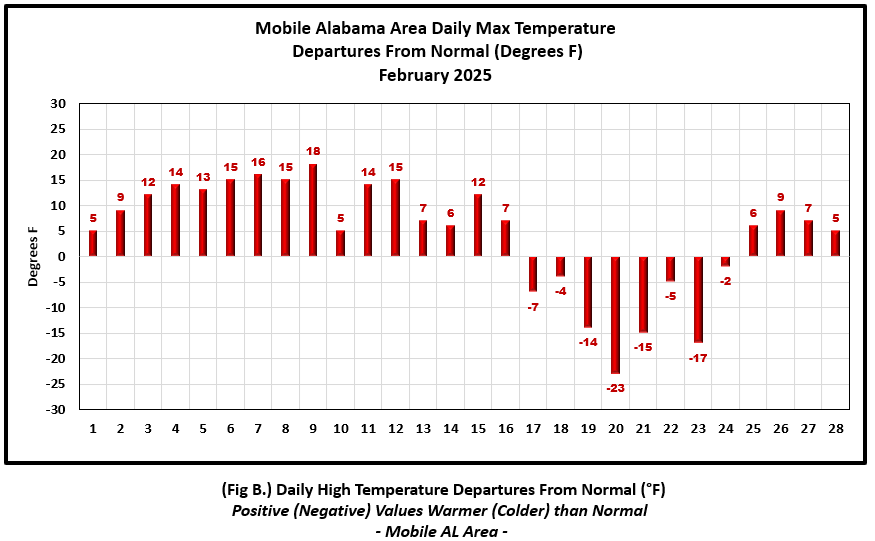
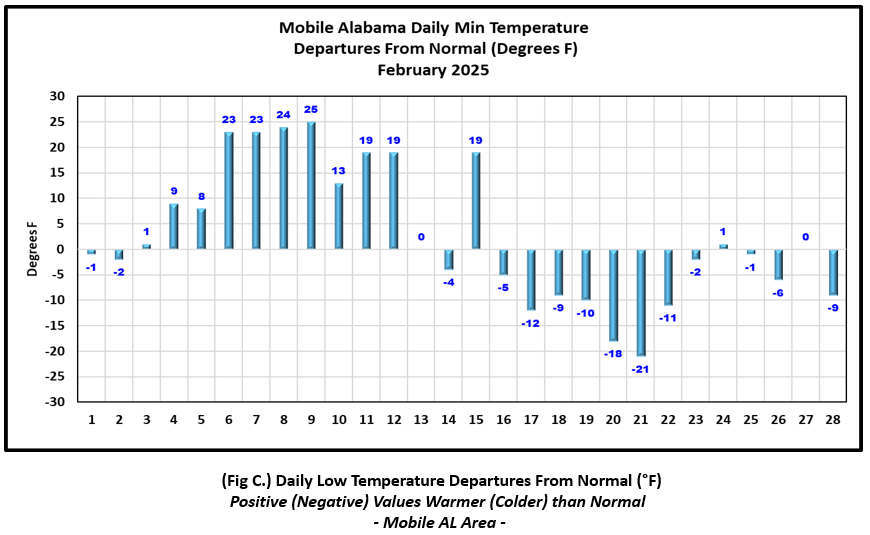
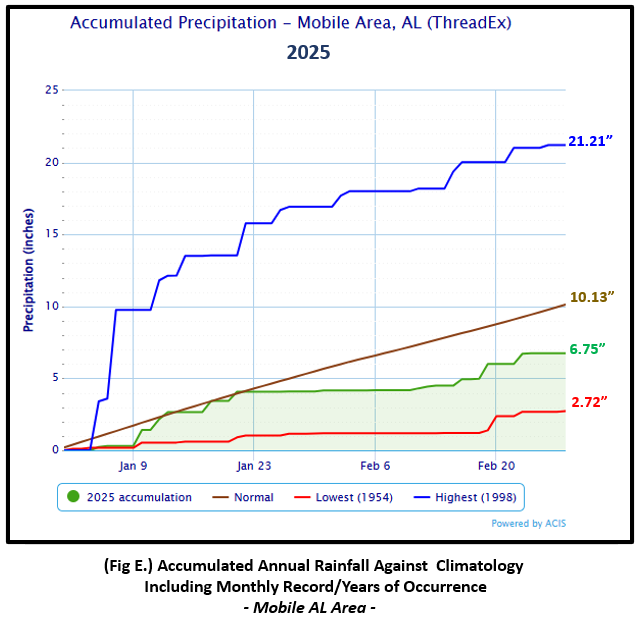
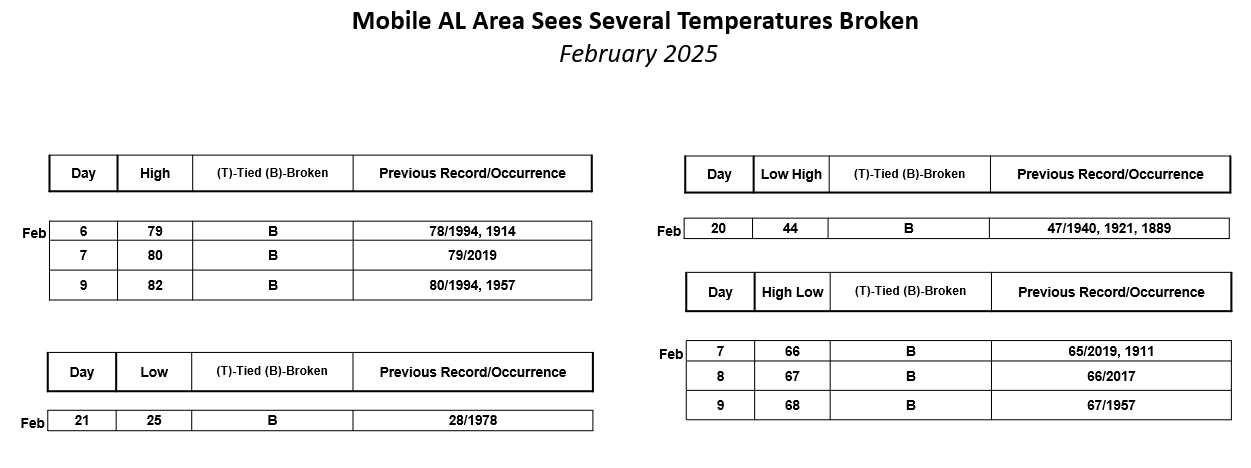
Mobile Alabama Area [Climate Normal Period 1991-2020, Climate Record Period 1872 to Present]- The average monthly high of 70.0° was 4.4° above normal and 8th warmest monthly average February high on record. The average monthly low was 47.1° or 2.7° above normal. The average monthly temperature of 58.6° was 3.6° above normal. The highest temperature for the month, 82°, occurred on the 9th and 18° above normal for the date. The lowest temperature for the month plummeted to 25° on the morning of the 21st, 21° below normal for the date. Mobile saw eight record temperatures for the month of February. (Fig. A) shows a graphical representation of how the Mobile area temperatures compared to the seasonal normal daily highs and lows, which are shown by the colored dashed lines. Bar graphs reflecting the daily high/low temperature departures from normal are provided in the table below (Figs. B and C). The rain gauge collected a 2.59" (Fig. D), or 1.88" below normal. Accumulated rainfall to date indicates a deficit by over three inches against typical (Fig. E).
February Top Records for the Month During the Period of Record for the Mobile Area:
Click on the Mobile Alabama area climate graphics below to expand:
|
|
|
|
|
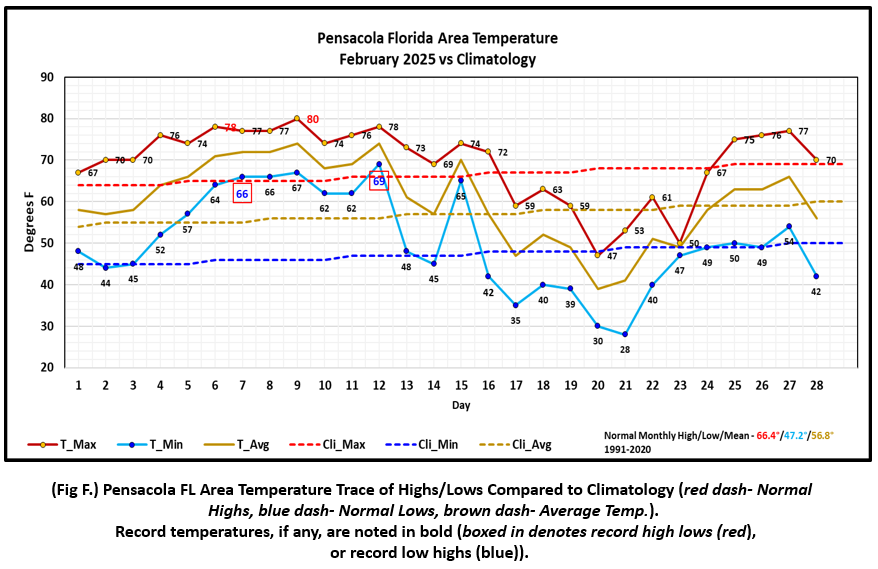
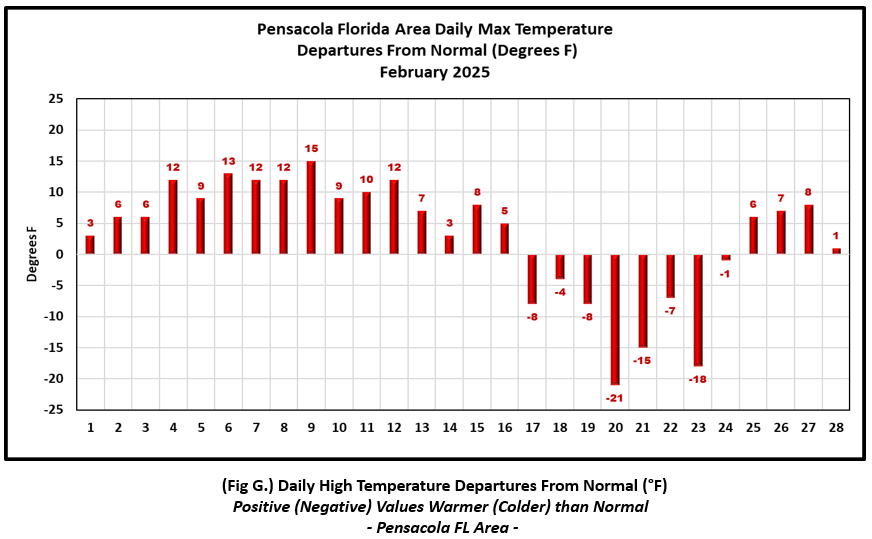
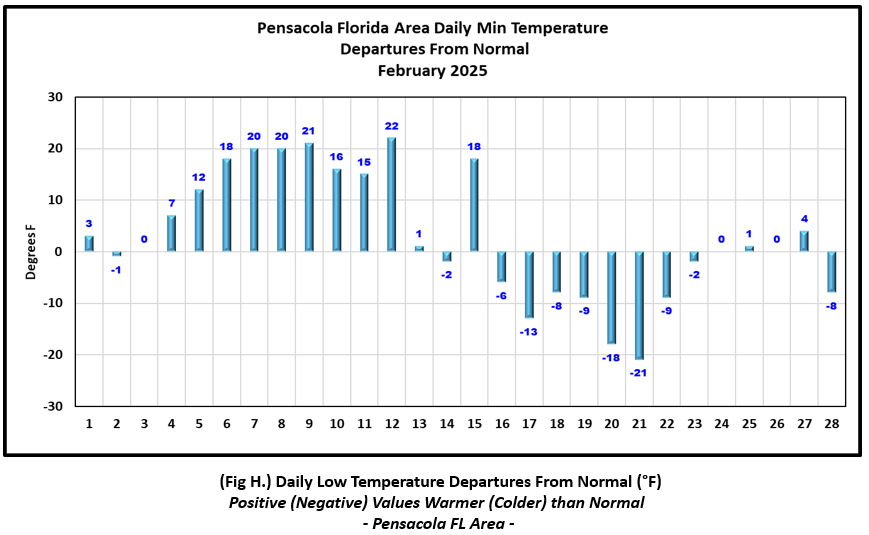
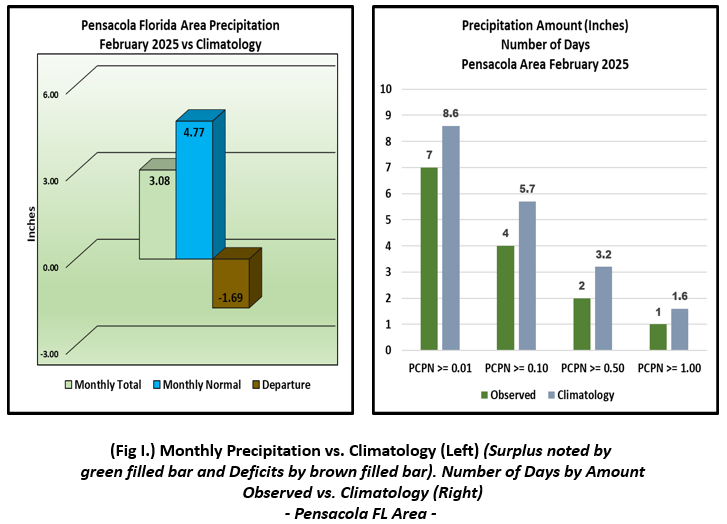
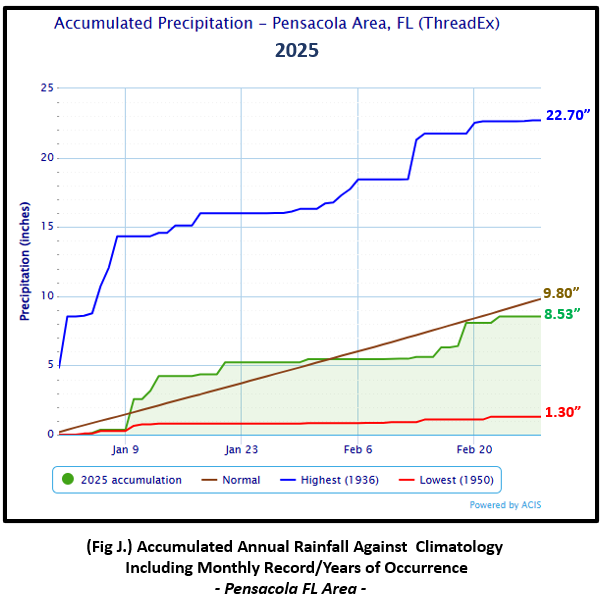
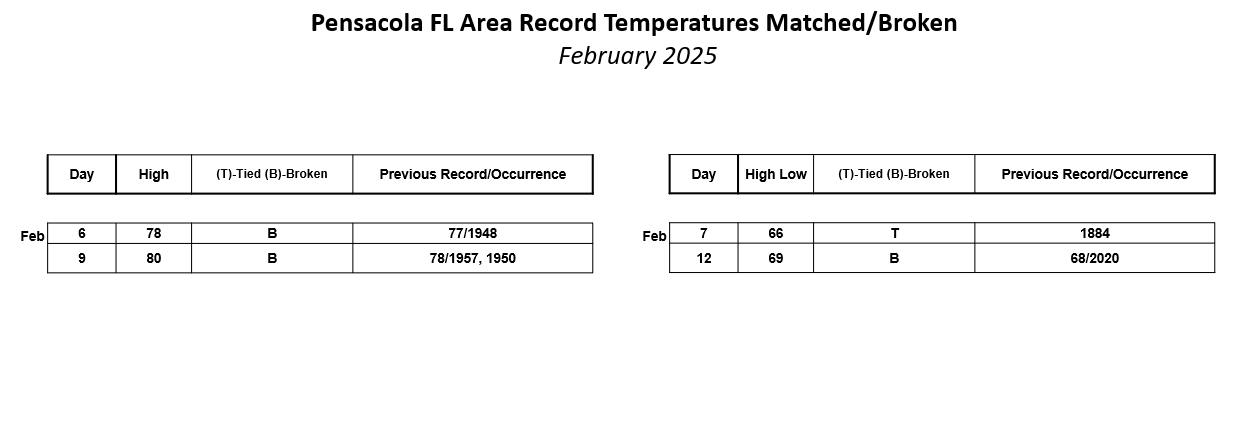
Pensacola Florida Area [Climate Normal Period 1991-2020, Climate Record Period 1879 to Present] - Interestingly all three average temperature metrics were 3.0° above normal. The average monthly high was 69.4°. The average monthly low was 50.2°. The average monthly temperature was 59.8°. The highest temperature for the month, 80°, occurred on the 9th and was 15° above normal for the date. The lowest temperature for the month dipped to 28° on the morning of the 21st, 21° below normal for the date. Pensacola saw four record temperatures for the month of February. (Fig. F) shows a graphical representation of how the Pensacola area temperatures compared to the seasonal normal daily highs and lows, which are shown by the colored dashed lines. (Figs. G and H) shows the daily high/low temperature departures from normal. The rain gauge collected a hair over three inches at 3.08" (Fig. I), 1.69" below the monthly normal. Accumulated rainfall to date indicates a deficit by over an inch compared to normal (Fig. J).
February Top Records for the Month During the Period of Record for the Pensacola Area:
Click on the Pensacola Florida area climate graphics below to expand:
|
|
|
|
|
Additional February 2025 Climatology and Topics
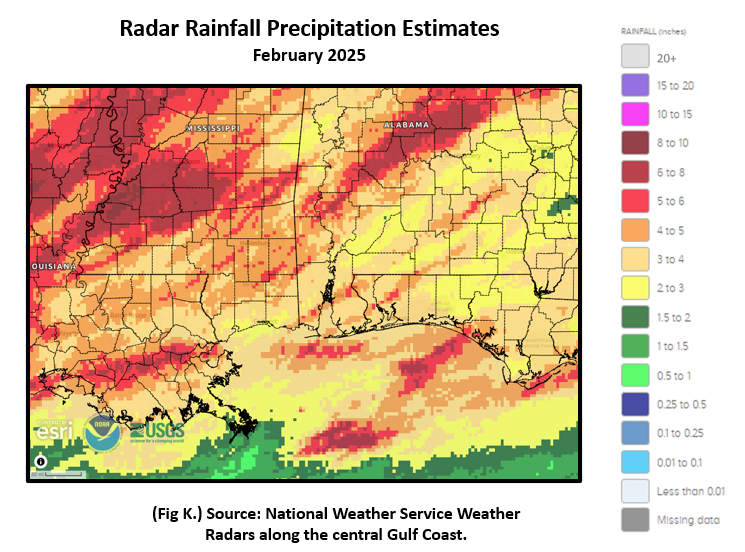
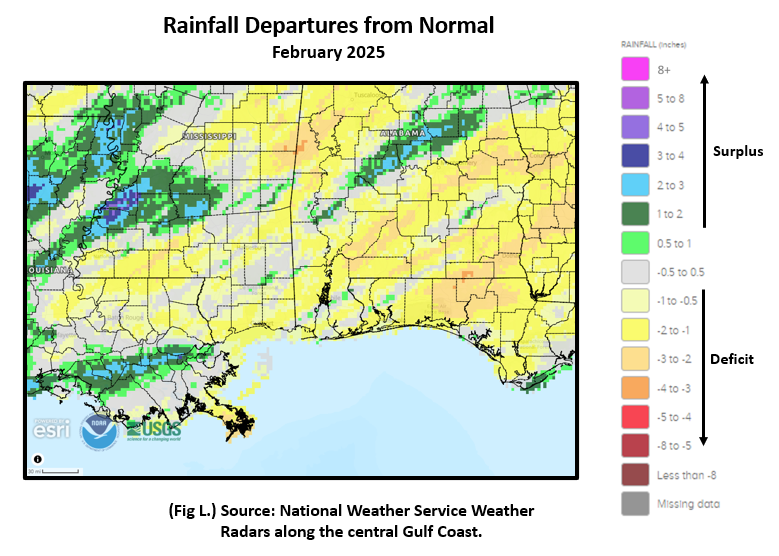
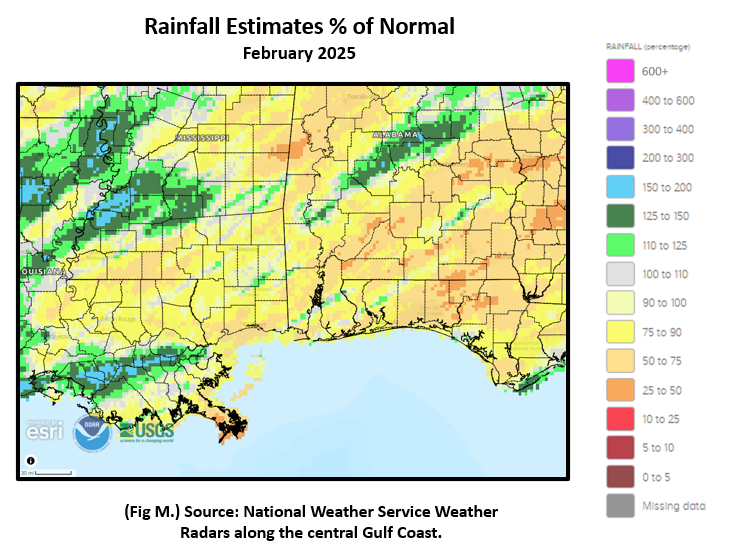
The central Gulf coast saw a range of mostly 2 to 5 inches of rain was mainly along and west of I-65. A few streaks in northeast to southwest oriented bands saw isolated higher amounts. Much of the area saw below normal rainfall for the month. Fig. K shows the areal monthly rainfall total, Fig. L shows the areal rainfall departures from normal and Fig. M, the areal percent of normal rainfall.
The latest February 2025 Monthly Climate Summary for Eglin Air Force Base (KVPS) and Duke Field (KEGI) has been provided courtesy of Mr. David Biggar, Staff Meteorologist, 96th Weather Squadron. Provided by permission.
|
|
|
March 2025 Climatology, Seasonal Climatology and Outlooks:
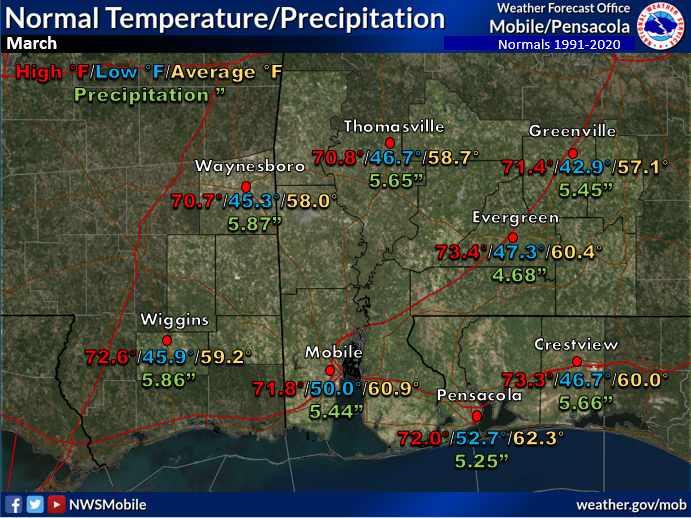
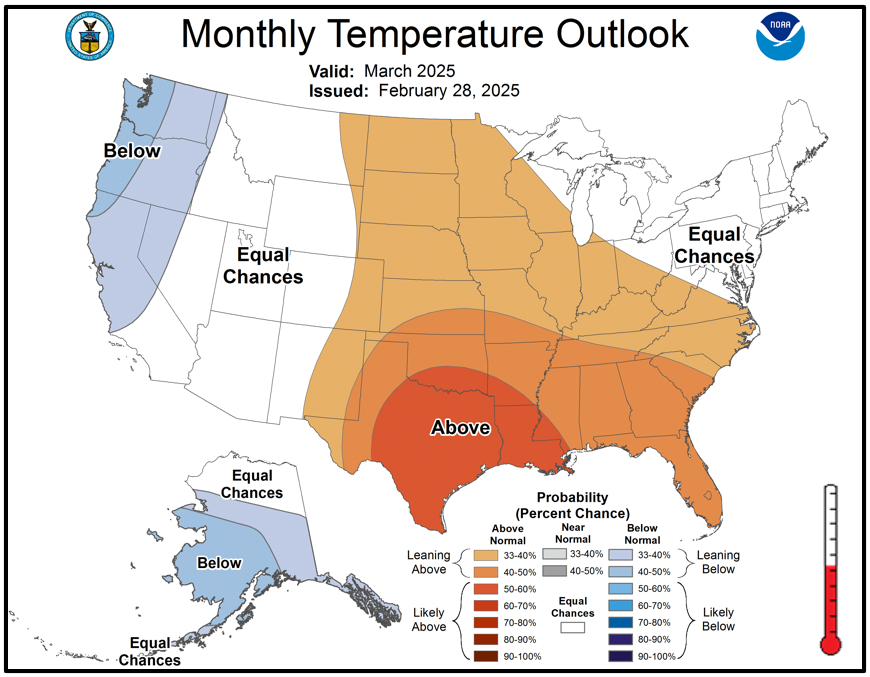
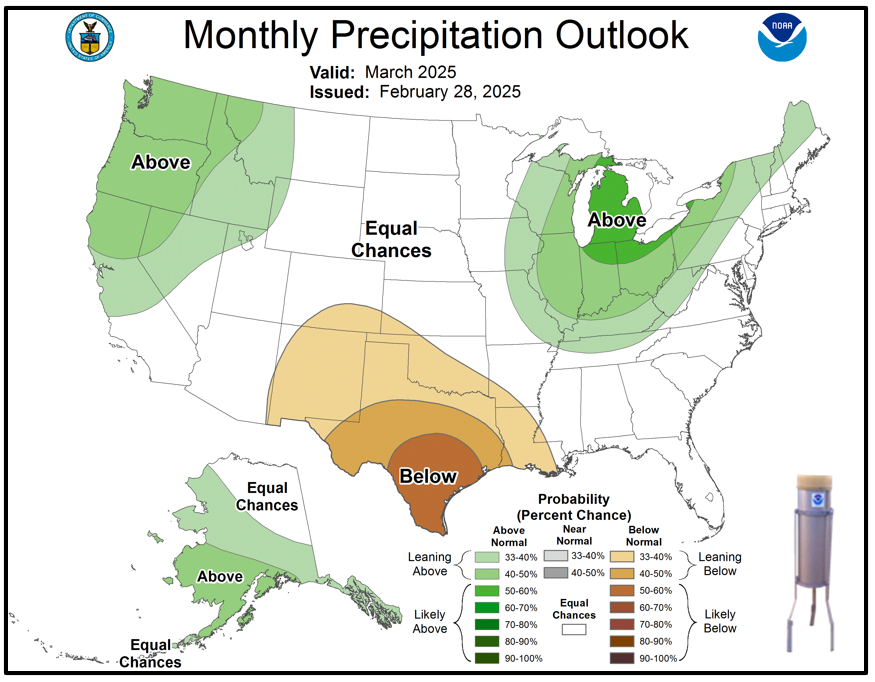
As we begin to enter spring, the latest outlook for March favors temperatures leaning above normal over the deep south and equal chances of above or below normal precipitation over the coastal plain. Although we have had an anomalously warm spell, bouts of cold weather can be detrimental to young garden vegetable seedlings during the month of March.
Click on the snap shots below to expand:
 March Normals March Normals |
|
Outlook |
|

|
Additional Climate Links:
The National Weather Service Mobile Alabama's Climate and Past Weather page provides climate data at your fingertips for many observation points in the local forecast area by accessing the NOWData tab as well as many other climate resources. The Climate Prediction Center Link provides short and longer range climatic outlooks and education about the larger scale global circulations that impact temperatures and weather. With the large agriculture and farming presence along the central Gulf coast, the Drought Monitor link provides updates on drought trends and impacts. Another very helpful resource is the Community Collaborative Rain Hail and Snow (CoCoRaHS) network, which is a large group of volunteers working together to measure and map precipitation (rain, hail, and snow). The aim of CoCoRaHS is to provide the highest quality data for natural resource, education and research applications. You can be a part of the CoCoRaHS team by becoming a volunteer rainfall observer.


