February 2022 Climate Summaries
Mobile Alabama and Pensacola Florida Area
National Weather Service Mobile Alabama
March 2, 2022
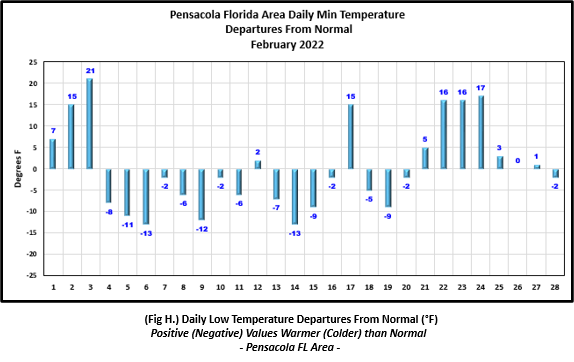
February 2022 in Review - For most of the first half of the month of February, highs and lows were close to and at times below normal. Within this period, there was a long period where lows were most notably and consistently well below normal. Morning lows for the Mobile area from the 4th to the 15th averaged 11.9° below normal. Meanwhile, Pensacola's morning lows from the 4th to the 20th averaged 5.2° below normal. The latter end of the month saw a brief stretch of record breaking warmth with highs topping out in the lower 80's for the Mobile area averaging 13.6 degrees above normal from the 22nd to the 24th. During this span, a record high was tied on the 22nd and broken on the 23rd. Although Pensacola saw a warm-up as well, daily highs fell short of the 80 degree mark and no records were reached. Average monthly temperatures were very close to normal at both Mobile and Pensacola.
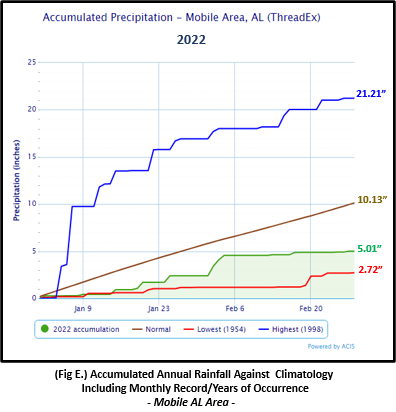
Rainfall fell short of normal by nearly a couple inches at both Mobile and Pensacola and combined with the lack of rainfall from January is contributing to an expansion of moderate drought conditions along much of the central Gulf coast.
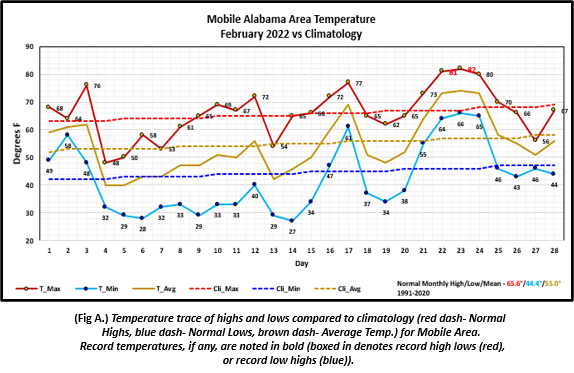
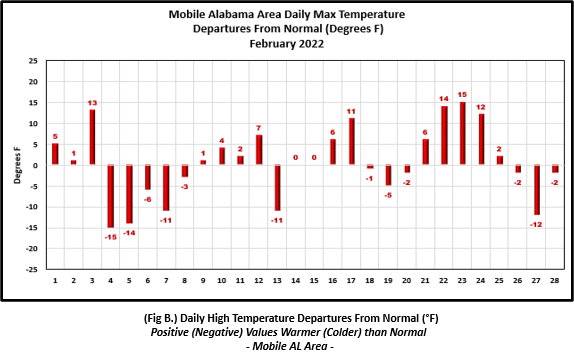
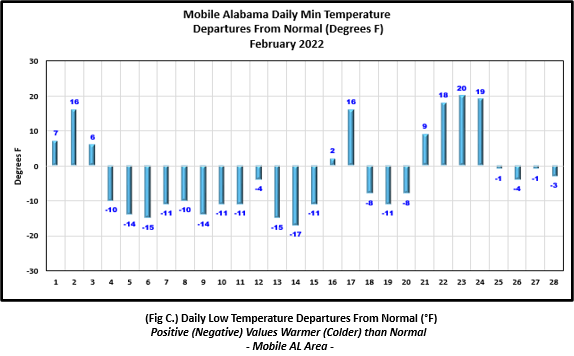
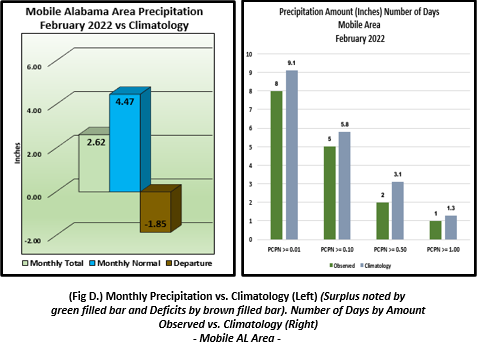
Mobile Alabama Area [Climate Normal Period 1991-2020, Climate Record Period 1872 to Present]- The average monthly high of 66.1° was 0.5° above normal. The average monthly low was 42.1° or 2.3° below normal. The average monthly temperature of 54.1° was 0.9° below normal. The highest temperature for the month, 82°, occurred on the 23rd and also set a new record for this date edging out the old record set in 1980 by one degree. It fell short, though, by just two degrees of reaching the all-time record daily high for the month. The high temperature on the 22nd, 81°, tied the previous record for this date set in 2018. The lowest temperature for the month dipped to 27° on the morning of the 14th, 17° below normal for this date. (Fig. A) shows a graphical representation of how the Mobile area temperatures compared to the seasonal normal daily highs and lows, which are shown by the colored dashed lines. Bar graphs reflecting the daily high/low temperature departures from normal are provided in the table below (Figs. B and C). The rain gauge collected a 2.62" (Fig. D), or 1.85" below normal. Accumulated rainfall climatology indicates a deficit for Mobile by several inches (Fig. E).
February Top Records for the Month During the Period of Record for the Mobile Area:
Click on the Mobile Alabama area climate graphics below to expand:
|
|
|
|
|
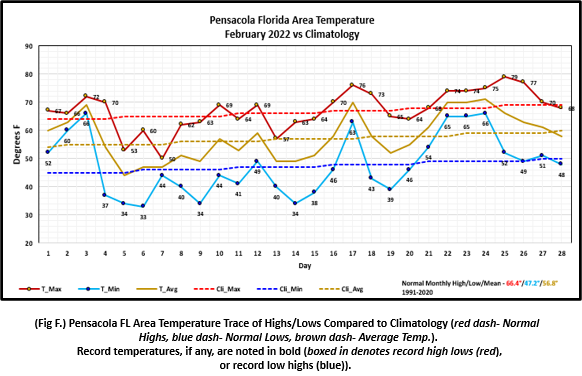
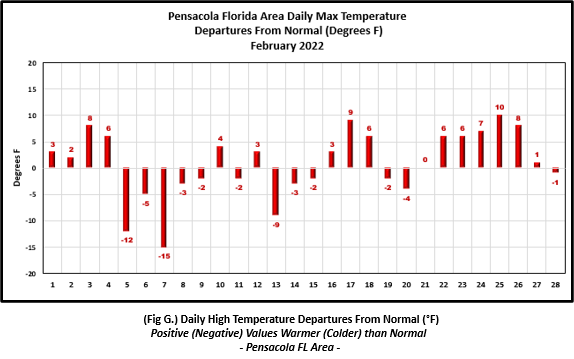
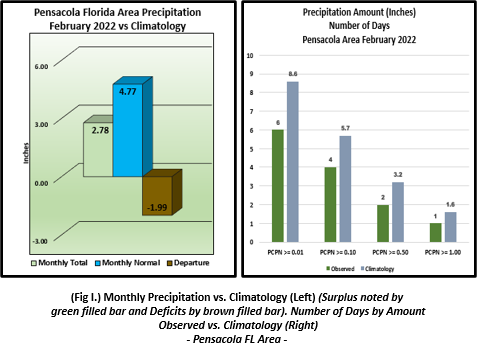
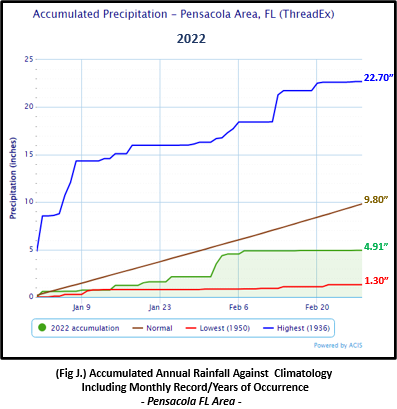
Pensacola Florida Area [Climate Normal Period 1991-2020, Climate Record Period 1879 to Present] - The average monthly high of 67.2° was 0.8° above normal. The average monthly low was 47.6° or 0.4° above normal. The average monthly temperature of 57.4° was 0.6° above normal. The highest temperature for the month, 79°, occurred on the 25, 10° above the normal for the date. The lowest temperature for the month dipped to 33° on the morning of the 6th, 13° below normal for this date. No record highs and lows were reached. (Fig. F) shows a graphical representation of how the Pensacola area temperatures compared to the seasonal normal daily highs and lows, which are shown by the colored dashed lines. (Figs. G and H) shows the daily high/low temperature departures from normal. The rain gauge collected 2.78" (Fig. I), 1.99" below the monthly normal. Accumulated rainfall climatology indicates a deficit for Pensacola by several inches (Fig. J).
February Top Records for the Month During the Period of Record for the Pensacola Area:
Click on the Pensacola Florida area climate graphics below to expand:
|
|
|
|
|
Additional February 2022 Climatology and Topics
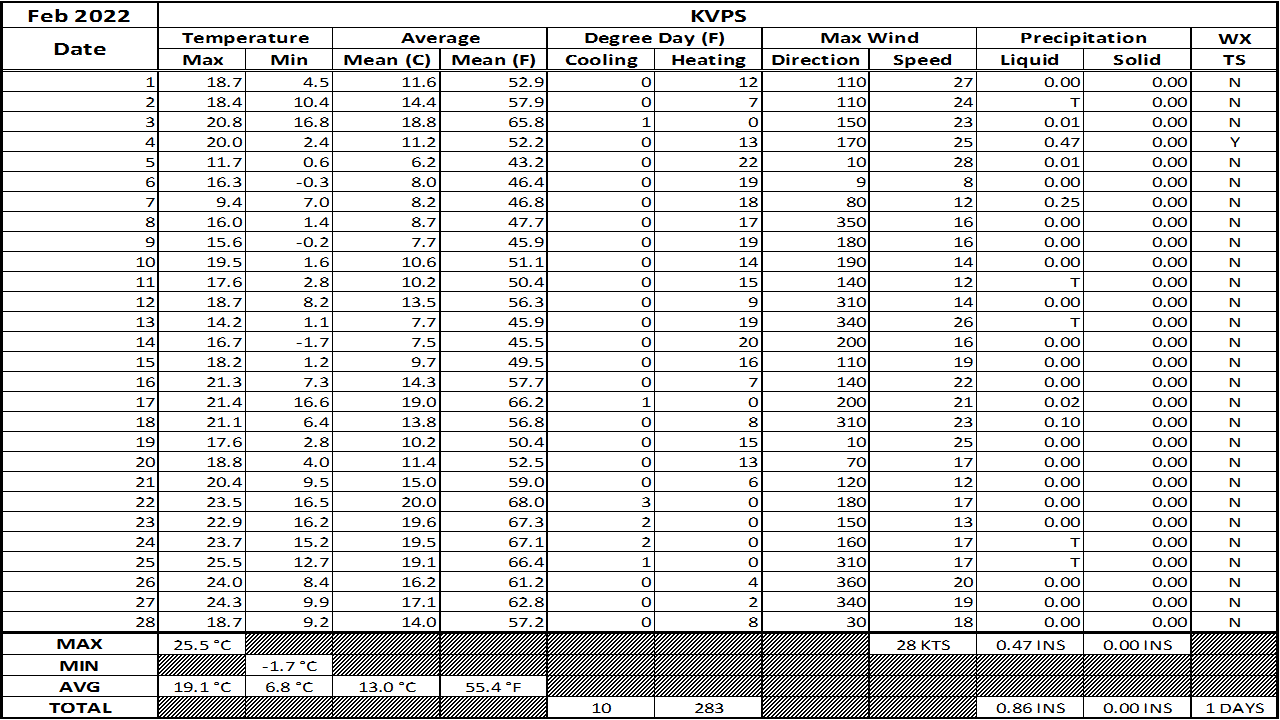
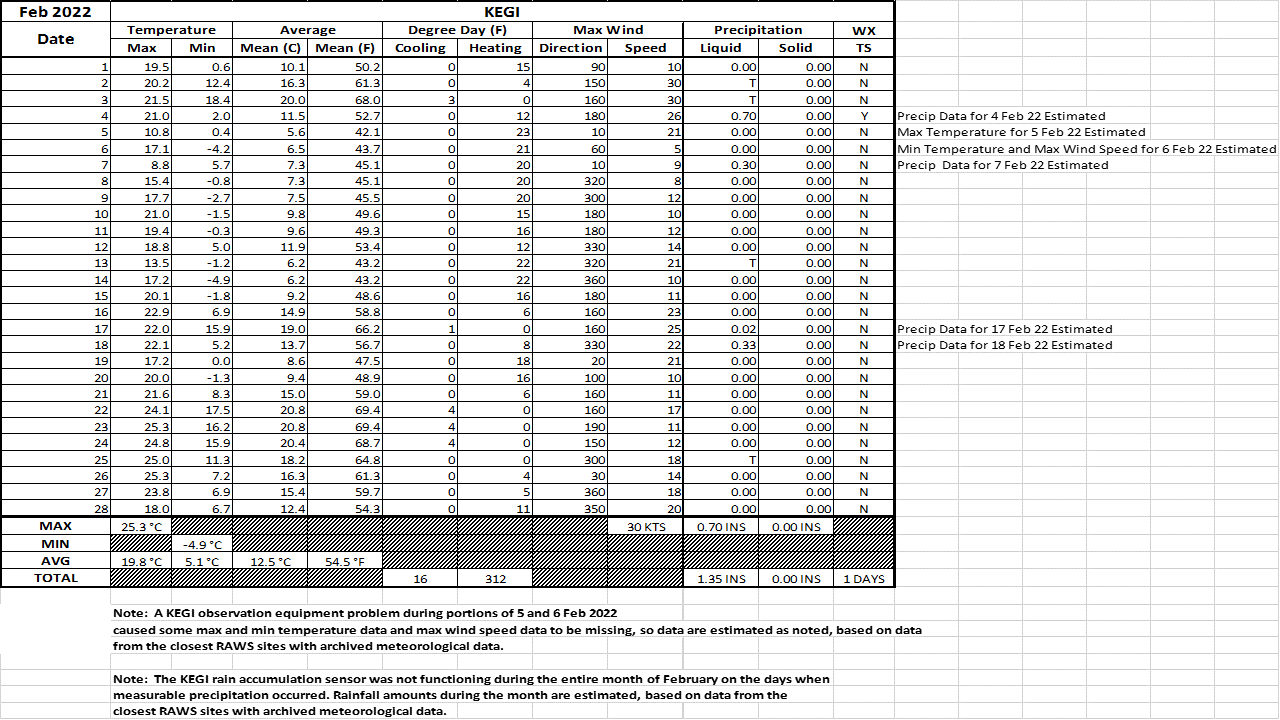
The latest February 2022 monthly summary for Eglin Air Force Base (AFB) - KVPS and Duke Field - KEGI has been received and provided in the table below. The temperatures in the daily tables consists of numbers both in °F/°C. Data courtesy of Mr. David Biggar, Staff Meteorologist, 96th Weather Squadron. Provided by permission.

|
|
|
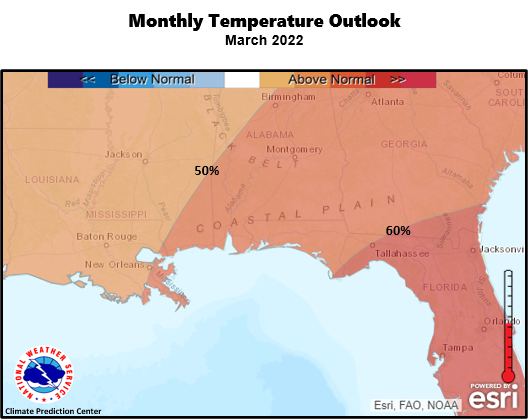
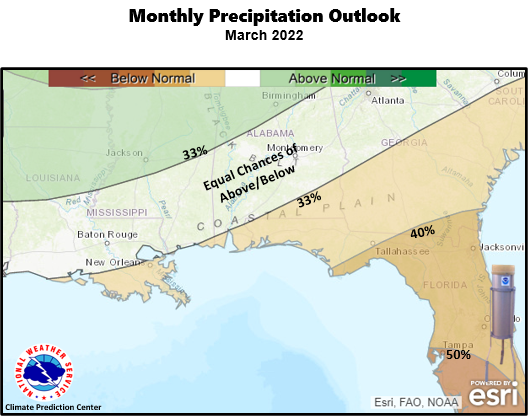
March 2022 Climatology, Seasonal Climatology and Outlooks:
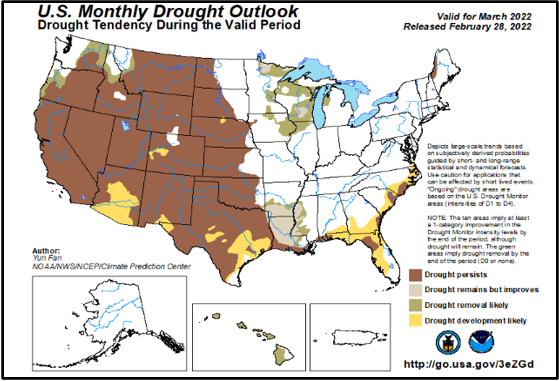
As we begin to enter spring, the latest outlook for March favors temperatures to be likely above normal and precipitation leaning below normal over the southeast US. Equal chances of precipitation being above or below normal is favored over much of the interior of the local area. With rainfall deficits rearing its ugly head, early spring plantings may exhibit stress due to lessened soil moisture. Moderate drought conditions has expanded over coastal Alabama and into much of of the northwest Florida Panhandle.
Click on the snap shots below to expand:
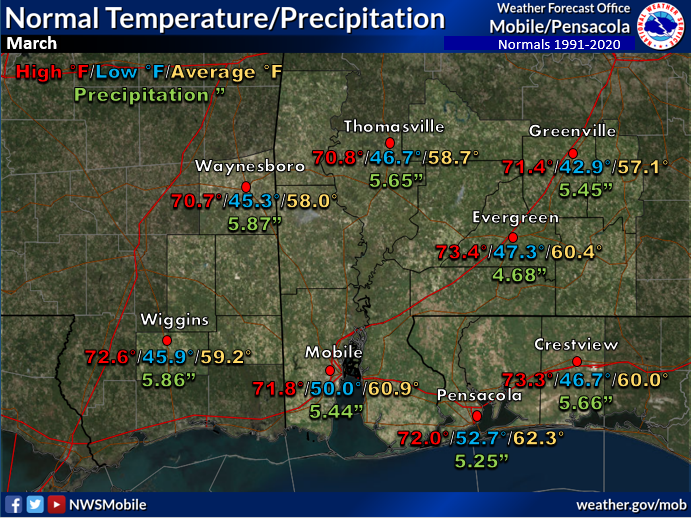 March Normals March Normals |
|
Outlook |
|

|
Additional Climate Links:
The links below are intended to provide additional climate information, education and outlooks. The National Weather Service Mobile Alabama's Climate and Past Weather page provides climate data at your fingertips for many observation points in the local forecast area by accessing the NOWData tab as well as many other climate resources. The Climate Prediction Center Link provides short and longer range climatic outlooks and education about the larger scale global circulations that impact temperatures and weather. With the large agriculture and farming presence along the central Gulf coast, the Drought Monitor link provides updates on drought trends and impacts. Another very helpful resource is the Community Collaborative Rain Hail and Snow (CoCoRaHS) network, which is a large group of volunteers working together to measure and map precipitation (rain, hail and snow). The aim of CoCoRaHS is to provide the highest quality data for natural resource, education and research applications. You can be a part of the CoCoRaHS team by becoming a volunteer rainfall observer. To learn more click on the CoCoRaHS link below.
National Weather Service Mobile AL Climate and Past Weather
Climate Prediction Center (CPC)
CoCoRaHS Network Water Year Summaries
![]()